

Review
doi: 10.1155/2015/746150.
Epub 2015 Aug 13.
Factors Affecting Cirrus-HD OCT Optic Disc Scan Quality: A Review with Case Examples
Affiliations
- PMID: 26351574
- PMCID: PMC4550770
- DOI: 10.1155/2015/746150
Item in Clipboard
Review
Factors Affecting Cirrus-HD OCT Optic Disc Scan Quality: A Review with Case Examples
J Ophthalmol.
2015.
Abstract
Spectral-domain OCT is an established tool to assist clinicians in detecting glaucoma and monitor disease progression. The widespread use of this imaging modality is due, at least in part, to continuous hardware and software advancements. However, recent evidence indicates that OCT scan artifacts are frequently encountered in clinical practice. Poor image quality invariably challenges the interpretation of test results, with potential implications for the care of glaucoma patients. Therefore, adequate knowledge of various imaging artifacts is necessary. In this work, we describe several factors affecting Cirrus HD-OCT optic disc scan quality and their effects on measurement variability.
Figures

Dry eye. Cirrus HD-OCT retinal nerve fiber layer (RNFL) deviation maps ((a)-(b)), circular tomograms ((c)-(d)), and printout results ((e)-(f)) before (left) and after (right) instillation of artificial tears. Note the OCT color enhancement on the circular tomogram (d) and the overall increased RNFL thickness after adequate ocular lubrication (f). SS: signal strength.
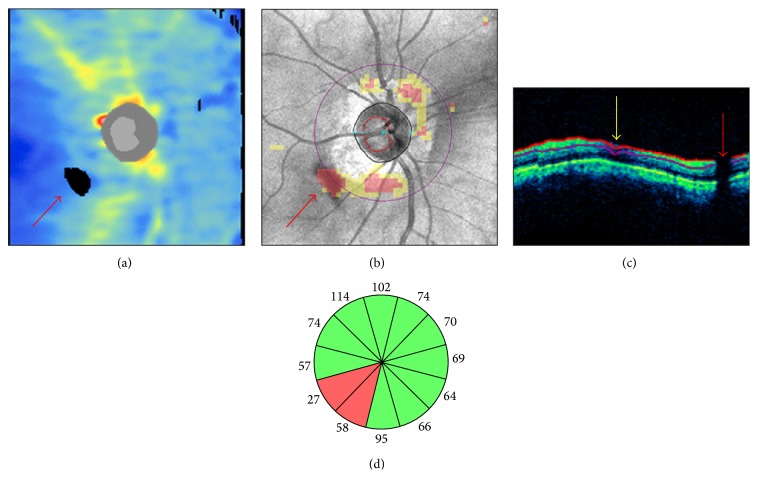
Floater overlying the scan circle. In a Cirrus HD-OCT right optic disc scan, a floater determined a black area of missing data on the retinal nerve fiber layer (RNFL) thickness map ((a) red arrow) and a cluster of red “superpixels” on the RNFL deviation map overlying the inferotemporal sectors of the scan circle (b). A characteristic vertical black shadow interrupted the retinal profile and the RNFL segmentation lines on the circular tomogram ((c) red arrow). A superonasal RNFL segmentation artifact from other cause is indicated by the yellow arrow. In (d), the inferotemporal clock hours underlying the floater presented RNFL thinning with “outside normal limits” classification results.
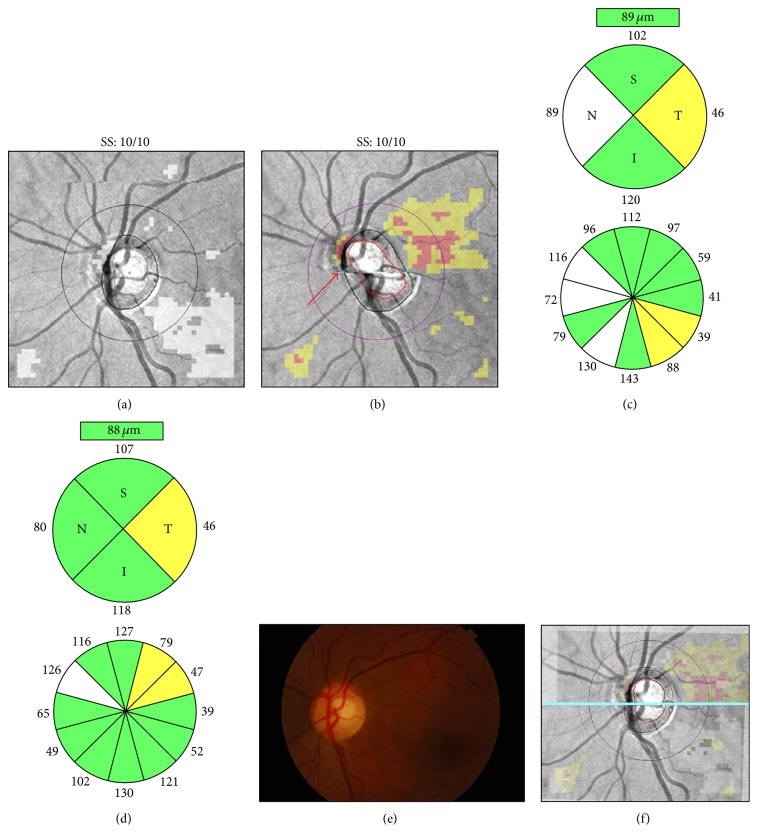
Floater overlying the optic disc region. Cirrus HD-OCT RNFL deviation maps ((a)-(b)), OCT tomograms ((c)-(d)), realigned en-face images (e), and printout results (f) from two right optic disc scans collected on the same day. In the first scan, the floater was located between the optic disc and the scan circle ((a) and (c), arrow). In the second scan, it was automatically included in the optic disc area ((b) and (d), arrow). The nasal margin of the floater was mistakenly interpreted as the optic nerve head neural canal opening ((d) asterisk), leading to increased rim and disc areas (f) and to inferonasal displacement of the optic disc center and the scan circle ((e) purple scan circle). Note the retinal nerve fiber layer thickening in the superotemporal clock hours, closer to the optic disc margin, and the corresponding thinning of the inferonasal clock hours, moved further away from the optic disc. SS: signal strength.
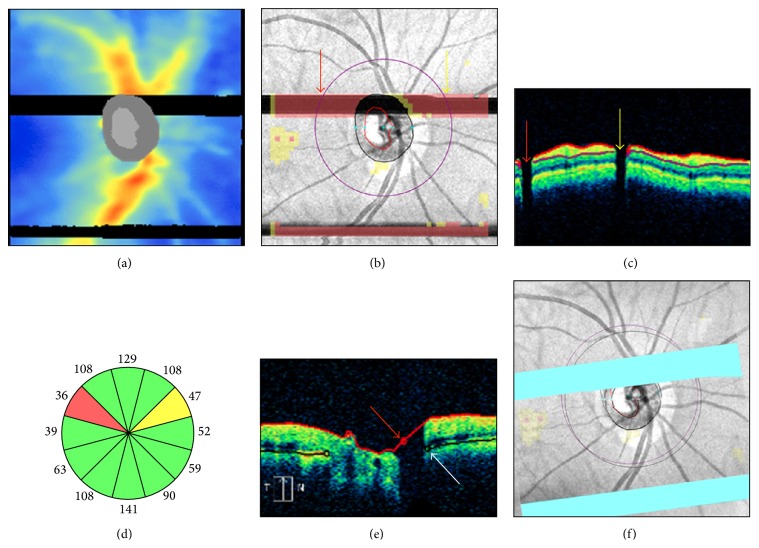
Blink artifacts. In a Cirrus-HD OCT right optic disc scan, two blinks produced two well-demarcated rectangular areas of missing data and red “superpixels” spanning the entire width of the retinal nerve fiber layer (RNFL) thickness map (a) and the RNFL deviation map (b). The upper blink affected the scan circle in two regions, as seen on the circular tomogram by two characteristic vertical black shadows interrupting the retinal profile (c). Note the corresponding RNFL thinning with abnormal classification results in clock hours 2 and 10 (d). The upper blink also affected the accuracy of the superior optic disc and cup margins ((e) arrows), leading to superotemporal scan circle displacement (f).
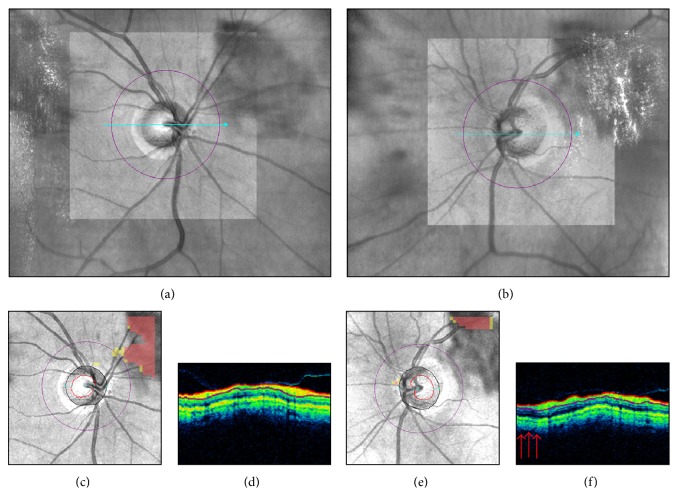
Motion artifacts and scan circle displacement. Pair of Cirrus HD-OCT left optic disc scans collected on the same day ((a)-(b)). In the scan with a motion artifact passing through the optic disc ((b) arrow), printout results suggest superotemporal retinal nerve fiber layer (RNFL) thinning not confirmed by color fundus photography ((d)-(e)). After realignment (f), this scan (purple scan circle) shows temporal displacement above the motion artifact and nasal displacement below the motion artifact. Note RNFL thickening in the sectors moved closer to the optic disc and RNFL thinning in the sectors moved away from the optic disc margin ((c)-(d)). SS: signal strength.
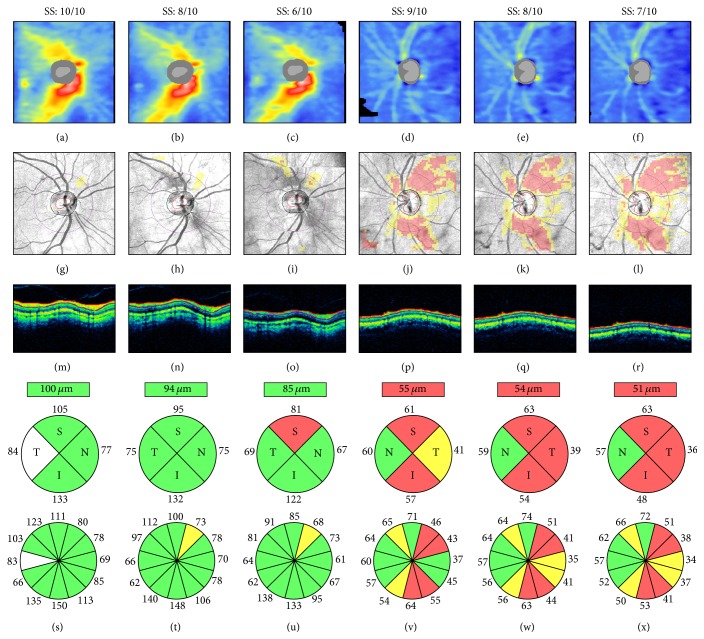
Signal strength and retinal nerve fiber layer (RNFL) thickness. Cirrus HD-OCT RNFL thickness maps ((a)–(f)), RNFL deviation maps ((g)–(l)), circular tomograms ((m)–(r)), and printout results ((s)–(x)) from two eyes. All scans had signal strength ≥6, the cut-off for acceptable image quality. Both cases show progressive signal attenuation ((m)–(o) and (p)–(r)), RNFL thinning and classification changes ((s)–(u) and (v)–(x)), and worsening of the RNFL thickness maps and RNFL deviation maps as signal strength decreases. Left: scans collected within a 2-week interval and sorted by decreasing signal strength; note the superotemporal reduction of the warmed-colored areas on the RNFL thickness maps, indicating RNFL thinning ((a)–(c)), and the corresponding clusters of “superpixels” on the RNFL deviation maps ((g)–(i)). Right: scans collected consecutively on the same day; note the progressive inferotemporal expansion of the “superpixels” cluster on the RNFL deviation maps ((j)–(l)). SS: signal strength.
Smudged OCT lens. Live Cirrus HD-OCT funduscopic images ((a)-(b)), retinal nerve fiber layer (RNFL) deviation maps ((c), (e)), and circular tomograms ((d), (f)) from the two eyes of the same individual. A smudged OCT lens artifact in the superonasal and superotemporal peripapillary regions of the right and the left eyes, respectively, approached the corresponding sectors of the scan circle. In the right eye, note on the RNFL deviation map the yellow “superpixels” indicating localized RNFL thinning (c), despite apparent signal uniformity on the circular tomogram (d). In the left eye, note the discrete superotemporal area of signal attenuation on the circular tomogram ((f) arrows), possibly affecting the corresponding RNFL thickness measures.
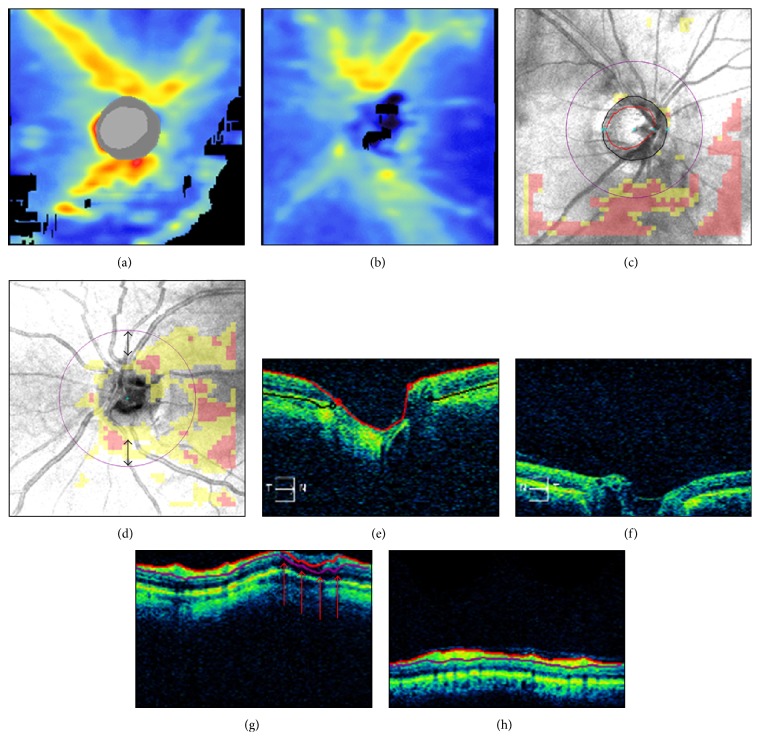
Incorrect axial alignment. Cirrus HD-OCT retinal nerve fiber layer (RNFL) thickness maps ((a)-(b)), RNFL deviation maps ((c)-(d)), horizontal ((e)-(f)), and circular ((g)-(h)) tomograms from two eyes. Left panels: partial truncation of the inner retinal layers; note the black areas of missing data on the RNFL thickness map (a), the corresponding clusters of “superpixels” on the RNFL deviation map (c), and the retinal nerve fiber layer segmentation artifact ((g) arrows). Right panels: partial truncation of the optic disc cup (f); note the algorithm failure to detect the optic disc (see (b), (d), and (f) and compare with the corresponding left panels). Thus, the scan circle was automatically placed in the center of the image, resulting in inferior scan circle displacement ((d) double arrows).
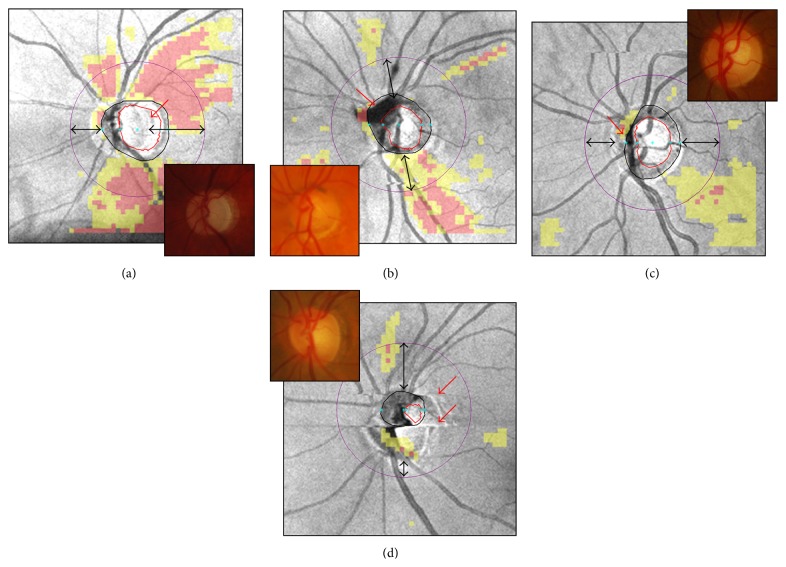
Cirrus HD-OCT inaccurate optic disc margin delineation from peripapillary atrophy, floater, blood vessels' pattern, and motion artifacts ((a)–(d), red arrows). Color optic disc photographs are shown in the insets for comparison. Along with unreliable optic disc parameters (not shown), note the scan circle displacement in all cases ((a)–(d), double arrows).
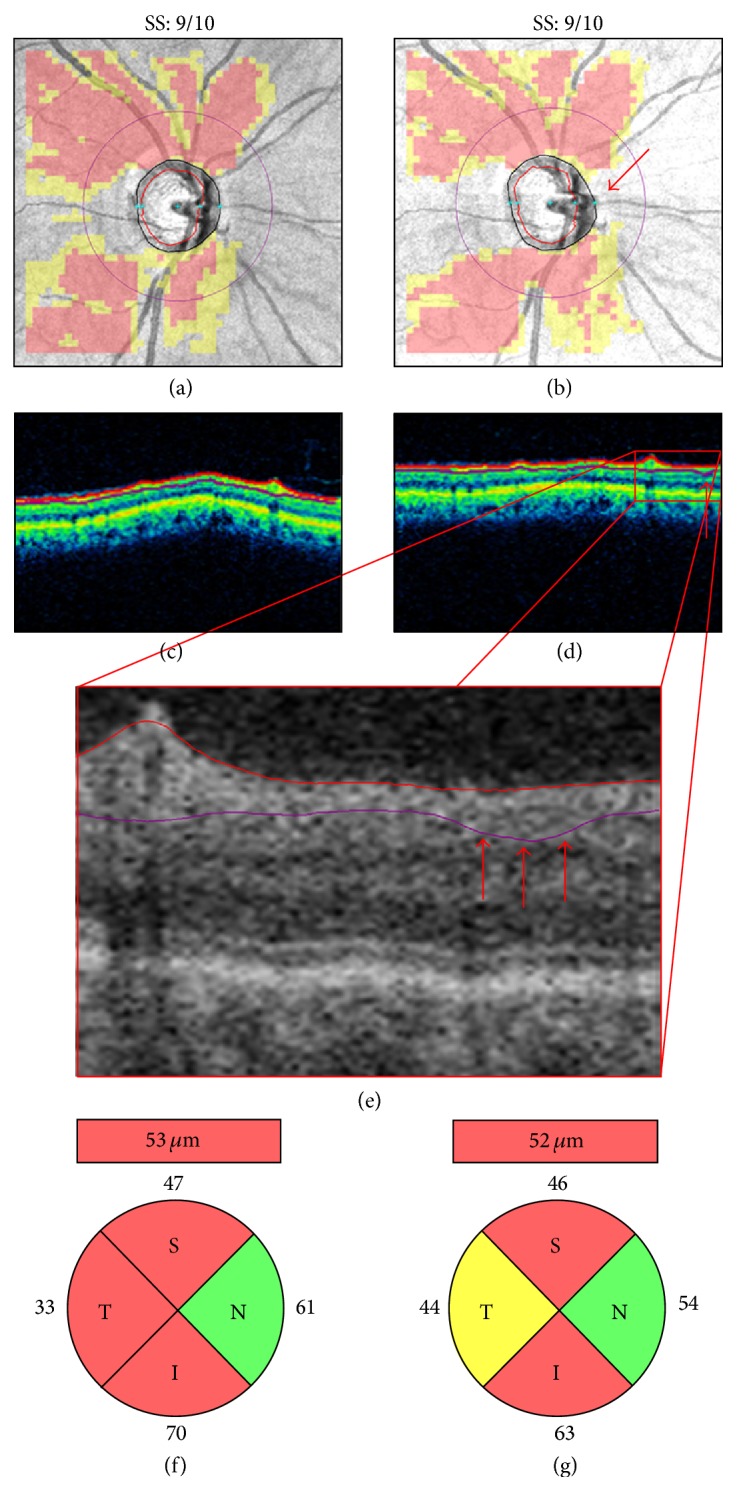
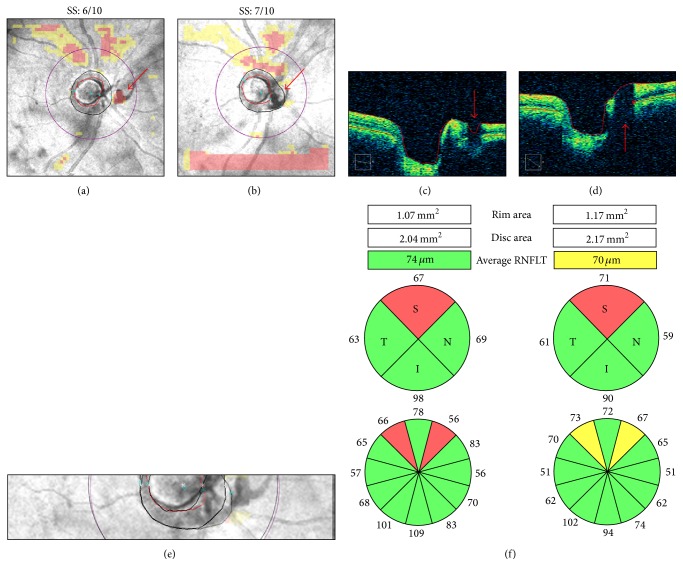
Inaccurate retinal nerve fiber layer (RNFL) segmentation. Pair of right optic disc scans collected on the same day ((a)-(b)). The second scan presents with a motion artifact intersecting the temporal and nasal quadrants of the scan circle ((b) arrow), which is likely responsible for the subtle RNFL segmentation error ((d)-(e), arrows) and the resulting temporal RNFL thickening with classification change ((f)-(g)). SS: signal strength.
Similar articles
-
Frequency, Type and Cause of Artifacts in Swept-Source and Cirrus HD Optical Coherence Tomography in Cases of Glaucoma and Suspected Glaucoma.Curr Eye Res. 2016 Jul;41(7):957-64. doi: 10.3109/02713683.2015.1075219. Epub 2015 Oct 2. Curr Eye Res. 2016. PMID: 26431251
-
Effect of motion artifacts and scan circle displacements on Cirrus HD-OCT retinal nerve fiber layer thickness measurements.Invest Ophthalmol Vis Sci. 2014 Apr 7;55(4):2251-8. doi: 10.1167/iovs.13-13276. Invest Ophthalmol Vis Sci. 2014. PMID: 24627143
-
Comparison of optic nerve head parameters using Heidelberg Retina Tomograph 3 and spectral-domain optical coherence tomography.Clin Exp Ophthalmol. 2012 Sep-Oct;40(7):721-6. doi: 10.1111/j.1442-9071.2012.02782.x. Epub 2012 May 17. Clin Exp Ophthalmol. 2012. PMID: 22394383
-
[Aiming for zero blindness].Nippon Ganka Gakkai Zasshi. 2015 Mar;119(3):168-93; discussion 194. Nippon Ganka Gakkai Zasshi. 2015. PMID: 25854109 Review. Japanese.
-
[New insights into the study of optic nerve diseases].Nippon Ganka Gakkai Zasshi. 2013 Mar;117(3):187-210; discussion 211. Nippon Ganka Gakkai Zasshi. 2013. PMID: 23631254 Review. Japanese.
Cited by
-
The use of deep learning technology for the detection of optic neuropathy.Quant Imaging Med Surg. 2022 Mar;12(3):2129-2143. doi: 10.21037/qims-21-728. Quant Imaging Med Surg. 2022. PMID: 35284277 Free PMC article. Review.
-
Exploring Publicly Accessible Optical Coherence Tomography Datasets: A Comprehensive Overview.Diagnostics (Basel). 2024 Aug 1;14(15):1668. doi: 10.3390/diagnostics14151668. Diagnostics (Basel). 2024. PMID: 39125544 Free PMC article. Review.
-
An innovative and simple method, clinically comparable to high-definition optical coherence tomography in quantifying posterior segment lesions in the retina.Indian J Ophthalmol. 2020 May;68(5):875-879. doi: 10.4103/ijo.IJO_1188_19. Indian J Ophthalmol. 2020. PMID: 32317469 Free PMC article.
-
Association of retinal neurodegeneration with the progression of cognitive decline in Parkinson's disease.NPJ Parkinsons Dis. 2024 Jan 23;10(1):26. doi: 10.1038/s41531-024-00637-x. NPJ Parkinsons Dis. 2024. PMID: 38263165 Free PMC article.
-
Clinical Utility of Optical Coherence Tomography in Glaucoma.Invest Ophthalmol Vis Sci. 2016 Jul 1;57(9):OCT556-67. doi: 10.1167/iovs.16-19933. Invest Ophthalmol Vis Sci. 2016. PMID: 27537415 Free PMC article. Review.
References
Publication types
LinkOut - more resources
Full Text Sources
Other Literature Sources
