. 2015 Sep 22;112(38):11941-6.
doi: 10.1073/pnas.1514285112. Epub 2015 Sep 8.

Gut DNA viromes of Malawian twins discordant for severe acute malnutrition

Affiliations

Gut DNA viromes of Malawian twins discordant for severe acute malnutrition

Alejandro Reyes et al. Proc Natl Acad Sci U S A. .

Abstract

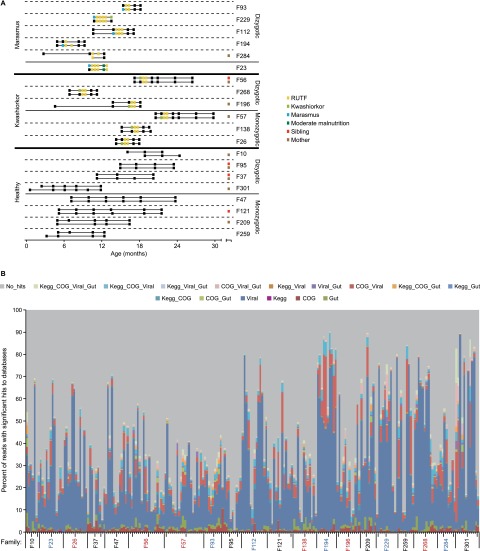
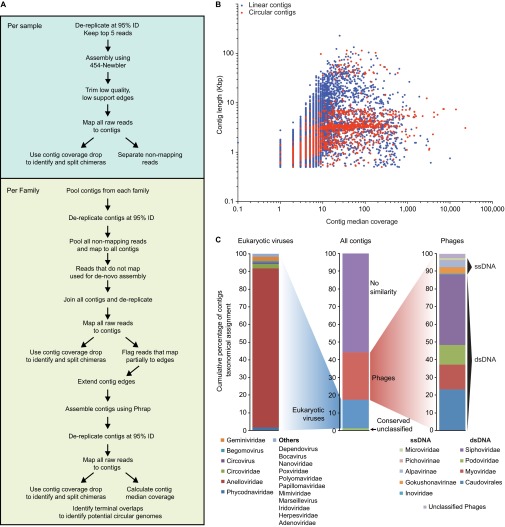
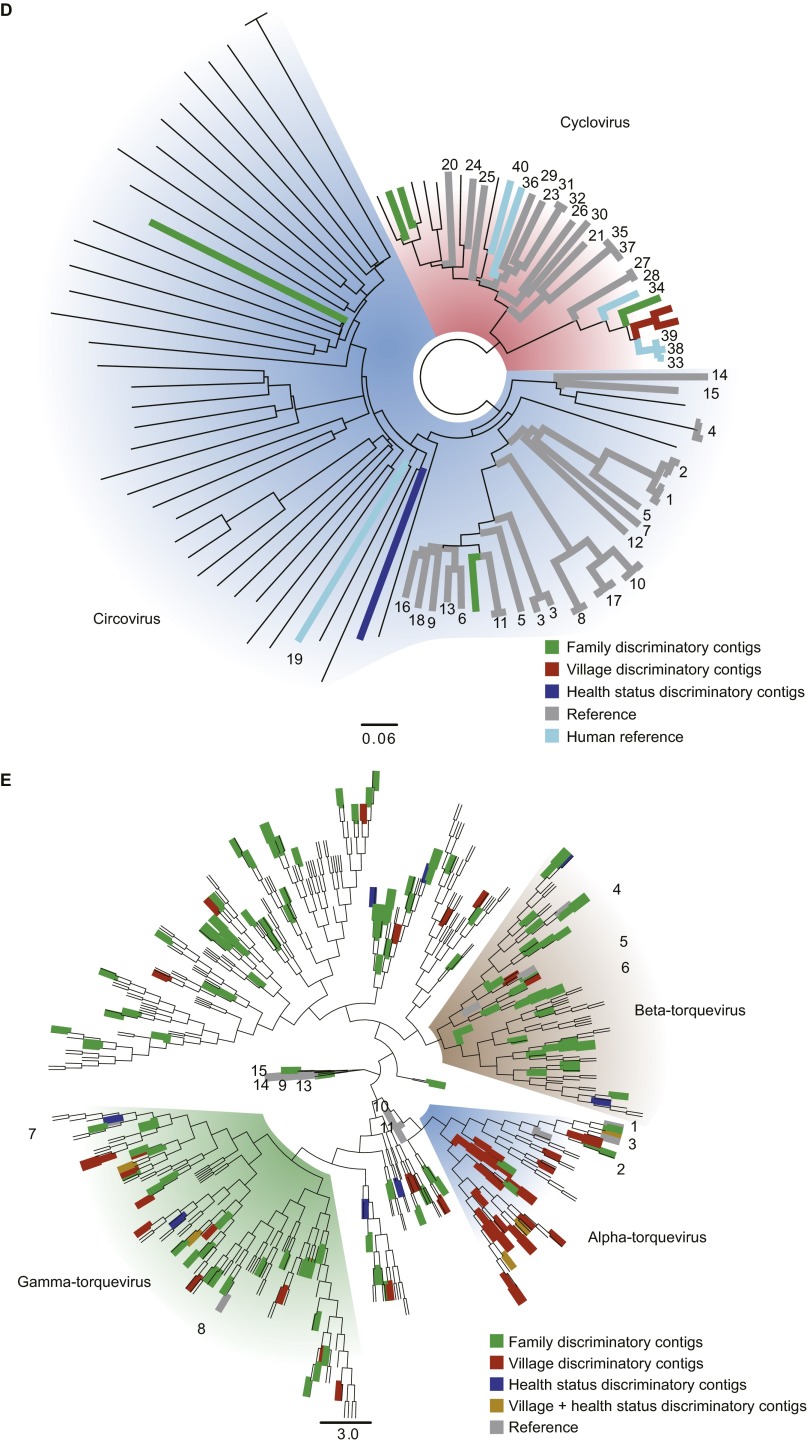
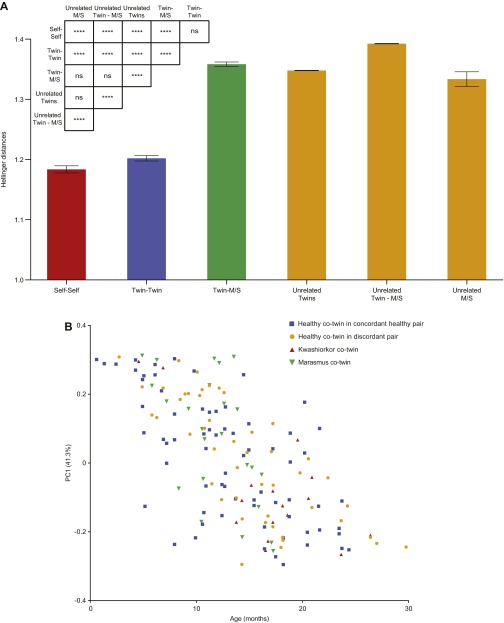
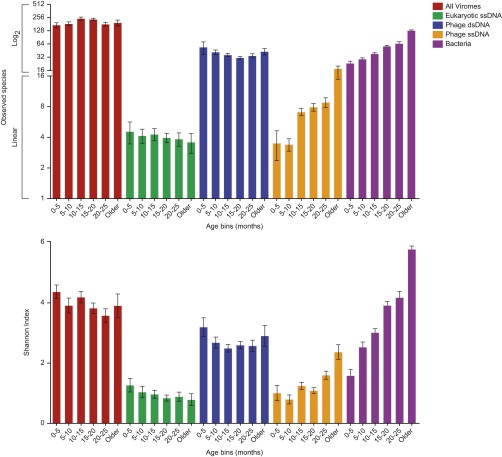
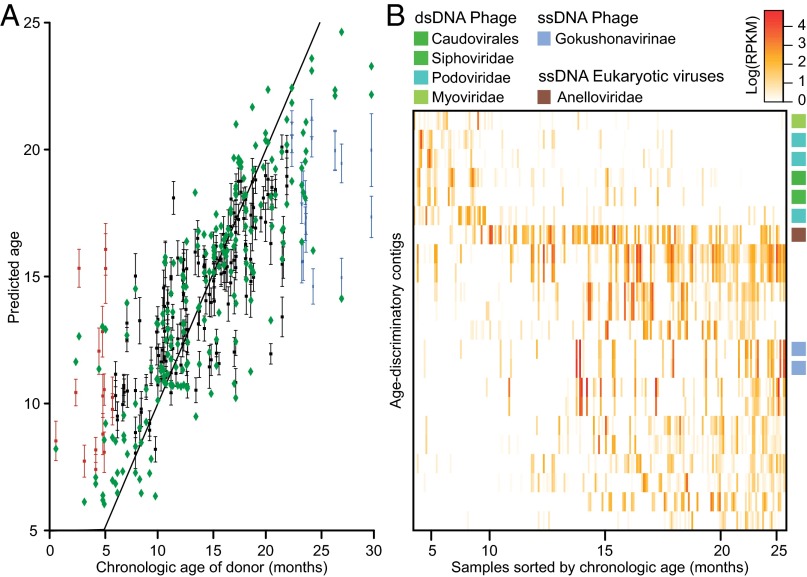
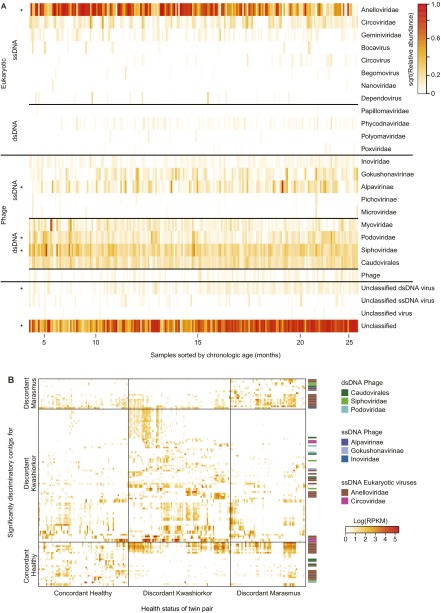
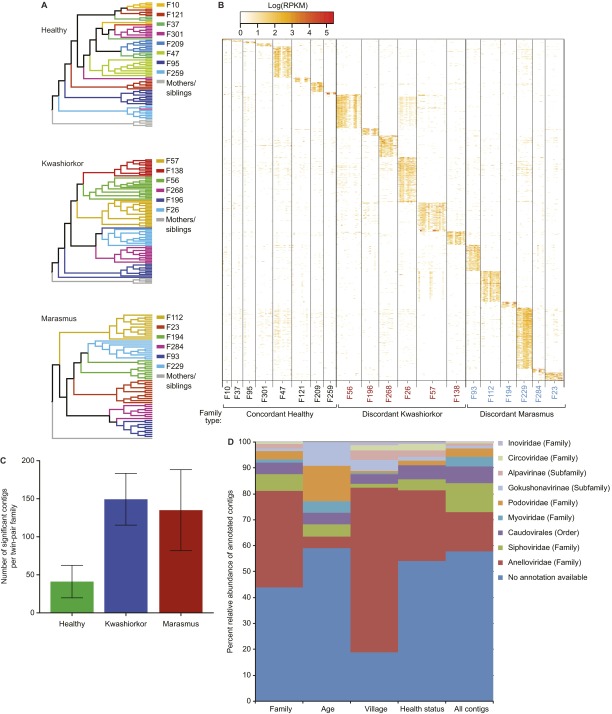
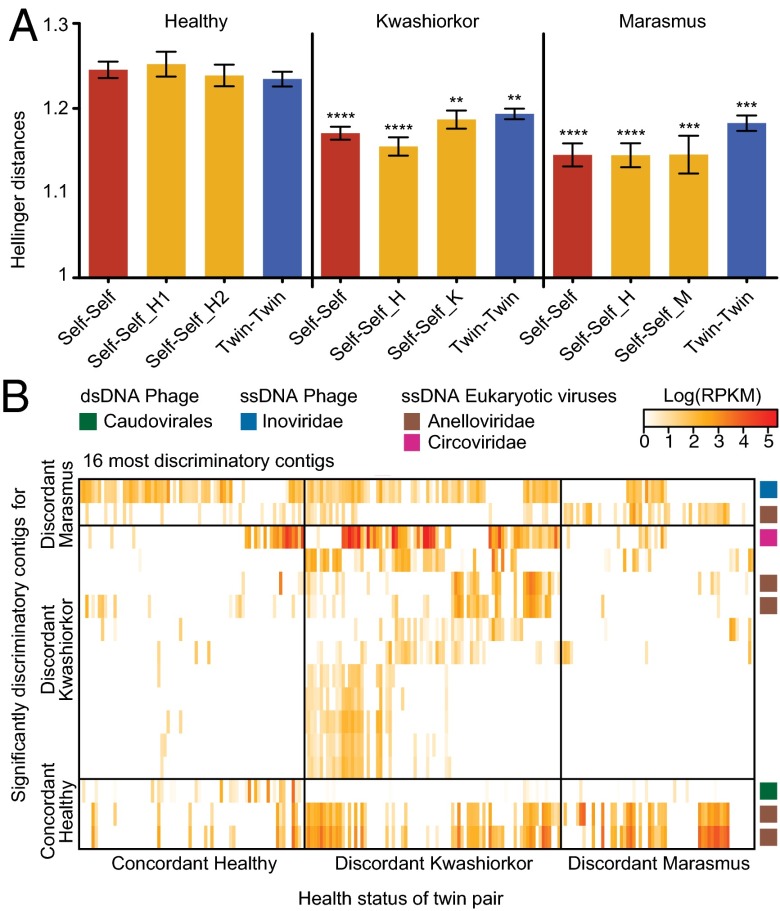
The bacterial component of the human gut microbiota undergoes a definable program of postnatal development. Evidence is accumulating that this program is disrupted in children with severe acute malnutrition (SAM) and that their persistent gut microbiota immaturity, which is not durably repaired with current ready-to-use therapeutic food (RUTF) interventions, is causally related to disease pathogenesis. To further characterize gut microbial community development in healthy versus malnourished infants/children, we performed a time-series metagenomic study of DNA isolated from virus-like particles (VLPs) recovered from fecal samples collected during the first 30 mo of postnatal life from eight pairs of mono- and dizygotic Malawian twins concordant for healthy growth and 12 twin pairs discordant for SAM. Both members of discordant pairs were sampled just before, during, and after treatment with a peanut-based RUTF. Using Random Forests and a dataset of 17,676 viral contigs assembled from shotgun sequencing reads of VLP DNAs, we identified viruses that distinguish different stages in the assembly of the gut microbiota in the concordant healthy twin pairs. This developmental program is impaired in both members of SAM discordant pairs and not repaired with RUTF. Phage plus members of the Anelloviridae and Circoviridae families of eukaryotic viruses discriminate discordant from concordant healthy pairs. These results disclose that apparently healthy cotwins in discordant pairs have viromes associated with, although not necessarily mediators, of SAM; as such, they provide a human model for delineating normal versus perturbed postnatal acquisition and retention of the gut microbiota's viral component in populations at risk for malnutrition.

Keywords: age/disease-discriminatory phage and eukaryotic viruses; assembly of the human gut DNA virome; childhood malnutrition; epidemiology; gnotobiotic mice.


Conflict of interest statement

The authors declare no conflict of interest.

Figures

Fig. S1.
Fig. S1.
Sampling scheme and evidence that fecal DNA viromes are composed of diverse sequences. (A) Twenty Malawi families were selected from a 317 twin-pair cohort (4) to study the gut (fecal) viromes of mono- and dizygotic twin pairs during the first 30 mo after birth. F# indicates family ID number (4). Samples used for isolation of VLPs and shotgun sequencing of purified VLP DNA are indicated by black or colored boxes. Black boxes indicate times of regular sampling of the fecal microbiota of twin pairs. Colored boxes differentiate samples obtained from mother (M) and older sibling (S) at enrollment, time points when one of the members of a given twin pair was first diagnosed with SAM, and when both members of a SAM discordant pair were treated with RUTF. (B) The majority of sequences in fecal DNA viromes do not have identifiable homologs in reference databases. Raw reads from each sample (columns) were mapped to the following databases: viral NR, COG, and KEGG plus a dataset of 128 human gut-associated bacterial genomes. See SI Methods for details about database composition and parameters for homology searches. Samples are grouped by human family. Family IDs are colored according to health status: red, family with a twin pair discordant for kwashiorkor; blue, family contains a twin pair discordant for marasmus; black, family with a concordant healthy twin pair. Larger tick marks bracket VLP samples analyzed from cotwin 1, cotwin 2, older sibling, and the mother in each family. Samples are sorted by age for each individual. On average, 62.4 ± 23% of reads (mean ± SD) had no significant hit to any database; 26.5 ± 21.3% and 34.6 ± 23.4% reads had significant hits to either the viral NR or viral NR plus any of the other databases, respectively.
Fig. S2.
Fig. S2.
Cross-assembly strategy for data analysis. (A) For a given sample, a first round of stringent assembly yielded contigs that were then extended in a progressive (iterative) fashion. Contigs were subsequently pooled for all VLP samples within each human family and further extended. (B) The cross-assembly strategy yielded 17,676 contigs [lower cutoff, 500 bp; largest, 228,572 bp; contig coverage, 23 ± 2 fold (mean ± SEM); 85 ± 9% (mean ± SD) of the reads used per sample; n = 231 samples plus six technical replicates from two twin pairs)]. Color code: red, contigs whose termini overlapped suggesting circular and potentially complete viral genomes; blue, linear contigs (termini are nonidentical). For contigs with a greater than 10-fold coverage, circular contigs were mainly observed in the size ranges of 3–4 Kb (typical size of ssDNA Anelloviridae genomes), ∼6–7 Kb (typical size of ssDNA Microviridae genomes), and >30 Kb (typical size of dsDNA phage genomes). (C) Taxonomic assignments were made for 44.14% of assembled contigs; 16.3% corresponded to eukaryotic viruses, mainly Anelloviridae, with the reminder consisting of phages, primarily dsDNA Caudovirales or the corresponding families Siphoviridae, Myoviridae, and Podoviridae. Contigs assigned to the Circoviridae and Anelloviridae were selected and searched for either the ORF encoding Rep (Circoviridae) or the product of ORF1 (Anelloviridae); only contigs with complete or almost complete sequences for these genes were analyzed. Reference proteins were downloaded from NCBI (Table S6) and used to identify clusters of viral families (colored shades). Neighbor Joining trees were built for Circoviridae (D) or Anelloviridae (E). Contigs that appeared as discriminatory for Family, Health Status, or Village of Origin are highlighted in different colors. Numbers correspond to locations where a given reference sequence falls in the tree. Reference sequence ID and accession numbers can be found in Table S6.
Fig. S2.
Fig. S2.
Cross-assembly strategy for data analysis. (A) For a given sample, a first round of stringent assembly yielded contigs that were then extended in a progressive (iterative) fashion. Contigs were subsequently pooled for all VLP samples within each human family and further extended. (B) The cross-assembly strategy yielded 17,676 contigs [lower cutoff, 500 bp; largest, 228,572 bp; contig coverage, 23 ± 2 fold (mean ± SEM); 85 ± 9% (mean ± SD) of the reads used per sample; n = 231 samples plus six technical replicates from two twin pairs)]. Color code: red, contigs whose termini overlapped suggesting circular and potentially complete viral genomes; blue, linear contigs (termini are nonidentical). For contigs with a greater than 10-fold coverage, circular contigs were mainly observed in the size ranges of 3–4 Kb (typical size of ssDNA Anelloviridae genomes), ∼6–7 Kb (typical size of ssDNA Microviridae genomes), and >30 Kb (typical size of dsDNA phage genomes). (C) Taxonomic assignments were made for 44.14% of assembled contigs; 16.3% corresponded to eukaryotic viruses, mainly Anelloviridae, with the reminder consisting of phages, primarily dsDNA Caudovirales or the corresponding families Siphoviridae, Myoviridae, and Podoviridae. Contigs assigned to the Circoviridae and Anelloviridae were selected and searched for either the ORF encoding Rep (Circoviridae) or the product of ORF1 (Anelloviridae); only contigs with complete or almost complete sequences for these genes were analyzed. Reference proteins were downloaded from NCBI (Table S6) and used to identify clusters of viral families (colored shades). Neighbor Joining trees were built for Circoviridae (D) or Anelloviridae (E). Contigs that appeared as discriminatory for Family, Health Status, or Village of Origin are highlighted in different colors. Numbers correspond to locations where a given reference sequence falls in the tree. Reference sequence ID and accession numbers can be found in Table S6.
Fig. S3.
Fig. S3.
Hellinger-based β-diversity measurements of viromes. (A) Raw reads from VLP DNA shotgun pyrosequencing datasets were mapped to the dataset of dereplicated contigs to create the equivalent of a viral OTU table. After normalization for sequencing effort and contig length, pairwise β-diversity measurements were performed between DNA viromes using the Hellinger distance metric. Mean values ± SEM are shown for within individual (Self-Self) or between individual distances. M/S, mother and older nontwin Sibling. Hellinger distances are significantly lower (viromes more similar) for an individual over time (self–self comparisons) or for members of a twin pair, compared with the distance to the mother or older sibling, or to any unrelated individual. Note that the Hellinger distance between viromes of sampled twin pairs (0- to 30-mo-old) from different families was significantly lower than the distances between the sampled twin pairs and their mother or older siblings (another manifestation of the importance of age). The matrix of statistical comparisons shown is based on Kruskal–Wallis one-way ANOVA with Dunn’s multiple comparisons test. ****P ≤ 0.0001. (B) Age-associated changes in the overall bacterial phylogenetic configuration of fecal microbiota during the first 2 y of postnatal life. The ordination plot is based on unweighted UniFrac distance metric and V4-16S rRNA datasets generated from each fecal microbiota sample. The most important driver of variation (PC1, explaining 41.3% of variation) is significantly correlated with age (in months), independent of the health status. Sample coloring is based on twin health status; healthy concordant twin pairs (blue), healthy cotwin of a discordant twin pair (yellow), kwashiorkor cotwin of a discordant twin pair (red), and marasmus cotwin of a discordant twin pair (green).
Fig. S4.
Fig. S4.
Viral contig-based measurements of α-diversity as a function of age. Observed species (Upper) and Shannon index (Lower) were measured based on the contig dataset. All samples from all twins were binned into the age bins shown. Note that age bins have a right closed interval (e.g., samples from a 5-mo-old individual were included in the 0- to 5-mo, but not the 5- to 10-mo, bin). Contigs were divided according to their taxonomic classification as indicated by the color key. Mean values ± SEM are shown. Bacterial diversity, as defined from an analysis of V4-16S rRNA datasets, is shown for reference.
Fig. 1.
Fig. 1.
Identification of age-discriminatory viral contigs. (A) Random Forests was used for a regression analysis to test if relative abundance of viral contigs is a good predictor of the human fecal microbiota donor’s chronologic age. The dataset of assembled contigs from all viromes sampled from twin pairs was filtered to remove family-specific contigs (SI Methods). The percentage variation explained by the regression in 100 independent runs of the Random Forests algorithm was 54.5 ± 3.1% (mean ± SD). Predicted age (mean ± SD) for each fecal virome sample is plotted against the donor’s chronologic age. Most errors in classification occur in samples obtained from donors <6 mo (red) and >23 mo of age (blue). Green diamonds indicate predicted age when using a sparse set of 22 of the most discriminatory contigs shown in B. The black diagonal represents the identity line (y = x). (B) Heat map of the abundance distribution of significantly discriminatory contigs as a function of age (months). Each row represents a significant age-associated viral contig. Boxes on the right are colored according to the contig’s taxonomic annotation.
Fig. S5.
Fig. S5.
Viral contigs discriminatory for age and those discriminatory for health status. (A) Age-discriminatory contigs. Each column is a VLP sample. Each row is the sum of the abundances of contigs that have been assigned to a given viral taxon indicated on the right. Abundances have been normalized by sample and the square root of the relative abundance is shown using the color code displayed. Viral taxonomic groups that are significantly age discriminatory according to Random Forests regression are noted with asterisks. (B) Random Forests was used to classify samples according to health status. Each row represents a discriminatory contig and each column represents a VLP sample from a cotwin sorted by health status. The most significant discriminatory contigs capable of differentiating twin pairs discordant for marasmus and/or kwashiorkor from concordant healthy pairs are shown together with their assigned taxonomy.
Fig. S6.
Fig. S6.
Contigs that discriminate different human families. (A) UPGMA clustering (Hellinger distance metric) shows a significant grouping of twin pair viromes. Clustering is more robust in families containing twin pairs discordant for kwashiorkor or marasmus compared with those containing concordant healthy pairs. (B) Contigs as signatures of twin pairs. The Random Forests classifier was used to identify contigs that are significantly associated with a given human family (without considering mothers or older siblings). After 100 independent runs, the accuracy of classification of a given VLP sample to the corresponding human family was 91.2%. The most significant variables (contigs) were selected, and a heat map of their normalized abundances per fecal VLP sample was generated. Columns represent individual samples sorted by family. Tick marks divide samples from each cotwin in a pair; for each twin, columns are sorted by chronological age. Each row represents significantly discriminatory contigs. Family IDs are colored according to health status: red, family with a twin pair discordant for kwashiorkor; blue, family with a twin pair discordant for marasmus; black, family with a concordant healthy pair. (C) Number of family discriminatory contigs as a function of twin health status. Discriminatory contigs are those selected using thresholds described in SI Methods and Fig. S7. These contigs are shown in the heat map in B. Note that a significantly greater number of contigs discriminate families containing SAM discordant twin pairs compared with families with concordant healthy twin pairs (P = 0.02; Kruskal–Wallis test). (D) Distribution of taxonomic annotations for discriminatory contigs. Relative abundance of viral contigs with taxonomic annotations and relative abundances of ≥1% in fecal VLP DNA viromes are shown. The right column (“all contigs”) indicates the distribution of annotations of contigs in the full dataset. Other columns represent the distribution of annotated contigs in the different discriminatory models. The distribution of annotations in these models is significantly different from the full dataset (P = 0.0208; two-way ANOVA), indicating that discriminatory contigs are not a random subset of the complete dataset.
Fig. S7.
Fig. S7.
Relationship between SP (specificity and precision), MI (mutual information), and Random Forests classification for selection of human family-associated viral contigs. Each graph shows the SP and MI value for each contig and a given human family (F) (see SI Methods for details). Contigs selected by VarSelRF as discriminatory for a given family in at least three of the 100 iterations, are shown in black. Red lines denote cutoffs of MI = 0.08 and SP = 2.0; contigs located within these cutoff thresholds exhibited the highest discriminatory capacity. Data points are colored based on whether the human family contained concordant healthy twin pairs (green) or pairs discordant for kwashiorkor (red) or marasmus (blue).
Fig. 2.
Fig. 2.
Virome features associated with severe acute malnutrition. (A) The fecal viromes of twin pairs where one member developed SAM have reduced β-diversity compared with concordant healthy pairs. Pairwise Hellinger distances were calculated from the log-transformed viral contig abundance matrix. Comparisons within an individual over time (Self-Self) or between cotwins from the same family (Twin-Twin) are shown. Self-Self_H, healthy cotwin; Self-Self_K, kwashiorkor cotwin; Self-Self_M, marasmus cotwin. Each of the indicated comparisons (self–self, cotwin–cotwin, etc.) was referenced to the corresponding comparisons in concordant healthy pairs. (B) Contigs significantly associated with health status. Random Forests was used to classify samples. Each row represents a discriminatory contig and each column represents a VLP sample from a cotwin sorted by health status. The 16 contigs that best discriminate twin pairs discordant for marasmus and/or kwashiorkor from concordant healthy pairs are shown together with their assigned taxonomy.
Fig. S8.
Fig. S8.
Fecal virome contigs discriminate individuals based on their residency in different southern rural Malawian villages. (A) Applying Random Forests allows accurate classification of samples based on the fecal donors’ village of origin [OOB error rate of 26.35 ± 2.4% (mean ± SD)]. The most significant discriminatory contigs are shown in the heat map. Divisions are made based on contigs capable of discriminating a particular village of origin, as determined by 100 iterations of Random Forests and feature selection using VarSelRF. Family IDs are colored according to health status: red, family contains a twin pair discordant for kwashiorkor; blue, family with a twin pair discordant for marasmus; black, family with a concordant healthy twin pair. (B) Variations in growth phenotypes as defined by anthropometry (WHZ) between the different villages. The distribution of WHZ scores is shown for all members of the larger twin cohort [n = 317 pairs; age, 0–3 y (4)] as a function of their villages of residency. Data are binned in increments of 0.5 Z scores (Upper). The table shows the results of pairwise comparisons of mean WHZ scores among members of the cohort as a function of their village of residency (P values defined by one-way ANOVA followed by post hoc Tukey’s tests) (Lower). (C) Map showing locations of villages where members of the twin cohort resided.

Similar articles

Cited by

References

    1. Black RE, et al. Maternal and Child Nutrition Study Group Maternal and child undernutrition and overweight in low-income and middle-income countries. Lancet. 2013;382(9890):427–451. - PubMed
    1. Yatsunenko T, et al. Human gut microbiome viewed across age and geography. Nature. 2012;486(7402):222–227. - PMC - PubMed
    1. Subramanian S, et al. Persistent gut microbiota immaturity in malnourished Bangladeshi children. Nature. 2014;510(7505):417–421. - PMC - PubMed
    1. Smith MI, et al. Gut microbiomes of Malawian twin pairs discordant for kwashiorkor. Science. 2013;339(6119):548–554. - PMC - PubMed
    1. Subramanian S, et al. Cultivating healthy growth and nutrition through the gut microbiota. Cell. 2015;161(1):36–48. - PMC - PubMed

Publication types

Associated data

LinkOut - more resources