. 2015 Sep 22;112(38):E5300-7.
doi: 10.1073/pnas.1504529112. Epub 2015 Sep 8.

Hyperglycemia impairs left-right axis formation and thereby disturbs heart morphogenesis in mouse embryos

Affiliations

Hyperglycemia impairs left-right axis formation and thereby disturbs heart morphogenesis in mouse embryos

Masahiro Hachisuga et al. Proc Natl Acad Sci U S A. .

Abstract

Congenital heart defects with heterotaxia are associated with pregestational diabetes mellitus. To provide insight into the mechanisms underlying such diabetes-related heart defects, we examined the effects of high-glucose concentrations on formation of the left-right axis in mouse embryos. Expression of Pitx2, which plays a key role in left-right asymmetric morphogenesis and cardiac development, was lost in the left lateral plate mesoderm of embryos of diabetic dams. Embryos exposed to high-glucose concentrations in culture also failed to express Nodal and Pitx2 in the left lateral plate mesoderm. The distribution of phosphorylated Smad2 revealed that Nodal activity in the node was attenuated, accounting for the failure of left-right axis formation. Consistent with this notion, Notch signal-dependent expression of Nodal-related genes in the node was also down-regulated in association with a reduced level of Notch signaling, suggesting that high-glucose concentrations impede Notch signaling and thereby hinder establishment of the left-right axis required for heart morphogenesis.

Keywords: congenital heart defects; diabetes; heterotaxia; left–right axis.


Conflict of interest statement

The authors declare no conflict of interest.

Figures
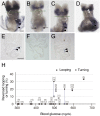
Fig. 1.
Fig. 1.
Impaired formation of the L–R axis in embryos of female mice with streptozotocin-induced diabetes. (A–D) Whole-mount in situ hybridization analysis of Pitx2 expression in E8.7 embryos of female mice without diabetes (control) (A) or with severe diabetes (BD). Anterior views are shown. All isoforms of Pitx2 mRNA are detected. Black arrowheads indicate Pitx2 expression in the left LPM, whereas arrows indicate expression in the endoderm layer of the yolk sac. The asterisk marks the left horn of the sinus venosus. White arrowheads indicate the absence of Pitx2 expression in the left outflow tract. White dashed lines show the direction of heart looping. (E–G) Transverse sections at the level of the green dashed lines in AC, respectively. Arrowheads show Pitx2 expression in the left outflow tract. (Scale bars, 100 µm.) (H) The percentage of E8.7 embryos manifesting reversed heart looping or embryonic turning among the offspring of diabetic female mice according to the maternal blood glucose concentration. Litters with different percentages of embryos showing reversed heart looping or turning are indicated by blue vertical lines. Parentheses show the number of embryos for evaluation of heart looping. When litters included embryos at stages before the turning process, the number for evaluation of turning is separately indicated in brackets. Embryos with the heart tube at the midline were excluded from the number of embryos evaluable for heart looping.
Fig. 2.
Fig. 2.
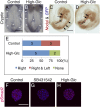
Loss of Nodal expression in the LPM of embryos exposed to high glucose in culture. (A–G) Whole-mount in situ hybridization analysis of Pitx2 (A–C), Nodal (D, E), and Lefty1 and Lefty2 (F, G) expression in embryos cultured in control (A, D, F), high–d-glucose (B, E, G), or high–l-glucose (C) medium from the head-fold stage for 16 h (A–C) or 12 h (D–G). The expression of Uncx was simultaneously examined as an indicator for somite number in DG). Anterior views (A–C) or ventral views with anterior to the top (D–F) are shown. All isoforms of Pitx2 mRNA are detected (A–C). Lefty1 and Lefty2 expression is simultaneously detected by corresponding specific probes (F, G). Black arrowheads indicate expression of Pitx2, Nodal, or Lefty2 in the left LPM. White arrowheads indicate Lefty1 expression. Asterisks mark head mesenchyme. (Scale bar, 200 µm.) (H–K) Embryos cultured for 48 h from the head-fold stage in control (H, J) or high-glucose (I, K) medium. The placenta and yolk sac of the embryos in (H) and (I) were removed to show the ventral view of the heart in (J) and (K), respectively. White dashed lines show the direction of heart looping. (Scale bars in H and J, 400 µm.) (L) Summary of the numbers of embryos examined for the direction of heart looping and embryo turning after culture for 48 h. Numbers in parentheses indicate embryos cultured in high-glucose medium for the initial 14 h and in control medium for the subsequent 34 h.
Fig. 3.
Fig. 3.
Competence of the LPM of high-glucose embryos to express Nodal. (A and B) Whole-mount in situ hybridization analysis of Cryptic expression in embryos cultured from the head-fold stage for 12 h in control (A) or high-glucose (B) medium. Ventral views with anterior to the top are shown. The node and LPM are indicated by asterisks and arrowheads, respectively. (Scale bar, 200 µm.) (C and D) Whole-mount in situ hybridization analysis of Nodal and GFP expression in embryos subjected to local transfection with corresponding expression vectors at the head-fold stage and then cultured for 12 h in control (C) or high-glucose (D) medium. Transfected cells (dark blue) visualized with the GFP probe are present within the region demarcated by the dashed line. Nodal expression (brownish red) was detected in the node and LPM (arrows). Right ventral views are shown. (Scale bar, 200 µm.) (E) Summary of Nodal expression patterns in the LPM of transfected embryos. (F–H) Confocal immunofluorescence images of pSmad2 expression (red) in ES cell colonies cultured for 12 h either in control medium without (F) or with (G) SB431542 or in high-glucose medium (H). Nuclei were stained with TO-PRO3 (blue). (Scale bar, 100 µm.)
Fig. 4.
Fig. 4.
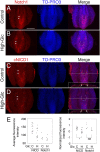
Down-regulation of Nodal activity in the node by high glucose. (A–F) Whole-mount in situ hybridization analysis of Nodal (A, B), Gdf1 (C, D, D′), and Cerl2 (E, F) expression in embryos cultured in control (A, C, E) or high-glucose (B, D, D′, F) medium from the head-fold to early somite stages. Expression of Uncx was detected simultaneously with Nodal or Cerl2 expression as an indicator for somite number. The node region is shown with anterior to the top. (Scale bar, 100 µm.) (G and H) Confocal immunohistofluorescence detection of pSmad2 (red) in embryos cultured in control (G) or high-glucose (H) medium. Nuclei were stained with TO-PRO3 (blue). Ventral views around the node region of embryos at the four-somite stage are shown with anterior to the top. (Scale bar, 200 µm.) (I and J) Enlarged views of optical cross-sections at the level of the node shown by the dashed lines in G and H, respectively. Arrows indicate crown cells. (Scale bar, 100 µm.)
Fig. 5.
Fig. 5.
Normal Notch-related gene expression around the node of high-glucose embryos. Embryos cultured in control (A, C, E, G, I, K) or high-glucose (B, D, F, H, J, L) medium from the head-fold to early somite stages were subjected to whole-mount in situ hybridization analysis of Shh (A, B), Foxa2 (C, D), Foxj1 (E, F), Dll1 (G, H), Notch1 (I, J), and Notch2 (K, L) expression. Expression of Uncx was detected simultaneously with that of Dll1 as an indicator for somite number. The node region is shown with anterior to the top. (Scale bar, 100 µm.)
Fig. S1.
Fig. S1.
Scanning electron microscopy of the node of cultured embryos at the three- to four-somite stage. Embryos were cultured from the head-fold stage in control (A, C) or high-glucose (B, D) medium. Anterior is to the top. Node cilia were observed in embryos cultured under either condition, although occasional large pit cells without a cilium (asterisks) were apparent in some of the cultured embryos (B, C). Pit cells lacking a cilium occupied the posterior area of the node in D. A hollow in the posterior-most region of the node (arrow) was also observed more frequently in high-glucose embryos (2 of 11 for control; 6 of 9 for high glucose) (D). (Scale bar, 30 µm.)
Fig. 6.
Fig. 6.
Inhibition of Notch signaling in the node by high glucose. Embryos cultured in control (A, C) or high-glucose (B, D) medium from the head-fold to early somite stages were subjected to immunohistofluorescence analysis of Notch1 (red) (A, B) or cNICD1 (red) (C, D). Nuclei were also stained with TO-PRO3 (blue). Ventral views of the node region are shown with anterior to the top. Arrowheads indicate staining in crown cells, whereas dashed lines demarcate the node. Insets in C and D show optical cross-sections at the level including the node shown by the white lines in the merged images. Arrows indicate crown cells. (Scale bar, 200 µm.) (E) Comparison of fluorescence intensity for Notch1 or cNICD1 in crown cells between control (C) and high-glucose (H) embryos. In the panel on the right, average fluorescence intensity of Notch1 or cNICD1 is normalized by that of TO-PRO3 in each embryo [log2(red/blue)]. P < 0.001; NS, not significant (P = 0.082).
Fig. S2.
Fig. S2.
Notch reporter assay for HEK293T cells cultured in high-glucose medium. (A) HEK293T cells were cultured in the presence of 50 μM DAPT for 72 h before as well as during transfection with a Notch reporter (12RE) or control plasmid, after which cell lysates were assayed for luciferase activity. (B) The transfected cells were cultured in medium containing glucose at 100, 450, or 850 mg/dL for 24 h, after which cell lysates were assayed for luciferase activity. All data are means ± SD for three independent experiments.

Comment in

References

    1. Liu S, et al. Canadian Perinatal Surveillance System (Public Health Agency of Canada) Association between maternal chronic conditions and congenital heart defects: A population-based cohort study. Circulation. 2013;128(6):583–589. - PubMed
    1. Dolk H, Loane M, Garne E. European Surveillance of Congenital Anomalies (EUROCAT) Working Group Congenital heart defects in Europe: Prevalence and perinatal mortality, 2000 to 2005. Circulation. 2011;123(8):841–849. - PubMed
    1. Jenkins KJ, et al. American Heart Association Council on Cardiovascular Disease in the Young Noninherited risk factors and congenital cardiovascular defects: Current knowledge: A scientific statement from the American Heart Association Council on Cardiovascular Disease in the Young: Endorsed by the American Academy of Pediatrics. Circulation. 2007;115(23):2995–3014. - PubMed
    1. Correa A, et al. Diabetes mellitus and birth defects. Am J Obstet Gynecol. 2008;199(3):237.e1–237.e9. - PMC - PubMed
    1. Cockroft DL, Coppola PT. Teratogenic effects of excess glucose on head-fold rat embryos in culture. Teratology. 1977;16(2):141–146. - PubMed

Publication types

MeSH terms