. 2015 Sep 22;112(38):E5290-9.
doi: 10.1073/pnas.1514418112. Epub 2015 Sep 8.

Unique potential of 4-1BB agonist antibody to promote durable regression of HPV+ tumors when combined with an E6/E7 peptide vaccine

Affiliations

Unique potential of 4-1BB agonist antibody to promote durable regression of HPV+ tumors when combined with an E6/E7 peptide vaccine

Todd Bartkowiak et al. Proc Natl Acad Sci U S A. .

Abstract

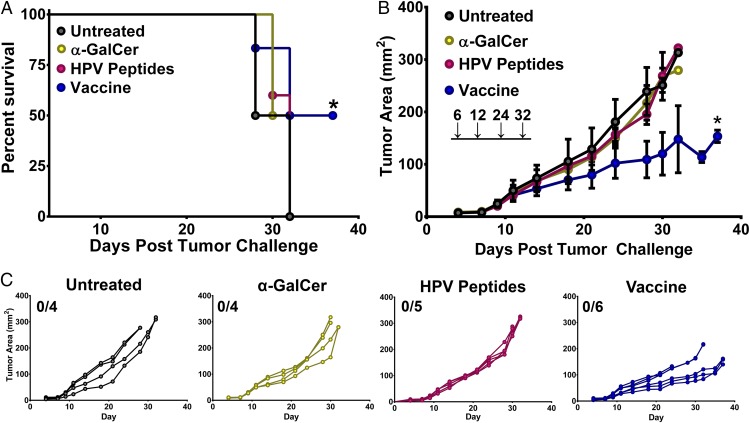
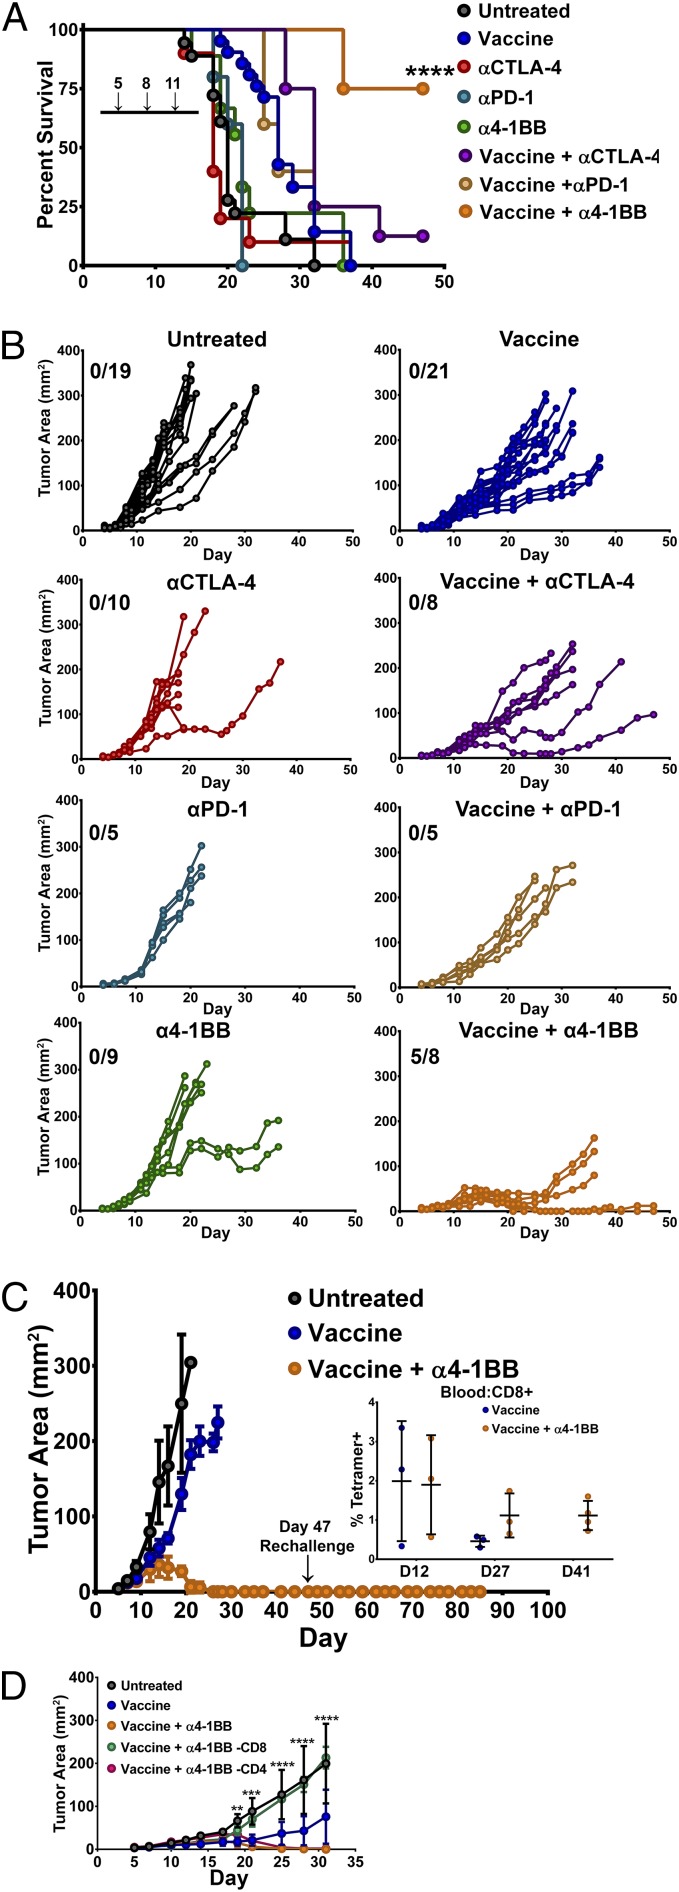
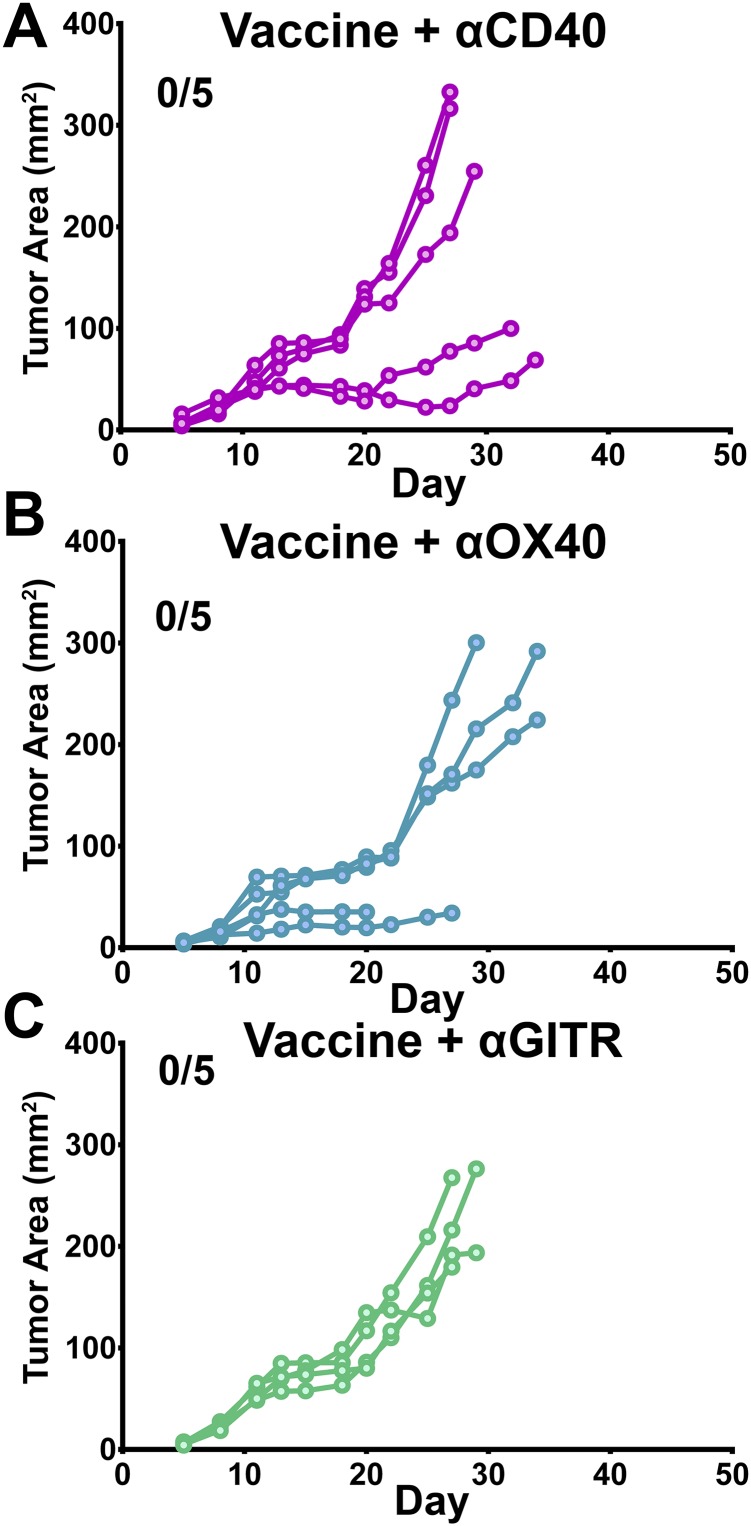
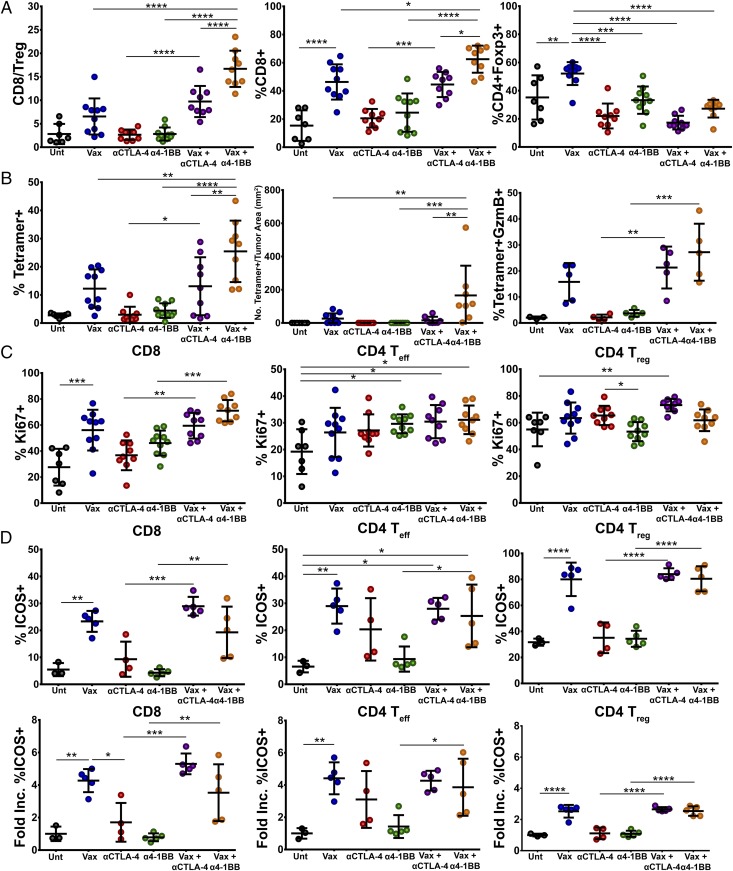
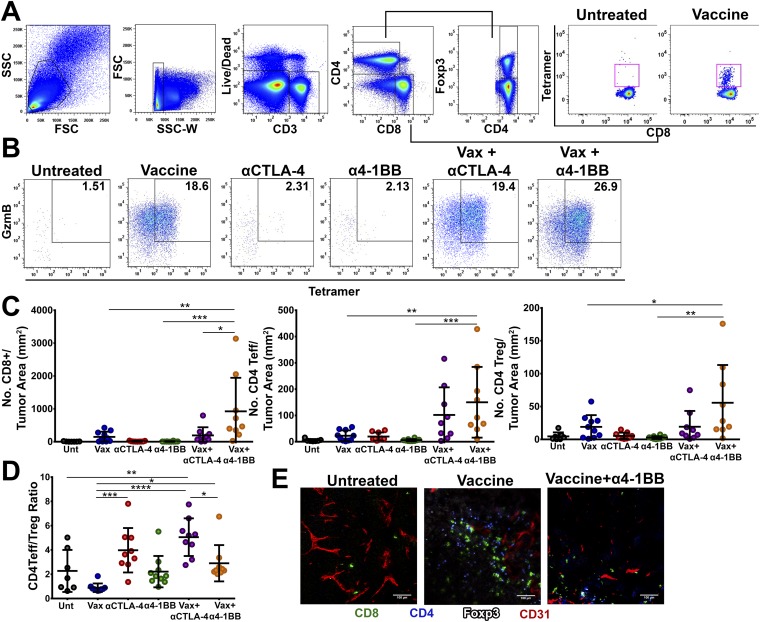
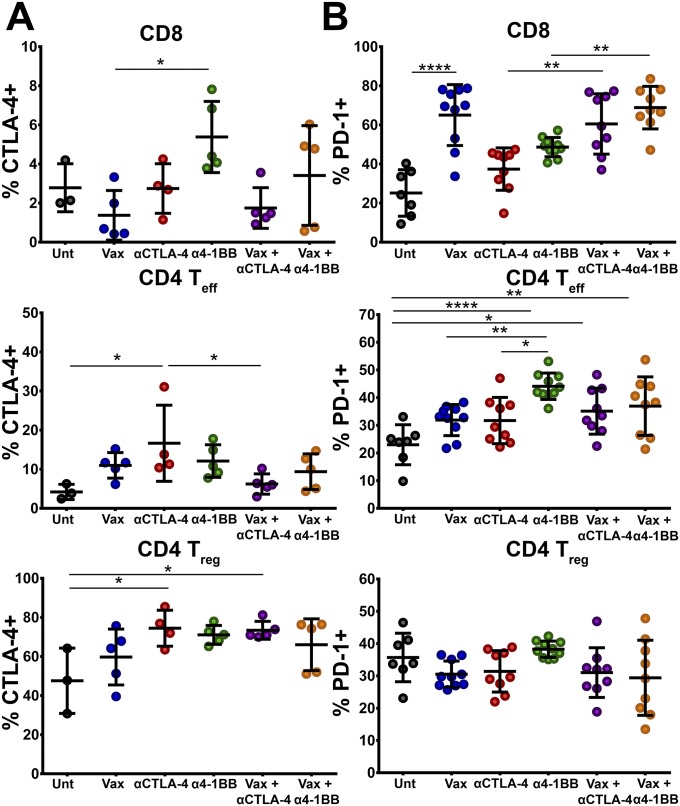
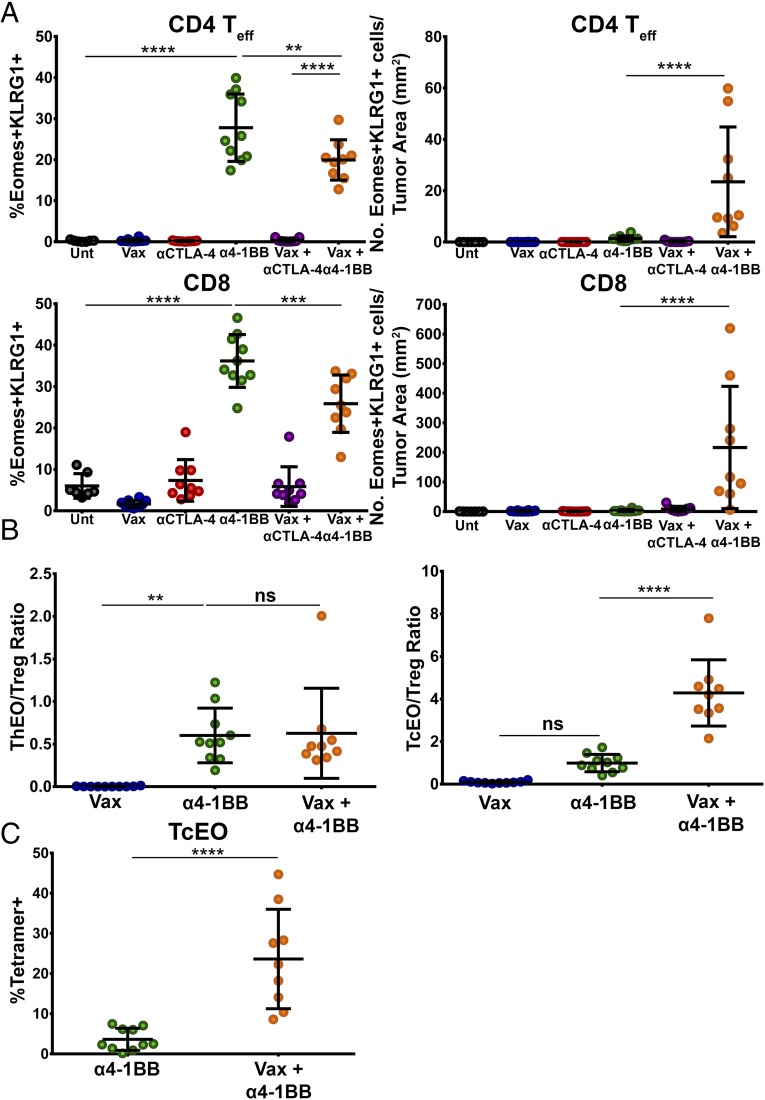
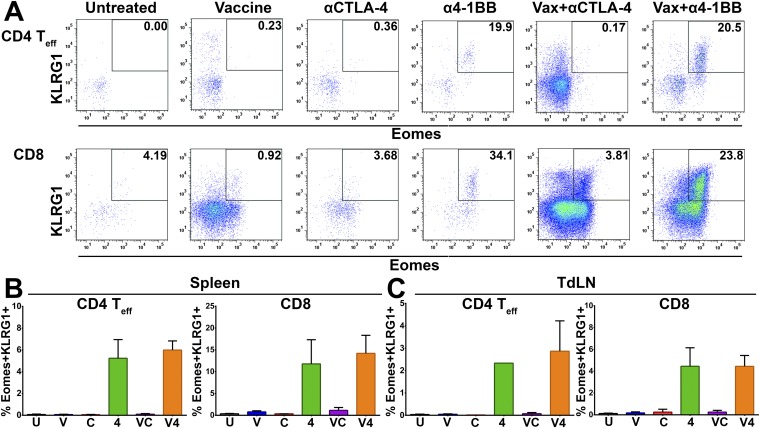
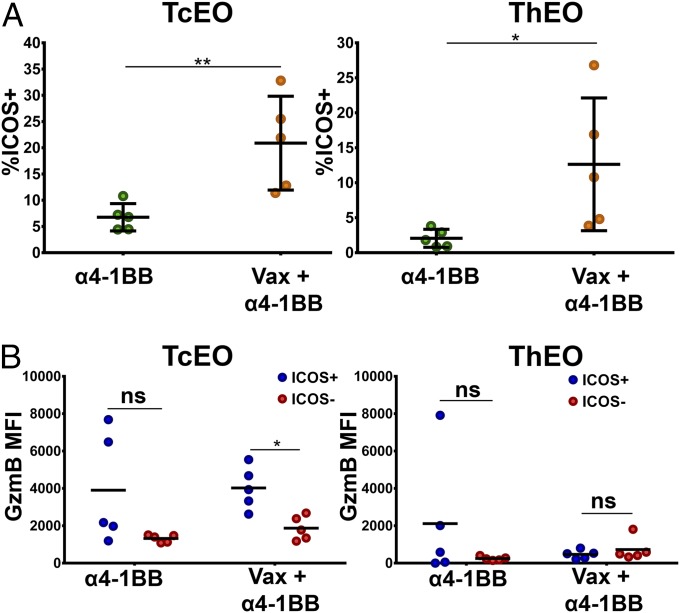
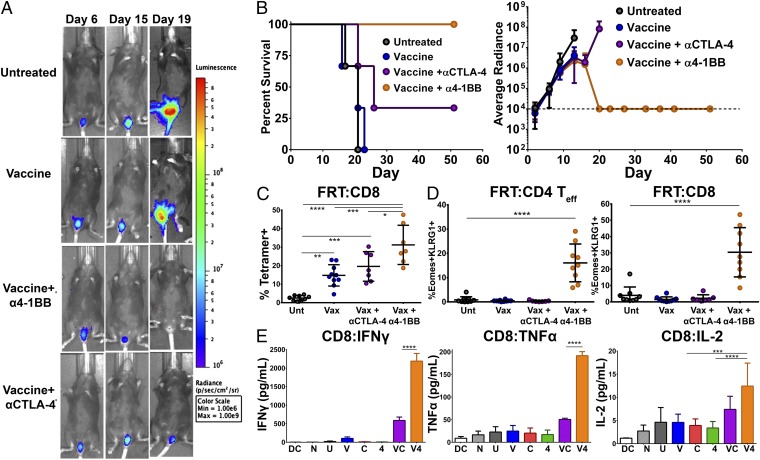
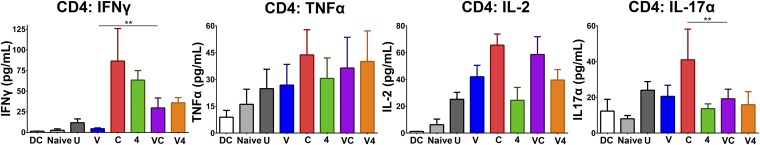
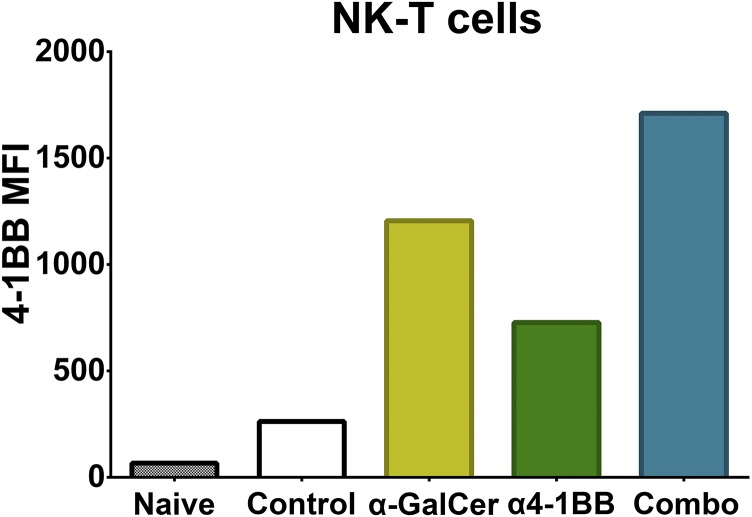
Antibody modulation of T-cell coinhibitory (e.g., CTLA-4) or costimulatory (e.g., 4-1BB) receptors promotes clinical responses to a variety of cancers. Therapeutic cancer vaccination, in contrast, has produced limited clinical benefit and no curative therapies. The E6 and E7 oncoproteins of human papilloma virus (HPV) drive the majority of genital cancers, and many oropharyngeal tumors. We discovered 15-19 amino acid peptides from HPV-16 E6/E7 for which induction of T-cell immunity correlates with disease-free survival in patients treated for high-grade cervical neoplasia. We report here that intranasal vaccination with these peptides and the adjuvant alpha-galactosylceramide elicits systemic and mucosal T-cell responses leading to reduced HPV(+) TC-1 tumor growth and prolonged survival in mice. We hypothesized that the inability of these T cells to fully reject established tumors resulted from suppression in the tumor microenvironment which could be ameliorated through checkpoint modulation. Combining this E6/E7 peptide vaccine with checkpoint blockade produced only modest benefit; however, coadministration with a 4-1BB agonist antibody promoted durable regression of established genital TC-1 tumors. Relative to other therapies tested, this combination of vaccine and α4-1BB promoted the highest CD8(+) versus regulatory FoxP3(+) T-cell ratios, elicited 2- to 5-fold higher infiltration by E7-specific CTL, and evoked higher densities of highly cytotoxic TcEO (T cytotoxic Eomesodermin) CD8 (>70-fold) and ThEO (T helper Eomesodermin) CD4 (>17-fold) T cells. These findings have immediate clinical relevance both in terms of the direct clinical utility of the vaccine studied and in illustrating the potential of 4-1BB antibody to convert therapeutic E6/E7 vaccines already in clinical trials into curative therapies.

Keywords: 4-1BB; HPV; cancer vaccine; checkpoint blockade; immunotherapy.


Conflict of interest statement

The authors declare no conflict of interest.

Figures

Fig. 1.
Fig. 1.
Intranasal vaccination with HPV E6/E7 peptides in combination with α-galactosylceramide (αGalCer) slows the growth of preimplanted HPV+ TC-1 tumors. Mice were challenged s.c. with 2 × 10⁵ TC-1 tumor cells and immunized via the intranasal route with either HPV peptides and αGalCer (vaccine), HPV peptides alone, αGalCer alone, or PBS on days 6, 12, 24, and 32 postimplantation (vertical arrows). The survival (A) and tumor growth (B) of the mice were monitored over time. (A) Survival curves of tumor-bearing mice given different therapeutic treatments. Significance in survival proportions was measured using the log-rank test. P < 0.05. (B) The average tumor size is shown as mean area ± SD for each group of mice. Statistical analyses between different groups were performed using Student’s t test between different treatments and the different levels of significance are indicated by * (P ≤ 0.05). (C) Tumor progression of s.c.-implanted TC-1 tumors in mice given the indicated treatment. Each line indicates an individual mouse. Experiments were performed on four to six mice per group.
Fig. 2.
Fig. 2.
Combination therapy with an HPV E6/E7 peptide vaccine and T-cell costimulatory modulating antibodies. Mice were challenged s.c. with 2 × 10⁵ TC-1 tumor cells before being immunized intranasally twice (days 5 and 11 posttumor challenge) with the HPV peptide vaccine (HPV peptides and αGalCer) and αCTLA-4, αPD-1, or α4-1BB (days 5, 8, and 11 posttumor challenge). Control animals received PBS, vaccine, or monotherapy alone. Tumor growth (measured in square millimeters) and animal survival were monitored over time. (A) Survival curves of tumor-bearing mice receiving the indicated treatment. (B) Tumor progression in mice receiving various monotherapies or in combination with the HPV peptide vaccine. (C) Three weeks post–complete-tumor regression, mice (n = 3) treated with vaccine in combination with α4-1BB monotherapy (from B) were rechallenged with 2 × 10⁵ TC-1 cells. Tumor growth is presented as an average area ± SD for untreated (n = 5), vaccine-treated (n = 5), and vaccine + α4-1BB monotherapy-treated (n = 3) animals. Mice were monitored for 60 d postrechallenge for evidence of tumor growth. The persistence of E7 antigen-specific CD8+ T lymphocytes was determined in the peripheral blood mononuclear cells of mice receiving the vaccine either alone (the three longest-surviving vaccine-alone animals were used) or with α4-1BB monotherapy by staining with fluorescently labeled E749-57/Kb tetramer and antibodies to CD44 and CD8, and expressed as a percentage of CD8+ T lymphocytes from different time points (Inset). (D) In a different set of experiments, mice treated i.n. with peptide vaccine with i.p. α4-1BB were depleted of CD8 or CD4 T cells 1 d pre- and 1 d posttumor challenge (2.5 × 10⁵ TC-1 s.c.). Depletion was maintained every 3 d until mice were killed. Tumor growth was measured in each group and the average tumor area for each group was plotted over time (n = 5 mice per group). Data in B were pooled from two independent experiments (n = 5–10 mice per group). Significance in survival proportions in A was determined using a Mantel–Cox test (P < 0.001). Each line in B represents an individual mouse. The average tumor growth in B is shown as mean area ± SD. Circles represent mean ± SD. Statistical significance in D was calculated using a Student’s T test to compare the vaccine + α4-1BB group to the CD8-depleted group. ns, not significant; *P < 0.05, **P < 0.01, ***P < 0.001, ****P < 0.0001.
Fig. S1.
Fig. S1.
Tumor relapse in vaccine and α4-1BB–treated mice is not due to E6/E7 antigen loss. Tumors were isolated from mice relapsing after initial response to combo therapy (progressor) or in the process of marked regression, suggesting a likely complete response (regressor). Tumor RNA was purified using Trireagent (Sigma), reverse transcribed into DNA using the SuperScript II reverse transcriptase kit (Life Technologies), and then PCR amplified for the full-length E6 and E7 reading frames using HotStar Taq Mastermix (Qiagen). Separate gels were run for E6 and E7 and amplified DNA was visualized using ethidium bromide staining.
Fig. S2.
Fig. S2.
HPV E6/E7 peptide vaccine in combination with TNF-receptor agonist antibody therapy. Mice were s.c. challenged with 2 × 10⁵ TC-1 tumor cells and immunized intranasally twice (days 5 and 11 posttumor challenge) with the HPV peptide vaccine (HPV peptides and αGalCer) in addition to (A) αCD-40 (FGK4.5), (B) αOX-40 (OX-86), or (C) αGITR (DTA-1) agonist antibodies (days 5, 8, and 11 posttumor challenge). Tumor growth (expressed in square millimeters) was monitored over time. Each line represents an individual mouse (n = 5 mice per group). Two tumor-bearing animals in B were killed before day 30 for nontumor, nontreatment-related causes at the request of the facility veterinarians.
Fig. 3.
Fig. 3.
Immune correlates of protection. Antitumor T-cell responses in the tumor microenvironment of mice treated with vaccine, αCTLA-4, α4-1BB monotherapy, or in combination were characterized by flow cytometry. (A) The CD8/Treg ratio was calculated by dividing the total number of CD8+ CTLs infiltrating the tumor by the total number of CD4+Foxp3+ T-cell infiltrate. Percent of CD8+ T-cell infiltrate was calculated as a percent of total CD3+ T-cell infiltrate. The percent of Treg infiltrate was calculated as a percent of total CD4+ T cells in the tumor fraction. (B) Infiltration (Left and Center) and cytotoxic effector function (Right) of E7-specific CD8 T cells in the tumor infiltrate was also determined by staining lymphocytes with fluorescently labeled E749-57/Kb tetramer and antibodies to CD8 and granzyme B. Data are expressed as a percentage of CD8+ T cells (Left), a population of CD8 T cells in the tumor (Middle), or as a percentage of antigen-specific CD8+ T cells expressing granzyme B (Right). (C) T-cell proliferation (as indicated by percent of cells expressing Ki67) and (D) ICOS expression was also determined for CD8, CD4, Teff, and CD4 Treg cells in the tumor microenvironment and is represented as percent of T cells expressing ICOS and fold increase in %ICOS-positive cells over untreated mice. Circles represent individual mice (3–10 mice per group from two experiments). Bars represent mean ± SD. Statistical significance was calculated using a one-way ANOVA. ns, not significant; *P < 0.05, **P < 0.01, ***P < 0.001, ****P < 0.0001.
Fig. S3.
Fig. S3.
Gating strategy and representative FACS analysis of tumor infiltrating T-cell populations. (A) Representative gating strategy to analyze CD8+, CD4 Teff, and CD4 Treg populations in the TILs as well as tetramer-specific CD8 responses. (B) Representative gating strategy for analysis of cytotoxic antigen-specific CD8 T-cell responses in TILs. (C) Quantitation of CD8+ T-cell density (Left) CD4 Teff density (Middle) and Treg density (Right) in the tumor microenvironment. (D) Quantitation of CD4 Teff/Treg ratio in the tumor microenvironment calculated by dividing the total number of CD4+Foxp3 T cells by the total number of CD4+Foxp3+ T cells recovered from the TIL fraction. Experiments were performed in duplicate with at least three mice per group. Bars in C and D represent mean ± SD. Statistical significance was calculated using a one-way ANOVA. ns, not significant; *P < 0.05, **P < 0.01, ***P < 0.001, ****P < 0.0001. (E) TC-1 tumors were treated as indicated, excised at day 16, frozen in OCT, sectioned, and stained for CD8 (Alexa 488), CD4 (V450), FoxP3 (eFluor 570), and CD31 (Alexa 647). Images were acquired using a TCS SP8 laser scanning confocal microscope (Leica) equipped with lasers for fluorescence excitation at 405, 442, 458, 488, 514, 561, and 633 nm. Images were analyzed using ImageJ image analysis software.
Fig. S4.
Fig. S4.
Phenotypic analysis of tumor infiltrating lymphocytes. The percent of CTLA-4–expressing (A) and PD-1–expressing (B) CD8 T cells (Top), CD4 T effector cells (Middle), and regulatory T cells (Bottom) within the tumor microenvironment. Experiments were performed in duplicate with at least three mice per group. Bars represent mean ± SD. Statistical significance was calculated using a one-way ANOVA. ns, not significant; *P < 0.05, **P < 0.01, ***P < 0.001, ****P < 0.0001.
Fig. 4.
Fig. 4.
Anti–4-1BB agonist antibody therapy induces potent ThEO/TcEO T-cell responses against HPV+ tumors. Induction of a ThEO/TcEO T-cell response in the tumor microenvironment was determined by staining isolated lymphocytes with fluorescently labeled antibodies toward eomesodermin and KLRG1. (A) Percent of total CD4 (Left) and CD8 (Right) effector T-cell populations in TIL composed of Eomes+KLRG+ ThEO or TcEO T cells. Density of ThEO (Left) and TcEO (Right) T cells expressed as number of cells per square millimeter of tumor. (B) The ThEO/Treg ratio and TcEO/Treg ratio was calculated by dividing the total number of effector CD4+Eomes+KLRG1+ or CD8+Eomes+KLRG1+ cells, respectively, by the total number of CD4+Foxp3+ T cells collected from the TIL fraction. (C) The antigen-specific CD8+ TcEO cells were analyzed by calculating the fraction of CD8+Eomes+KLRG1+ T cells bound to fluorescently labeled E749-57/Kb tetramer. Experiments were performed in duplicate with at least three mice per group. Bars represent mean ± SD. Statistical significance was calculated using a one-way ANOVA (A) or Mann–Whitney U test (B and C). ns, not significant; *P < 0.05, **P < 0.01, ***P < 0.001, ****P < 0.0001.
Fig. S5.
Fig. S5.
Gating strategy and analysis of ThEO/TcEO cells in the spleens and draining lymph nodes of tumor-bearing mice. (A) Representative FACS plots gating on Eomes+KLRG1+ CD4 T cells (Top) or CD8 T cells (Bottom) of mice receiving various immunomodulatory antibody therapies alone or in combination with the HPV peptide vaccine. Quantitation of Eomes+KLRG1+ ThEO (Left) and TcEO (Right) cells in the spleen (B) and draining lymph nodes (C) of tumor-bearing mice. Experiments were performed in duplicate by pooling spleens or lymph nodes from at least three mice per group. Bars represent mean ± SD. Statistical significance was calculated using a one-way ANOVA.
Fig. 5.
Fig. 5.
Intranasal vaccination with HPV E6/E7 induces infiltration of ICOS+ ThEO and TcEO cells into the tumor microenvironment. (A) The percent of ICOS expression on Eomes+KLRG1+ TcEO (Left) and ThEO (Right) infiltrating s.c. implanted TC-1 tumors. (B) Cytotoxic potential of ICOS-expressing cells was measured by comparing the mean fluorescence intensity (MFI) of granzyme B in ICOS+ versus ICOS TcEO or ThEO cells isolated from the TIL fraction. Experiments were performed on at least three mice per group. Bars represent mean ± SD. Statistical significance was calculated using a Student’s T test. ns, not significant; *P < 0.05, **P < 0.01, ***P < 0.001, ****P < 0.0001.
Fig. 6.
Fig. 6.
Vaccination with HPV E6/E7 peptides in combination with α4-1BB leads to regression of intravaginally implanted tumors. Mice were challenged intravaginally with 2 × 10⁴ TC-1 tumor cells expressing firefly luciferase and then immunized intranasally twice (days 5 and 11) with HPV peptides and αGalCer either alone or in combination with αCTLA-4 or α4-1BB therapy (days 5, 8, and 11). Control animals received either PBS or monotherapy alone. Tumor growth and survival of the mice was monitored over time. (A) Representative images of luciferase+ tumor progression over time in mice assigned to different treatment groups. (B) Survival curve (Left) and average tumor growth (Right) as measured by average radiance of luciferase activity of mice treated with peptide vaccine alone or in combination with immunotherapy. Tumor measurements ceased upon the first tumor-related mortality in each group. Survival and tumor growth are from a representative experiment of two independent experiments with three to five mice per group. (C) In a separate experiment, the percent of E7 antigen-specific CD8 T cells infiltrating into vaginal tumors and the associated genital tract was analyzed by isolating TILs and staining with fluorescently labeled E749-57/Kb tetramer and antibodies to CD8. (D) The percent of ThEO/TcEO cells capable of infiltrating intravaginally implanted TC-1 tumors was measured by gating on Eomes+KLRG1+ CD4 Teff or CD8 T cells, respectively. (E) CD8 T cells from the draining lymph node were restimulated with E6/E7 peptide-pulsed DCs and their cytokine production measured by cytometric bead array (BD Biosciences). Experiments were performed in duplicate on at least three mice per group except cytokine production, which was performed with quintuplicate wells derived from five pooled LNs per group. Bars represent mean ± SD. Statistical significance was calculated using a one-way ANOVA. ns, not significant; *P < 0.05, **P < 0.01, ***P < 0.001, ****P < 0.0001.
Fig. S6.
Fig. S6.
Cytokine production from restimulated CD4 T cells isolated from female reproductive tract implanted TC-1 tumor-draining lymph nodes. CD4 T cells from the draining lymph node were restimulated with E6/E7 peptide-pulsed DCs and their cytokine production was measured by cytometric bead array (BD Biosciences). Experiments were performed with quintuplicate wells derived from five pooled LNs per group. Bars represent mean ± SD. Statistical significance was calculated using a one-way ANOVA. ns, not significant; *P < 0.05, **P < 0.01, ***P < 0.001, ****P < 0.0001.
Fig. S7.
Fig. S7.
4-1BB expression on NK T cells is induced by αGalCer. Naïve splenocytes were cultured in complete RPMI with 2 ng/mL αGalCer for 48 h with or without 40 μg/mL anti–4-1BB (clone LOB12.3). Cells were stained for 4-1BB expression using 4-1BB-PE (clone 17B5) and for NK T cells and analyzed by flow cytometry. The mean fluorescence intensity (MFI) of 4-1BB expression in each NK T-cell population is shown.

Similar articles

Cited by

References

    1. Parkin DM, Pisani P, Ferlay J. Estimates of the worldwide incidence of 25 major cancers in 1990. Int J Cancer. 1999;80(6):827–841. - PubMed
    1. Moody CA, Laimins LA. Human papillomavirus oncoproteins: Pathways to transformation. Nat Rev Cancer. 2010;10(8):550–560. - PubMed
    1. Chaturvedi AK. Beyond cervical cancer: Burden of other HPV-related cancers among men and women. J Adolesc Health. 2010;46(4) Suppl:S20–S26. - PubMed
    1. Brinkman JA, et al. Therapeutic vaccination for HPV induced cervical cancers. Dis Markers. 2007;23(4):337–352. - PMC - PubMed
    1. Gajewski TF, Louahed J, Brichard VG. Gene signature in melanoma associated with clinical activity: A potential clue to unlock cancer immunotherapy. Cancer J. 2010;16(4):399–403. - PubMed

Publication types

MeSH terms