Dissecting repulsion linkage in the dwarfing gene Dw3 region for sorghum plant height provides insights into heterosis
- PMID: 26351684
- PMCID: PMC4586871
- DOI: 10.1073/pnas.1509229112
Dissecting repulsion linkage in the dwarfing gene Dw3 region for sorghum plant height provides insights into heterosis
Abstract
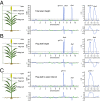
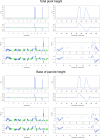
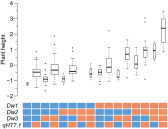
Heterosis is a main contributor to yield increase in many crop species. Different mechanisms have been proposed for heterosis: dominance, overdominance, epistasis, epigenetics, and protein metabolite changes. However, only limited examples of molecular dissection and validation of these mechanisms are available. Here, we present an example of discovery and validation of heterosis generated by a combination of repulsion linkage and dominance. Using a recombinant inbred line population, a separate quantitative trait locus (QTL) for plant height (qHT7.1) was identified near the genomic region harboring the known auxin transporter Dw3 gene. With two loci having repulsion linkage between two inbreds, heterosis in the hybrid can appear as a single locus with an overdominance mode of inheritance (i.e., pseudo-overdominance). Individually, alleles conferring taller plant height exhibited complete dominance over alleles conferring shorter height. Detailed analyses of different height components demonstrated that qHT7.1 affects both the upper and lower parts of the plant, whereas Dw3 affects only the part below the flag leaf. Computer simulations show that repulsion linkage could influence QTL detection and estimation of effect in segregating populations. Guided by findings in linkage mapping, a genome-wide association study of plant height with a sorghum diversity panel pinpointed genomic regions underlying the trait variation, including Dw1, Dw2, Dw3, Dw4, and qHT7.1. Multilocus mixed model analysis confirmed the advantage of complex trait dissection using an integrated approach. Besides identifying a specific genetic example of heterosis, our research indicated that integrated molecular dissection of complex traits in different population types can enable plant breeders to fine tune the breeding process for crop production.
Keywords: genome-wide association studies; heterosis; plant height; pseudo-overdominance; repulsion linkage.
Conflict of interest statement
The authors declare no conflict of interest.
Figures


Similar articles
-
Efficient mapping of plant height quantitative trait loci in a sorghum association population with introgressed dwarfing genes.Genetics. 2008 Sep;180(1):629-37. doi: 10.1534/genetics.108.092239. Epub 2008 Aug 30. Genetics. 2008. PMID: 18757942 Free PMC article.
-
Heterotic trait locus (HTL) mapping identifies intra-locus interactions that underlie reproductive hybrid vigor in Sorghum bicolor.PLoS One. 2012;7(6):e38993. doi: 10.1371/journal.pone.0038993. Epub 2012 Jun 25. PLoS One. 2012. PMID: 22761720 Free PMC article.
-
The dominance model for heterosis explains culm length genetics in a hybrid sorghum variety.Sci Rep. 2021 Feb 25;11(1):4532. doi: 10.1038/s41598-021-84020-3. Sci Rep. 2021. PMID: 33633216 Free PMC article.
-
Heterosis: revisiting the magic.Trends Genet. 2007 Feb;23(2):60-6. doi: 10.1016/j.tig.2006.12.006. Epub 2006 Dec 22. Trends Genet. 2007. PMID: 17188398 Review.
-
Understanding and utilizing crop genome diversity via high-resolution genotyping.Plant Biotechnol J. 2016 Apr;14(4):1086-94. doi: 10.1111/pbi.12456. Epub 2015 Aug 19. Plant Biotechnol J. 2016. PMID: 27003869 Free PMC article. Review.
Cited by
-
Meta-analysis identifies pleiotropic loci controlling phenotypic trade-offs in sorghum.Genetics. 2021 Jul 14;218(3):iyab087. doi: 10.1093/genetics/iyab087. Genetics. 2021. PMID: 34100945 Free PMC article.
-
Increased Power To Dissect Adaptive Traits in Global Sorghum Diversity Using a Nested Association Mapping Population.Genetics. 2017 Jun;206(2):573-585. doi: 10.1534/genetics.116.198499. Genetics. 2017. PMID: 28592497 Free PMC article.
-
Polymerization of beneficial plant height QTLs to develop superior lines which can achieving hybrid performance levels.Mol Breed. 2025 Feb 13;45(2):26. doi: 10.1007/s11032-025-01546-4. eCollection 2025 Feb. Mol Breed. 2025. PMID: 39959602
-
Tall 3-dwarfs: oxymoron or opportunity to increase grain yield in sorghum?Planta. 2021 Apr 22;253(5):110. doi: 10.1007/s00425-021-03629-w. Planta. 2021. PMID: 33885928
-
Toward "Smart Canopy" Sorghum: Discovery of the Genetic Control of Leaf Angle Across Layers.Plant Physiol. 2020 Dec;184(4):1927-1940. doi: 10.1104/pp.20.00632. Epub 2020 Oct 22. Plant Physiol. 2020. PMID: 33093232 Free PMC article.
References
-
- Lippman ZB, Zamir D. Heterosis: Revisiting the magic. Trends Genet. 2007;23(2):60–66. - PubMed
-
- Duvick DN. Biotechnology in the 1930s: The development of hybrid maize. Nat Rev Genet. 2001;2(1):69–74. - PubMed
-
- Lin SC, Yuan LP. 1980. Hybrid rice breeding in China. Innovative approaches to rice breeding. Selected Papers from the 1979 International Rice Research Conference (International Rice Research Institute, Manila, Philippines) pp 35–51.
-
- Chen ZJ. Genomic and epigenetic insights into the molecular bases of heterosis. Nat Rev Genet. 2013;14(7):471–482. - PubMed
-
- Goff SA. A unifying theory for general multigenic heterosis: Energy efficiency, protein metabolism, and implications for molecular breeding. New Phytol. 2011;189(4):923–937. - PubMed
Publication types
MeSH terms
Substances
LinkOut - more resources
Full Text Sources
Other Literature Sources

