. 2015 Sep 22;112(38):E5237-45.
doi: 10.1073/pnas.1509317112. Epub 2015 Sep 8.

RNA transcription modulates phase transition-driven nuclear body assembly

Affiliations

RNA transcription modulates phase transition-driven nuclear body assembly

Joel Berry et al. Proc Natl Acad Sci U S A. .

Abstract

Nuclear bodies are RNA and protein-rich, membraneless organelles that play important roles in gene regulation. The largest and most well-known nuclear body is the nucleolus, an organelle whose primary function in ribosome biogenesis makes it key for cell growth and size homeostasis. The nucleolus and other nuclear bodies behave like liquid-phase droplets and appear to condense from the nucleoplasm by concentration-dependent phase separation. However, nucleoli actively consume chemical energy, and it is unclear how such nonequilibrium activity might impact classical liquid-liquid phase separation. Here, we combine in vivo and in vitro experiments with theory and simulation to characterize the assembly and disassembly dynamics of nucleoli in early Caenorhabditis elegans embryos. In addition to classical nucleoli that assemble at the transcriptionally active nucleolar organizing regions, we observe dozens of "extranucleolar droplets" (ENDs) that condense in the nucleoplasm in a transcription-independent manner. We show that growth of nucleoli and ENDs is consistent with a first-order phase transition in which late-stage coarsening dynamics are mediated by Brownian coalescence and, to a lesser degree, Ostwald ripening. By manipulating C. elegans cell size, we change nucleolar component concentration and confirm several key model predictions. Our results show that rRNA transcription and other nonequilibrium biological activity can modulate the effective thermodynamic parameters governing nucleolar and END assembly, but do not appear to fundamentally alter the passive phase separation mechanism.

Keywords: Brownian coalescence; Flory–Huggins regular solution theory; Ostwald ripening; RNA/protein droplets; intracellular phase separation.


Conflict of interest statement

The authors declare no conflict of interest.

Figures

Fig. 1.
Fig. 1.
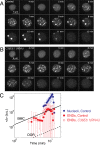
Assembly/disassembly of nucleoli and extranucleolar droplets. (A) Maximum-intensity projection of 3D image stack of an eight-cell-stage C. elegans embryo expressing FIB-1::GFP. A temporal montage of an AB-lineage nucleus is shown throughout the cell cycle. The nuclear envelope assembles at 0 min and breaks down at ∼17 min. (B) Mean integrated intensity of ENDs (red) and nucleoli (blue) over time. Data are pooled from n = 12 embryos (24 nuclei) and plotted on log–log axes. Error bars represent SD. At early times ( 8 min), ENDs and nucleoli are indistinguishable. Lines indicate the theoretical predictions for DOR (dashed) and BMC (solid). The DLG prediction falls several orders of magnitude above the data. (C) Nuclear volume increases over time (solid red squares), resulting in a decreasing concentration of FIB-1 in the nucleoplasm (open green circles). The dotted line indicates the experimentally determined nucleolar saturation concentration, cs (9). (D) Nascent rRNA transcripts colocalize with nucleoli (gray arrows) but not ENDs (white arrowheads). (Scale bars, 5 μm.)
Fig. S1.
Fig. S1.
Assembly dynamics of nucleoli and extranucleolar droplets, labeled with DAO-5::GFP. (A) Maximum-intensity projections of 3D image stacks of control nucleus over time. (B) Maximum-intensity projections of 3D image stacks of C36E8.1(RNAi) nucleus over time. (C) Coarsening kinetics of DAO-5::GFP droplets.
Fig. 2.
Fig. 2.
In vitro phase separation of a nucleolar protein. (A) Time-lapse images of FIB-1 droplets coalescing on a surface. (B) Phase diagram of FIB-1 in the presence and absence of RNA. The star indicates the protein and salt concentrations of the systems shown in A and C. Data points are averages of three independent trials with the SDs as error bars. (C) Maximum-intensity projections of 3D image stacks of a solution of FIB-1 droplets coarsening over time. (D) Droplet evolution kinetics from experimental data (points) and theoretical predictions (dotted line and hatched area). DLG, black dotted line; BMC, green (−RNA) and red (+RNA); DOR, gray; power law data fits, dashed lines. See Table 1 for numerical values of K and n.
Fig. S2.
Fig. S2.
Effect of RNA on in vitro phase separation is not sequence specific. Shown is threshold concentration of FIB-1 required to phase separate at 250 mM NaCl in the presence or absence of RNA.
Fig. 3.
Fig. 3.
Schematic illustrations of passive transport mechanisms. DLG: diffusion-limited growth. Molecules move from the supersaturated bulk fluid into droplets. DOR: Diffusion-limited Ostwald ripening. Molecules move from small droplets to large droplets. BMC: Brownian motion-induced coalescence. Small droplets fuse to form larger droplets. For all mechanisms, the average droplet size R in steady state increases as a power law in time with exponent n.
Fig. S3.
Fig. S3.
Fluorescence correlation spectroscopy (FCS) results.
Fig. S4.
Fig. S4.
In vitro droplet distributions and scaling. (A) Number density of droplets vs. time. Fits are to the solid symbols for t>12 min (+RNA) and t>25 min (−RNA), respectively. (B) Distribution height (Afit) vs. time based on Gaussian and lognormal fits to the distributions (as shown in D). (C) Bare +RNA droplet number density distributions N(R,t)/V, where V is the volume imaged at each time point. (D) Scaled +RNA droplet number density distributions, displayed as N(R/R,t)/(VAfit), where Afit is the amplitude of the best lognormal fit to each distribution.
Fig. S5.
Fig. S5.
Comparison of kinetic prefactors obtained from BMC simulations and predictive expressions used in the analysis of experimental data.
Fig. 4.
Fig. 4.
Results from representative simulations in which BMC, BMC+DOR, and DOR, respectively, dominate droplet evolution. (A) Phase diagram showing bulk (END) and NOR miscibility boundaries (solid line), spinodal boundaries (dashed line), and tie lines (dotted lines). Simulations cycle between the points indicated. (B) Mean concentration of A molecules within soluble and droplet phases vs. t for the representative DOR simulation. (C) Average droplet volume R3 vs. tt0, where t0 is the time of initial droplet nucleation. All droplets, upper solid lines; ENDs, lower solid lines; θ, dashed lines; NOR-less DOR simulation, gold solid line. (D) Time sequence of droplet configurations during a DOR-dominated simulation with two NOR-like domains (highlighted at time 1,150).
Fig. S6.
Fig. S6.
(A) Ternary model phase diagram. Circles represent the two-phase binodal, connected by tie lines (dotted lines). Squares represent the states cycled between in simulations. The vertical path is traversed by homogeneous concentration changes, whereas the sloped path along ϕ¯A+ϕ¯B=0.82 is traversed by reaction exchange. (B) Collective droplet evolution from representative simulations with and without reactions. All droplets, solid lines; ENDs, dashed lines. The qualitative behavior is unchanged from that of the model examined in the main text.
Fig. 5.
Fig. 5.
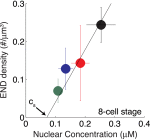
Inhibition of rRNA transcription suppresses nucleolar coarsening; END assembly depends on nuclear concentration. (A) Maximum-intensity projections of 3D image stacks of an eight-cell-stage AB-lineage nucleus over time following RNAi knockdown of C36E8.1. (B) Mean integrated intensity of ENDs pooled from n = 15 C36E8.1(RNAi) embryos (n = 30 nuclei) and plotted on log–log axes. Error bars represent SD. Lines indicate the theoretical predictions for DOR (dashed) and BMC (solid). The DLG prediction falls several orders of magnitude above the data. (C) AB-lineage nuclei from four-cell-stage embryos following RNAi to manipulate cn, the nuclear concentration of FIB-1, and other nucleolar components. Note that nucleoli but not ENDs assemble at intermediate cn in ani-2(RNAi) embryos. (D) Maximum integrated intensity of ENDs increases with increasing cn in eight-cell-stage embryos. Solid line is a linear fit to the data. The x intercept represents the nucleolar saturation concentration, cs. Dashed and dotted lines indicate the predictions given experimentally observed (Kexp) and theoretical (KBMC) parameter values, respectively.
Fig. S7.
Fig. S7.
Maximum number density of ENDs increases with increasing cn in eight-cell-stage embryos. The solid line is a linear fit to the data. The x intercept represents the saturation concentration, cs.
Fig. S8.
Fig. S8.
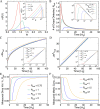
Effect of measurement resolution on droplet statistics during DOR. (A) Evolution of the DOR distribution. Inset shows the same curves on a log–log scale. (B) Number of droplets detected Ncut vs. tt0 for four values of Rcut. The dotted line is the exact result corresponding to Rcut=0. Inset shows the same curves on a log–log scale. (C and D) Measured average droplet radius Rcut and measured average droplet volume R3cut vs. tt0, respectively. The dotted lines are the exact results corresponding to Rcut=0. Insets show the same curves on a log–log scale. (E) Measured droplet volume fractions θcut vs. tt0, for θ=1/10. (F) Measured nucleoplasmic concentration cscut vs. tt0, for θ=1/10, cn=1/4, and cs=1/20.
Fig. S9.
Fig. S9.
Error in DOR droplet statistics due to measurement resolution. (A) Fractional error in measurement of R for various Rcut. The quantity plotted is RRcut=1.5/RRcut=01. The lines obey a power law with exponent 1. (B) Fractional error in measurement of various quantities for Rcut=1.5. The dashed lines are power law fits of the form indicated. Inset shows the time required to reach 10% fractional error, t, vs. Rcut for the same quantities. All scale as Rcut3.

References

    1. Brangwynne CP, et al. Germline P granules are liquid droplets that localize by controlled dissolution/condensation. Science. 2009;324(5935):1729–1732. - PubMed
    1. Elbaum-Garfinkle S, et al. The disordered P granule protein LAF-1 drives phase separation into droplets with tunable viscosity and dynamics. Proc Natl Acad Sci USA. 2015;112(23):7189–7194. - PMC - PubMed
    1. Brangwynne CP, Mitchison TJ, Hyman AA. Active liquid-like behavior of nucleoli determines their size and shape in Xenopus laevis oocytes. Proc Natl Acad Sci USA. 2011;108(11):4334–4339. - PMC - PubMed
    1. Wippich F, et al. Dual specificity kinase DYRK3 couples stress granule condensation/dissolution to mTORC1 signaling. Cell. 2013;152(4):791–805. - PubMed
    1. Weber SC, Brangwynne CP. Getting RNA and protein in phase. Cell. 2012;149(6):1188–1191. - PubMed

Publication types