. 2015 Oct 6;112(40):E5533-42.
doi: 10.1073/pnas.1515606112. Epub 2015 Sep 8.

Nanoscale patterning of STIM1 and Orai1 during store-operated Ca2+ entry

Affiliations

Nanoscale patterning of STIM1 and Orai1 during store-operated Ca2+ entry

Stefano Perni et al. Proc Natl Acad Sci U S A. .

Abstract

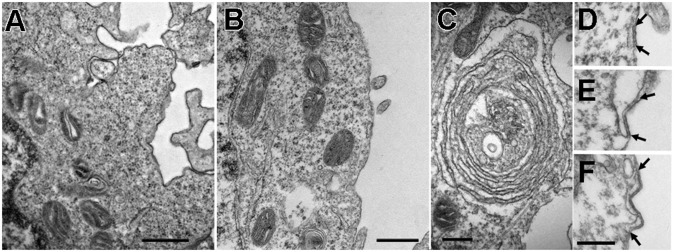
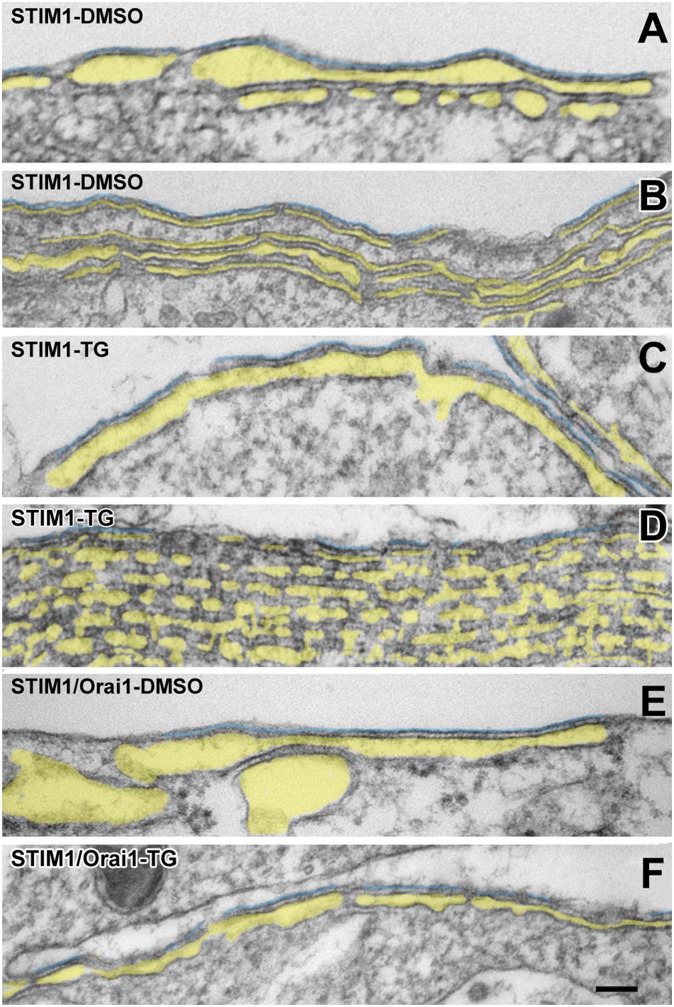
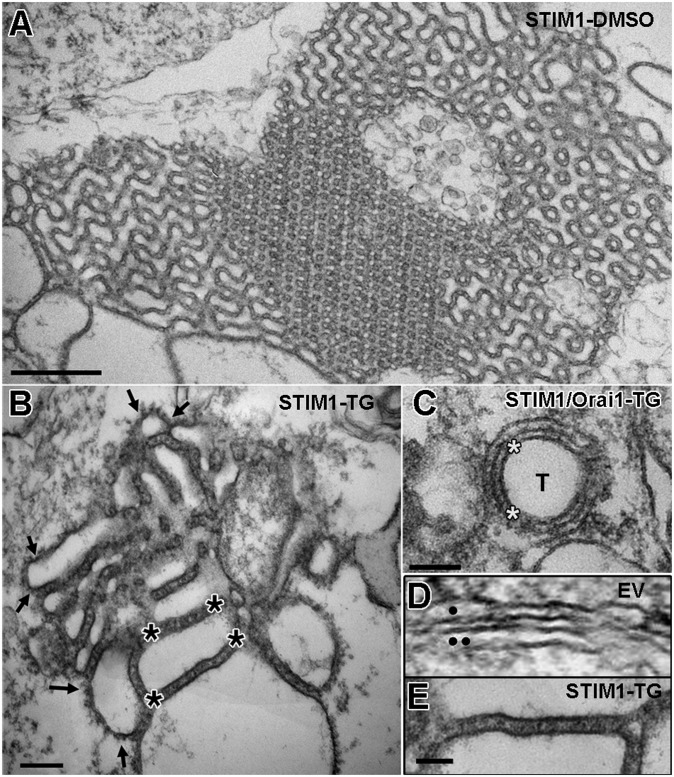
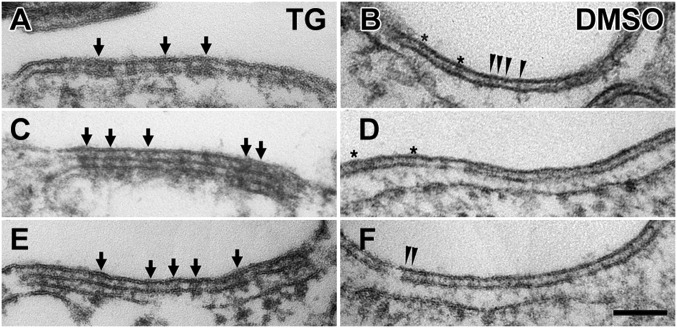
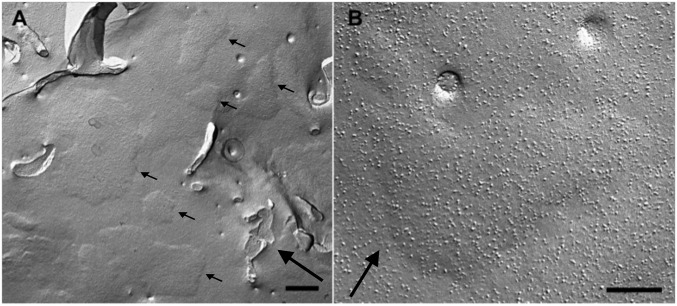
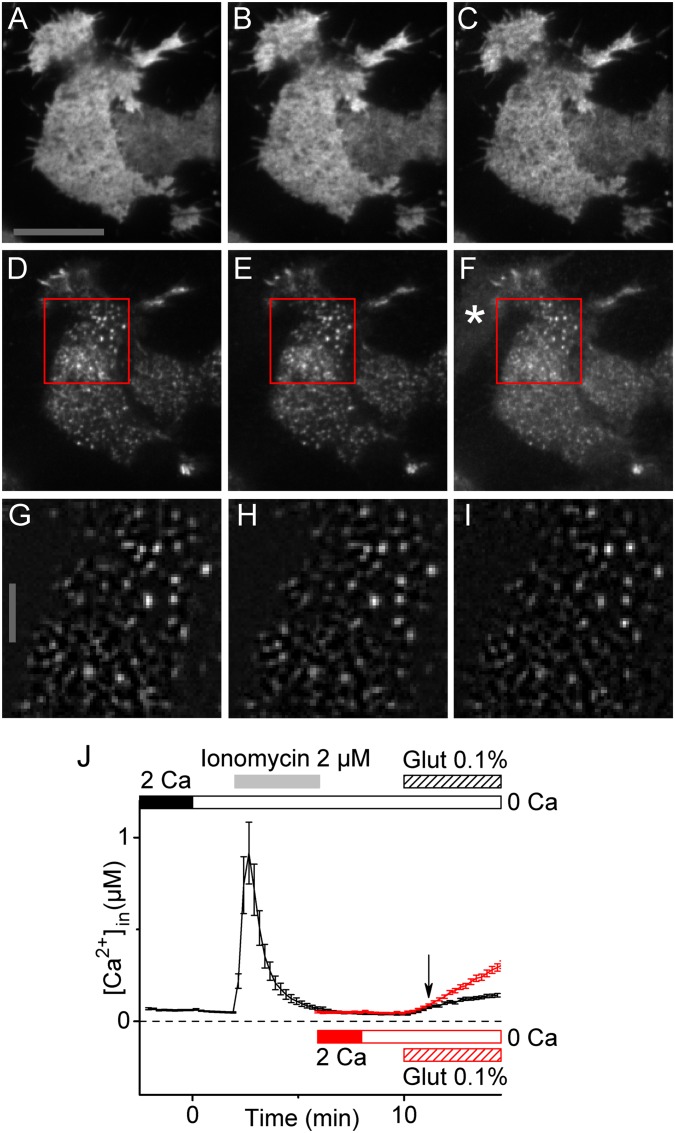
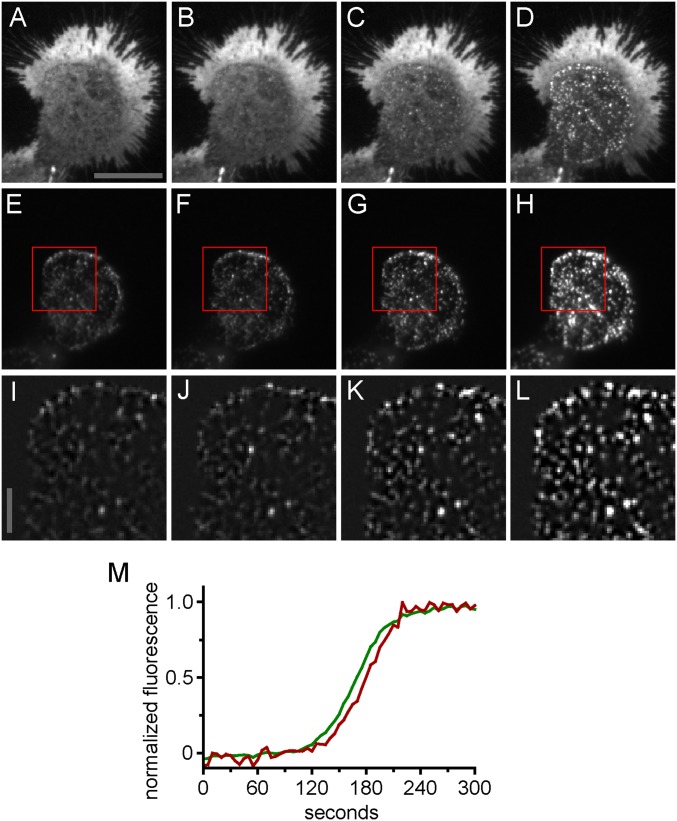
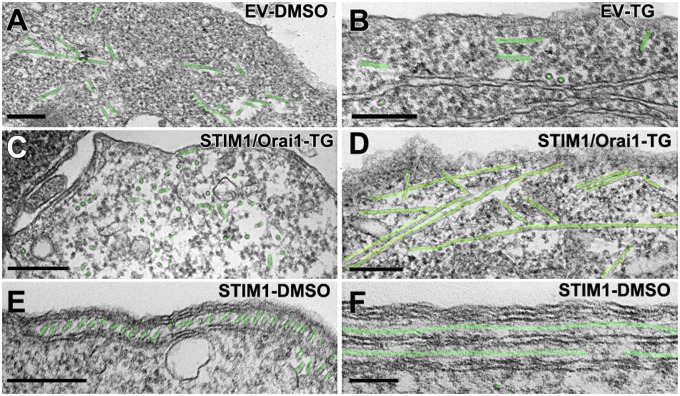
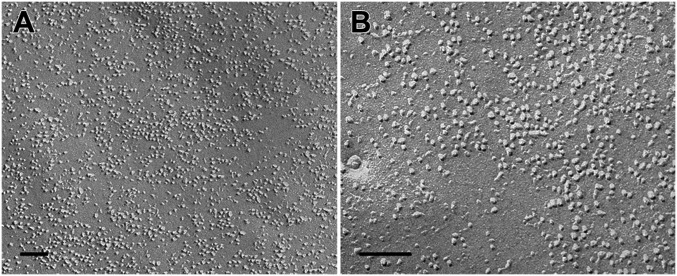
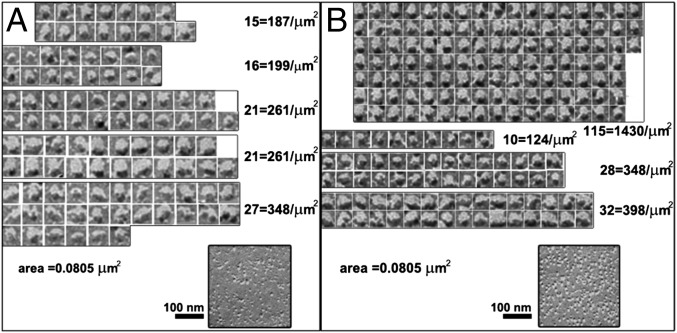
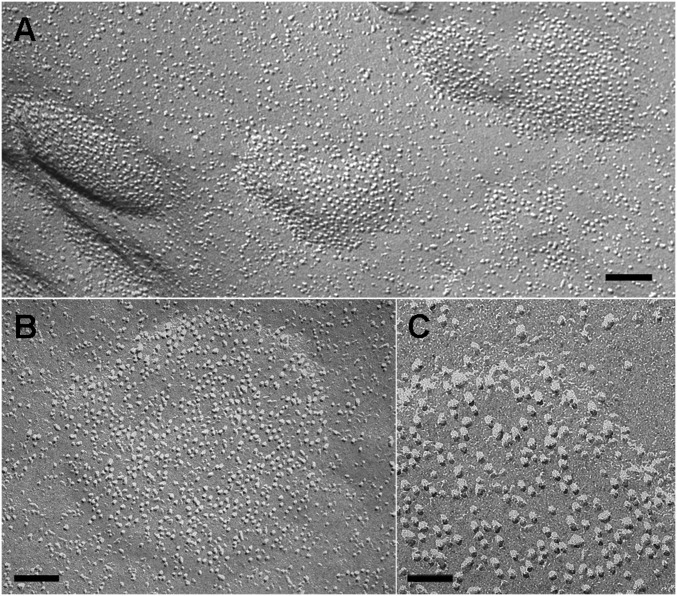
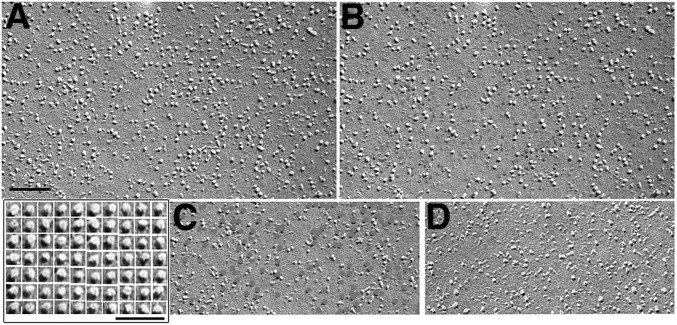
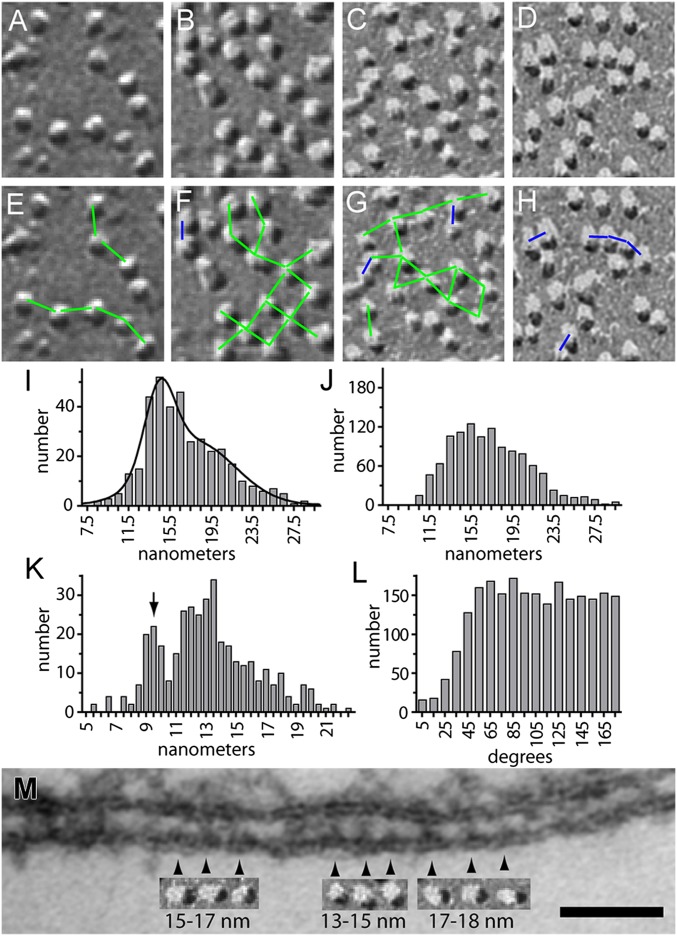
Stromal interacting molecule (STIM) and Orai proteins constitute the core machinery of store-operated calcium entry. We used transmission and freeze-fracture electron microscopy to visualize STIM1 and Orai1 at endoplasmic reticulum (ER)-plasma membrane (PM) junctions in HEK 293 cells. Compared with control cells, thin sections of STIM1-transfected cells possessed far more ER elements, which took the form of complex stackable cisternae and labyrinthine structures adjoining the PM at junctional couplings (JCs). JC formation required STIM1 expression but not store depletion, induced here by thapsigargin (TG). Extended molecules, indicative of STIM1, decorated the cytoplasmic surface of ER, bridged a 12-nm ER-PM gap, and showed clear rearrangement into small clusters following TG treatment. Freeze-fracture replicas of the PM of Orai1-transfected cells showed extensive domains packed with characteristic "particles"; TG treatment led to aggregation of these particles into sharply delimited "puncta" positioned upon raised membrane subdomains. The size and spacing of Orai1 channels were consistent with the Orai crystal structure, and stoichiometry was unchanged by store depletion, coexpression with STIM1, or an Orai1 mutation (L273D) affecting STIM1 association. Although the arrangement of Orai1 channels in puncta was substantially unstructured, a portion of channels were spaced at ∼15 nm. Monte Carlo analysis supported a nonrandom distribution for a portion of channels spaced at ∼15 nm. These images offer dramatic, direct views of STIM1 aggregation and Orai1 clustering in store-depleted cells and provide evidence for the interaction of a single Orai1 channel with small clusters of STIM1 molecules.

Keywords: Orai1; SOCE; STIM1; electron microscopy; nanoscale patterning.


Conflict of interest statement

The authors declare no conflict of interest.

Figures

Fig. 1.
Fig. 1.
Thin-section EM images of the cell periphery. A and C are from Orai1/TG, and B and D–F are from EV/DMSO cells. A and B show common appearances of the cell periphery and ER in Orai1- and EV-transfected cells (but not STIM1-transfected cells). The cytoplasm is poorly structured, and ER elements are scarce and have a smooth cytoplasmic surface. (C) Rare example of parallel but separate ER elements in an Orai1/TG cell. D–F illustrate examples of JCs in EV/DMSO cells (between arrows). A short (D), a medium (E), and a longer (F) JC are shown. All JCs are rare, and longer ones are extremely rare, in these cells. (Scale bars: A and B, 500 nm; C–F, 250 nm.]
Fig. 2.
Fig. 2.
Targeting of ER elements to the periphery of cells transfected with STIM1. Thin sections at the edges of cells transfected with either STIM1 only (A–D) or STIM1/Orai1 together (E and F) and treated with either DMSO (A, B, and E) or TG (C, D, and F), as indicated in the figure. Multiple elongated ER cisternae, identified by pale yellow in their lumen, are closely apposed to the PM, forming JCs, and to each other at the cell edge. The lumen width varies, but the gap between adjacent ER cisternae and ER cisternae and PM is quite uniform. The ER in A and D seems discontinuous because it is fenestrated (compare with Fig. 3). STIM1 only cells were exposed to higher DNA levels for STIM1 and have more stacks. The PM segments in close apposition to the peripheral ER stacks within JCs are outlined in turquoise. (Scale bars: 100 nm.)
Fig. 3.
Fig. 3.
Extensive ER-ER association and visible STIM1 protein extensions in cells transfected with STIM1. Thin sections through the cytoplasm of cells expressing either high levels of STIM1 in the absence of Orai1 (A, B, and E) or lower levels of STIM1 after STIM1/Orai1 cotransfection (C) or no STIM at all (D). (A and B) Three-dimensional ER networks (here filling the whole image), with different configurations of the closely packed elements. These networks are only visible in cells expressing high levels of STIM1 and are independent of DMSO (A) or TG (B) treatments. However, visible bristle-like extensions on the ER’s cytoplasmic surface reflecting aggregation of STIM1 into small clusters (some indicated between pairs of small arrows in B) are present only in TG-treated cells (also see Fig. 4). Asterisks indicate STIM1 extensions between ER membranes. (C) Circular ER cisterna surrounds an invagination of the PM (T) in a STIM1/Orai1/TG cell. Similar structures are also seen in the absence of Orai1. Asterisks indicate the presence of STIM1 extensions between the ER and the PM invaginations. (D and E) Comparison between the smooth ER (●) and nuclear envelope (●●) profiles in an EV cell (D) with the fuzzy profile of ER in a STIM1-TG cell (E). (Scale bars: A, 500 nm; B and C, 100 nm; D and E, 50 nm.)
Fig. 4.
Fig. 4.
Clustering of STIM1 molecules at ER-PM junctions after store depletion in STIM1/Orai1 cells. Sections at the cell periphery showing JCs. The gap between the ER and PMs is occupied by electron-dense projections, presumably cytoplasmic extensions of STIM1, which display two different states of aggregation. After TG treatment (A, C, and E), the molecules are grouped into small aggregates of various sizes (some indicated by arrows), whereas in DMSO-treated cells (B, D, and F), the molecules are dispersed and appear singly as very thin lines indicated by arrowheads. In both cases, the section thickness (∼40–50 nm) includes many molecules, and a clear view of individual and/or clustered molecules is obtained only where there is a close alignment across the section thickness. Where the molecules are not aligned, a fuzzy layer results (e.g., between asterisks in B and D). (Scale bar: A–F, 100 nm.)
Fig. S1.
Fig. S1.
STIM1 expression produced raised PM subdomains. (A and B) Freeze–fracture of the PM in cells expressing STIM1 and L273D Orai1. Numerous domains of the plasmalemma are slightly raised outwards into flat platforms of variable sizes and shapes (small arrows in A) because of the presence of subplasmalemmal ER cisternae forming JCs. Compare with Figs. 2 and 4. Large arrows indicate the direction of the platinum shadow. (Scale bars: A, 500 nm; B, 200 nm.)
Fig. S2.
Fig. S2.
Preservation of Orai1 and STIM1 localization and Ca2+ store integrity by glutaraldehyde (Glut) fixation. (A–I) TIRF microscopy was used to assess the degree of fixation-induced redistribution STIM1 and Orai1 in transfected HEK 293A cells. Changes in STIM1 brightness and distribution would indicate movement of STIM1 toward and engagement with the PM, initial steps in SOCE. Clustering of Orai1 into puncta would indicate participation in a later step in SOCE. Images were acquired 1 min before fixation (A, D, and G) and both 1 min (B, E, and H) and 9 min (C, F, and I) after addition of 0.1% glutaraldehyde. A–C are EGFP-Orai1, D–F are mCherrry-STIM1, and G–I are background-subtracted and enlarged images of mCherry-STIM1 taken from the regions indicated by the red squares in D, E, and F, respectively. The consistency of STIM1 and Orai1 distributions before and after fixation indicate that 0.1% glutaraldehyde does not induce protein redistributions that accompany SOCE. Images were produced by averaging 10 consecutive image frames taken at one frame per 5 s. The asterisk in F indicates a cell displaying glutaraldehyde-induced fluorescence. The scale bar in A is 20 μm and applies to A–F. The scale bar in G is 5 μm and applies to G–I. (J) Ca2+ imaging was used to measure loss of Ca2+ from internal stores in response to fixation. Time courses of internal Ca2+ concentration of HEK 293A cells transfected with Orai1 and STIM1 and fixed with 0.1% glutaraldehyde are shown. The black trace corresponds to cells (n = 14) treated with 2 µM ionomycin in 0 Ca Ringer solution to deplete internal Ca2+ stores before fixation, whereas the red trace corresponds to cells (n = 30) fixed directly without ionomycin treatment. Traces were aligned by the time of glutaraldehyde addition, and the arrow indicates 1 min after glutaraldehyde addition. Note that glutaraldehyde addition to cells without internal calcium stores leads to a progressive autofluorescence-induced increase in the ratio of emission when excited at 340 nm/380 nm. When Fura-2 responses are calibrated, this autofluorescence is “read-out” as an apparent increase in [Ca2+]in. Within the ∼1 min required to fix cells, there is no difference in the plotted [Ca2+]in between store-depleted and store-replete cells. This indicates that fixation does not release Ca2+ from internal stores before cellular structures are immobilized.
Fig. S3.
Fig. S3.
Redistribution of STIM1 and Orai1 in response to store depletion by TG. (AL) TIRF microscopy was used to document store depletion-induced redistribution of STIM1 and Orai1 in transfected HEK 293A cells. These images serve as a point of comparison for possible fixation-induced redistribution of STIM1 and Orai1. Images were acquired 0.5 min before fixation (A, E, and I) and 1.5 min (B, F, and J), 2.5 min (C, G, and K), and 3.5 min (D, H, and L) after addition of 2 µM TG. A–D are mCherry-Orai1, E–H are EYFP-STIM1, and I–L are background-subtracted and enlarged images of EYFP-STIM1 taken from the regions indicated by the red squares in E–H, respectively. Note the increase in EYFP-STIM1 fluorescence in H and L attributable to movement of STIM1 toward the basal PM and into the evanescent TIRF light field. Images were produced by averaging 10 consecutive image frames taken at one frame per 5 s The scale bar in A is 20 μm and applies to A–H. The scale bar in I is 5 μm and applies to I–L. (M) Time course of EYFP-STIM1 and mCherry-Orai1 movement into puncta. Fluorescence of EYFP-STIM1 and mCherry-Orai1 at the sites of puncta formation was measured and plotted versus time after 2 µM TG addition. The green trace indicates EYFP-STIM1, and the red trace indicates mCherry-Orai1. Fluorescence values were normalized to the range of final minus initial fluorescence. Note that EYFP-STIM1 arrival at puncta precedes mCherry-Orai1.
Fig. 5.
Fig. 5.
Organization of peripheral microtubules in cells transfected with STIM1. Thin sections at the periphery of EV/DMSO (A),EV/TG (B), STIM1/Orai1/TG (C and D), and STIM1/DMSO (E and F) cells. In all cells, microtubule tracks (highlighted in green) run mostly parallel to the cell surface. E and F show abundant flat cisternae of peripheral ER in close association with microtubules. This is seen in TG-treated as well as in DMSO-treated cells (shown here). (Scale bars: A–E, 250 nm; F, 100 nm.)
Fig. 6.
Fig. 6.
Freeze–fracture images of the PM of Orai1-transfected cells. (A) Overexpression of only Orai1 channels. (B) Overexpression of both STIM1 and Orai1. Note a very high density of particles with apparently uniform size and shape (presumably the overexpressed Orai channels) mixed with native particles of variable size and shape. The edge of the densely occupied region in B runs approximately along the diagonal from upper left to lower right corners, showing the uneven distribution of particles at the border. (Scale bars: 100 nm.)
Fig. 7.
Fig. 7.
Classification of intramembrane particles in Orai1-transfected cells. The distributions of intramembrane particles were compared between a region of a STIM1/Orai1/TG cell exhibiting a cluster of similar and apparently exogenous particles (B) and a representative region from the PM of an untransfected cell (A). A visual selection akin to correspondence analysis reveals a well-represented population of selected particles with common characteristics in the particle cluster of the STIM1/Orai1/TG cell (shown at the top of B). Particles with a similar appearance are far fewer in the untransfected cells (at the top in A), so the selected particles represent an additional population with common features and can be identified as Orai1 channels. All Orai1-overexpressing cells present areas containing additional particles with common characteristics (compare Figs. 6, 8, and 9).
Fig. 8.
Fig. 8.
Orai1 clustering in STIM1/Orai1/TG cells. (A) Several clusters. (B and C) Examples of individual clusters at increasing magnifications. Orai1 channels (as defined in Figs. 6 and 7) accumulate at high density over patches of PM, leaving only native particles in the adjacent membrane areas. Note the sharply delimited edges and the raised position of the patches relative to the rest of the membrane. Although clustered, the channels are not tightly packed, supposedly because they are associated with the underlying STIM1 protein. Similar clustering is extremely rare in STIM1/Orai1/DMSO cells, even where the overall density of Orai1 channels is very high (compare with Fig. 6). (Scale bars: A and B, 100 nm; C, 50 nm.)
Fig. 9.
Fig. 9.
L273D Orai1, a mutant that does not interact with STIM1, forms a set of particles similar to WT Orai1. (A) Expression levels of the mutated L273D Orai channel in L273D DMSO cells are lower than for Orai1, so the images show a larger proportion of native proteins between the expressed channels relative to Fig. 6. A homogeneous population of selected particles similar to those identified in Orai1 channel expression can be identified (lower left image; compare with Fig. 7). (B and C) Same area as A (or a portion of it), but in B, the particles constituting the random population are hidden under gray circles, whereas in C, the population of selected particles is similarly eliminated. B, in which only the selected particles are visible, is clearly different from D, an image of native particles from another cell area. On the other hand, hiding the population of selected particles leaves behind a varied population that mimics very well the native configuration (compare C and D). Thus, the selected particles are an additional set superimposed on the native population. (Scale bar: A–D, 100 nm).
Fig. 10.
Fig. 10.
Spacing of Orai1 and STIM1 at ER-PM junctions of STIM1/Orai1/TG cells. Freeze–fracture images of Orai1 channels in puncta with a low density (A) and high density (B–D) of Orai1 channels. (E–H) Images corresponding to A–D in which the center-to-center distance between selected pairs of Orai1 channels has been labeled with standard rulers of 9 nm (blue line segments) or 15 nm (green line segments). (I) Histogram of the distance to the second-closest particle for a representative punctum (n = 380 particles). The curve corresponds to a nonlinear fit to the sum of two Gaussian functions. (J) Histogram of the distance to the second-closest particle for an equal number of random particles from Monte Carlo simulation corresponding to the region of interest from I, which Includes the combined distances from three separate simulations (n = 1140 particles). (K) Histogram of the distance to the closest particle for the punctum with the greatest fraction of touching particles (n = 380 particles). The arrow indicates the subset of touching particles. (L) Histogram of internal angles between the closest and second-closest particle. Angles from all particles of five puncta were combined (n = 2,286 particles). (M) ER-PM junction showing clusters of STIM1 molecules (arrowheads). Beneath the junction are freeze–fracture images of Orai1 channel groups from puncta shown at the same scale. The sizes refer to the range of distances between adjacent STIM1 clusters. (Scale bar: A–H and M, 50 nm.)

Similar articles

Cited by

References

    1. Flucher BE, Franzini-Armstrong C. Formation of junctions involved in excitation-contraction coupling in skeletal and cardiac muscle. Proc Natl Acad Sci USA. 1996;93(15):8101–8106. - PMC - PubMed
    1. Porter KR, Palade GE. Studies on the endoplasmic reticulum. III. Its form and distribution in striated muscle cells. J Biophys Biochem Cytol. 1957;3(2):269–300. - PMC - PubMed
    1. Liou J, et al. STIM is a Ca2+ sensor essential for Ca2+-store-depletion-triggered Ca2+ influx. Curr Biol. 2005;15(13):1235–1241. - PMC - PubMed
    1. Roos J, et al. STIM1, an essential and conserved component of store-operated Ca2+ channel function. J Cell Biol. 2005;169(3):435–445. - PMC - PubMed
    1. Feske S, et al. A mutation in Orai1 causes immune deficiency by abrogating CRAC channel function. Nature. 2006;441(7090):179–185. - PubMed

Publication types

MeSH terms