

Reducing adsorption to improve recovery and in vivo detection of neuropeptides by microdialysis with LC-MS
- PMID: 26351736
- PMCID: PMC5118035
- DOI: 10.1021/acs.analchem.5b02086
Reducing adsorption to improve recovery and in vivo detection of neuropeptides by microdialysis with LC-MS
Abstract
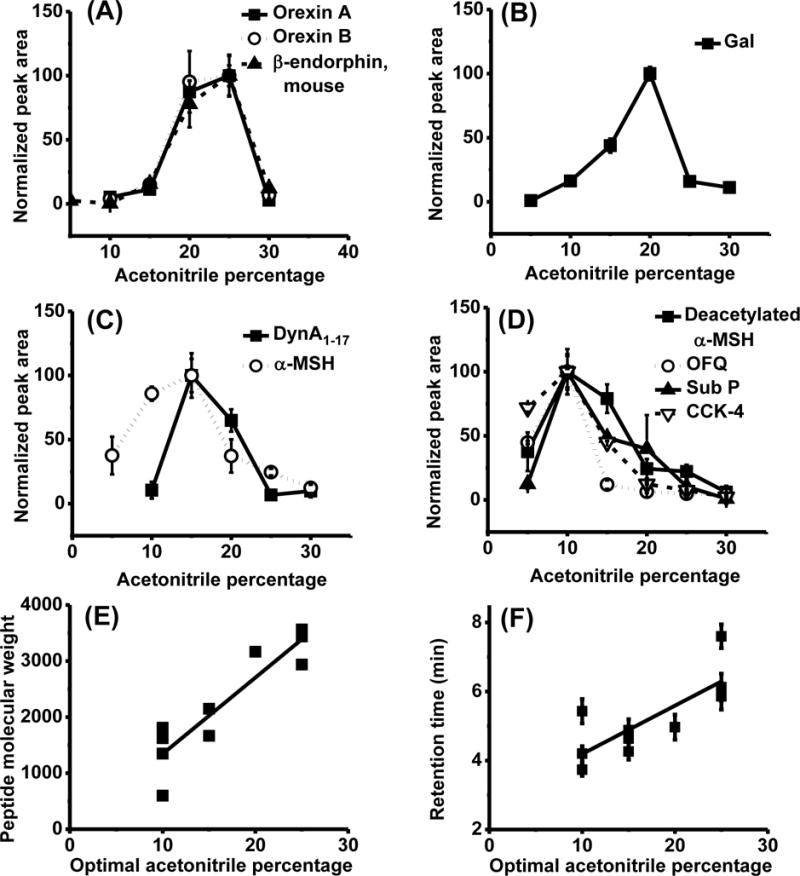
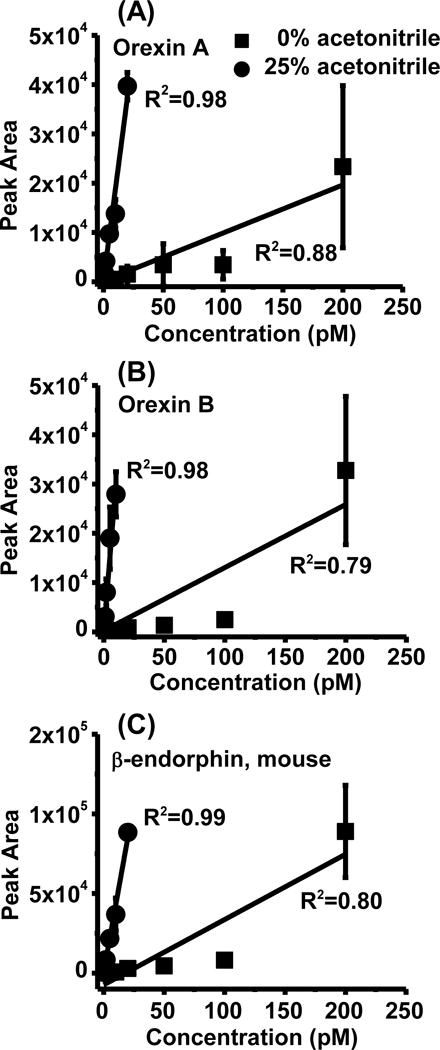
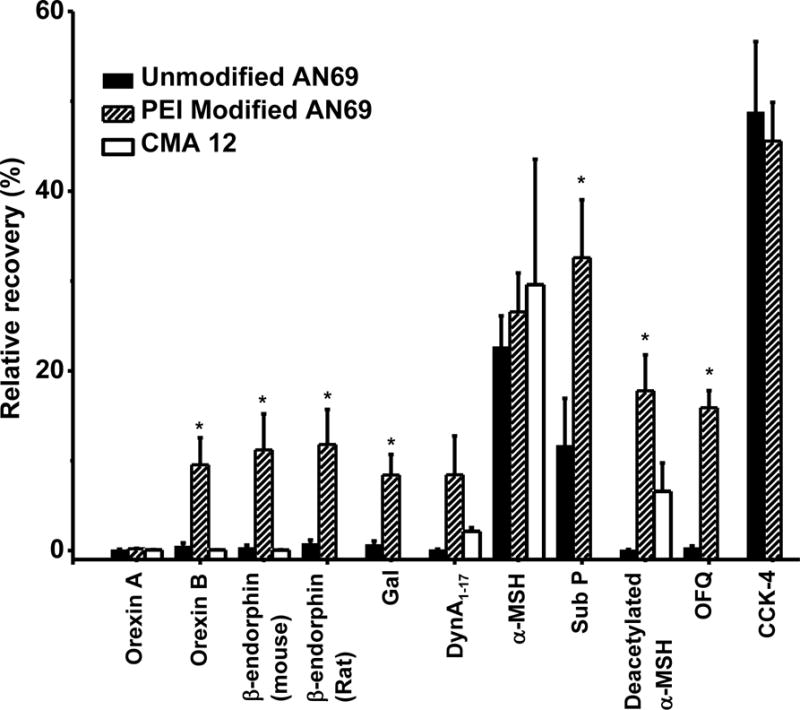
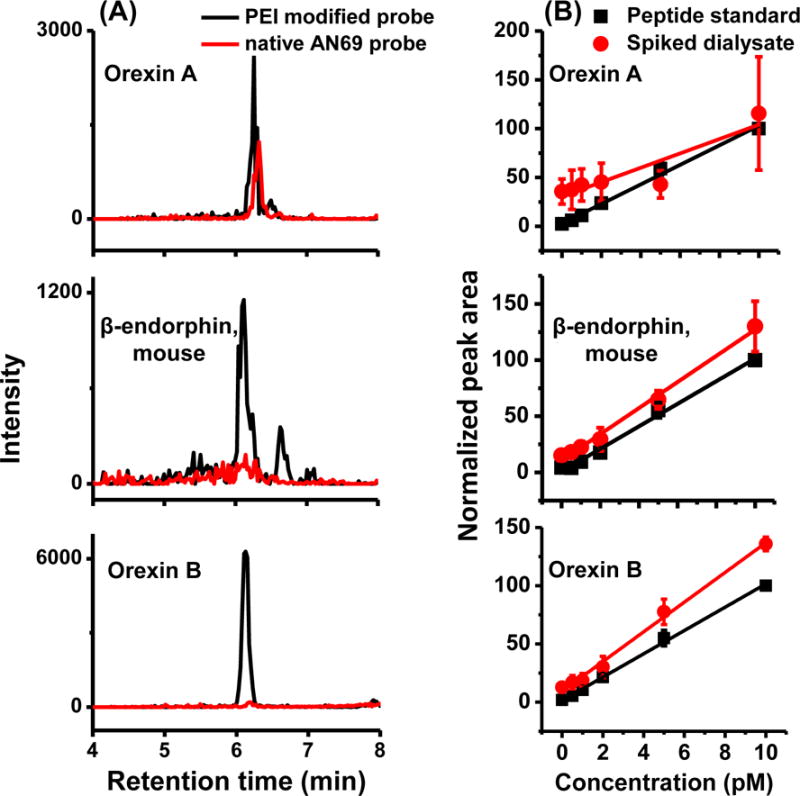
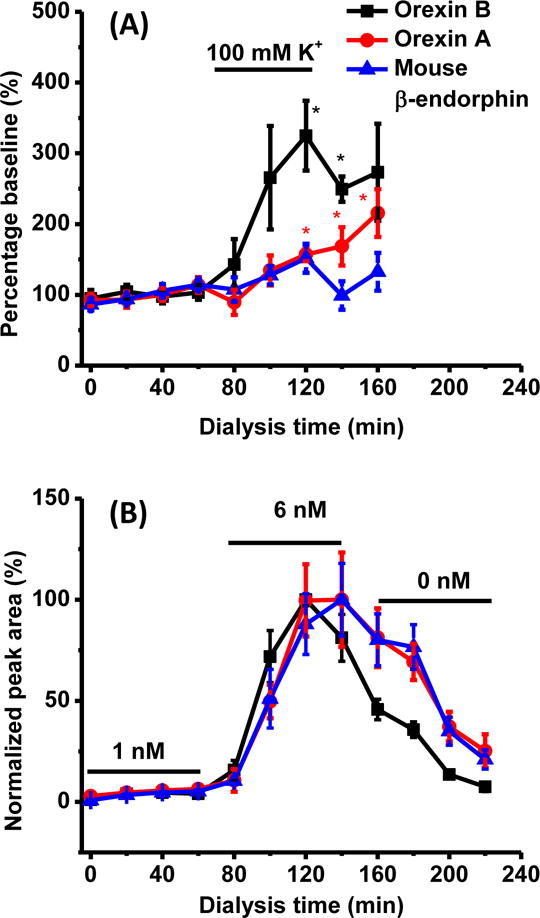
Neuropeptides are an important class of neurochemicals; however, measuring their concentration in vivo by using microdialysis sampling is challenging due to their low concentration and the small samples generated. Capillary liquid chromatography with mass spectrometry (cLC-MS) can yield attomole limits of detection (LOD); however, low recovery and loss of sample to adsorptive surfaces can still hinder detection of neuropeptides. We have evaluated recovery during sampling and transfer to the cLC column for a selection of 10 neuropeptides. Adding acetonitrile to sample eliminated carryover and improved LOD by 1.4- to 60-fold. The amount of acetonitrile required was found to have an optimal value that correlated with peptide molecular weight and retention time on a reversed phase LC column. Treating AN69 dialysis membrane, which bears negative charge due to incorporated sulfonate groups, with polyethylenimine (PEI) improved recovery by 1.2- to 80-fold. The effect appeared to be due to reducing electrostatic interaction between peptides and the microdialysis probe because modification increased recovery only for peptides that carried net positive charge. The combined effects improved LOD of the entire method by 1.3- to 800-fold for the different peptides. We conclude that peptides with both charged and hydrophobic regions require combined strategies to prevent adsorption and yield the best possible detection. The method was demonstrated by determining orexin A, orexin B, and a novel isoform of rat β-endorphin in the arcuate nucleus. Dialysate concentrations were below 10 pM for these peptides. A standard addition study on dialysates revealed that while some peptides can be accurately quantified, some are affected by the matrix.
Figures
Similar articles
-
Challenges for the in vivo quantification of brain neuropeptides using microdialysis sampling and LC-MS.Bioanalysis. 2016 Sep;8(18):1965-85. doi: 10.4155/bio-2016-0119. Epub 2016 Aug 24. Bioanalysis. 2016. PMID: 27554986 Review.
-
Practical aspects of in vivo detection of neuropeptides by microdialysis coupled off-line to capillary LC with multistage MS.Anal Chem. 2009 Mar 15;81(6):2242-50. doi: 10.1021/ac802391b. Anal Chem. 2009. PMID: 19196160 Free PMC article.
-
Rapid preconcentration for liquid chromatography-mass spectrometry assay of trace level neuropeptides.J Am Soc Mass Spectrom. 2013 Nov;24(11):1700-9. doi: 10.1007/s13361-013-0605-1. Epub 2013 Apr 17. J Am Soc Mass Spectrom. 2013. PMID: 23592077 Free PMC article.
-
Monitoring neuropeptides in vivo via microdialysis and mass spectrometry.Methods Mol Biol. 2010;615:57-73. doi: 10.1007/978-1-60761-535-4_5. Methods Mol Biol. 2010. PMID: 20013200
-
The absolute quantification of endogenous levels of brain neuropeptides in vivo using LC-MS/MS.Bioanalysis. 2011 Jun;3(11):1271-85. doi: 10.4155/bio.11.91. Bioanalysis. 2011. PMID: 21649502 Review.
Cited by
-
Recent advances in mass spectrometry analysis of neuropeptides.Mass Spectrom Rev. 2023 Mar;42(2):706-750. doi: 10.1002/mas.21734. Epub 2021 Sep 24. Mass Spectrom Rev. 2023. PMID: 34558119 Free PMC article. Review.
-
Electrochemical Quantification of Enkephalin Peptides Using Fast-Scan Cyclic Voltammetry.Anal Chem. 2024 Aug 13:10.1021/acs.analchem.4c02418. doi: 10.1021/acs.analchem.4c02418. Online ahead of print. Anal Chem. 2024. PMID: 39138126 Free PMC article.
-
Reduction of αSYN Pathology in a Mouse Model of PD Using a Brain-Penetrating Bispecific Antibody.Pharmaceutics. 2022 Jul 5;14(7):1412. doi: 10.3390/pharmaceutics14071412. Pharmaceutics. 2022. PMID: 35890306 Free PMC article.
-
Brain pharmacokinetics of mono- and bispecific amyloid-β antibodies in wild-type and Alzheimer's disease mice measured by high cut-off microdialysis.Fluids Barriers CNS. 2022 Dec 12;19(1):99. doi: 10.1186/s12987-022-00398-w. Fluids Barriers CNS. 2022. PMID: 36510227 Free PMC article.
-
Wireless, battery-free push-pull microsystem for membrane-free neurochemical sampling in freely moving animals.Sci Adv. 2022 Feb 25;8(8):eabn2277. doi: 10.1126/sciadv.abn2277. Epub 2022 Feb 23. Sci Adv. 2022. PMID: 35196090 Free PMC article.
References
-
- Geracioti TD, Carpenter LL, Owens MJ, Baker DG, Ekhator NN, Horn PS, Strawn JR, Sanacora G, Kinkead B, Price LH, Nemeroff CB. Am J Psychiat. 2006;163:637–643. - PubMed
-
- Hanson GR, Bush L, Keefe KA, Alburges ME. J Neurochem. 2002;82:1171–1178. - PubMed
-
- Lam M, Marinelli P, Bai L, Gianoulakis C. Psychopharmacology. 2008;201:261–271. - PubMed
-
- Sirinathsinghji DJS, Nikolarakis KE, Herz A. Brain Res. 1989;490:276–291. - PubMed
Publication types
MeSH terms
Substances
Grants and funding
LinkOut - more resources
Full Text Sources
Other Literature Sources
