. 2015 Sep 9;10(9):e0137503.
doi: 10.1371/journal.pone.0137503. eCollection 2015.

Association between Prediagnostic Allergy-Related Serum Cytokines and Glioma

Affiliations

Association between Prediagnostic Allergy-Related Serum Cytokines and Glioma

Judith Schwartzbaum et al. PLoS One. .

Abstract

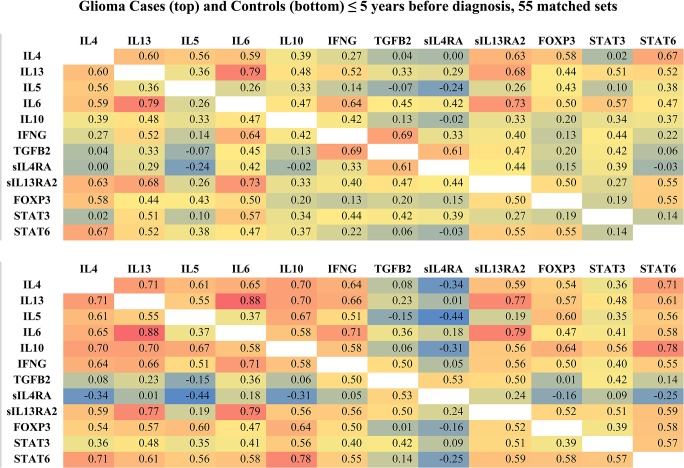
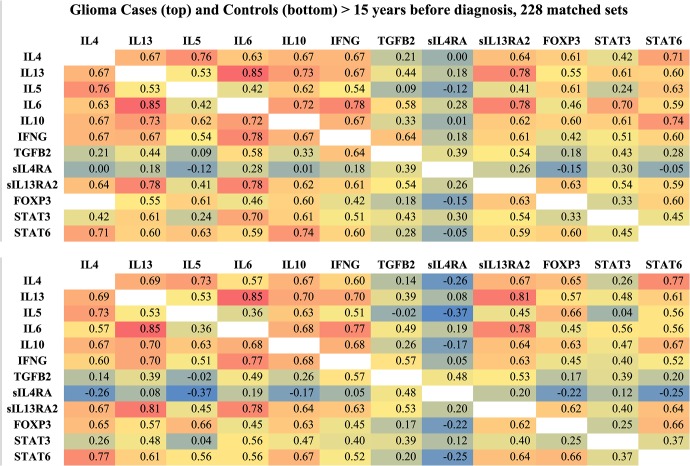
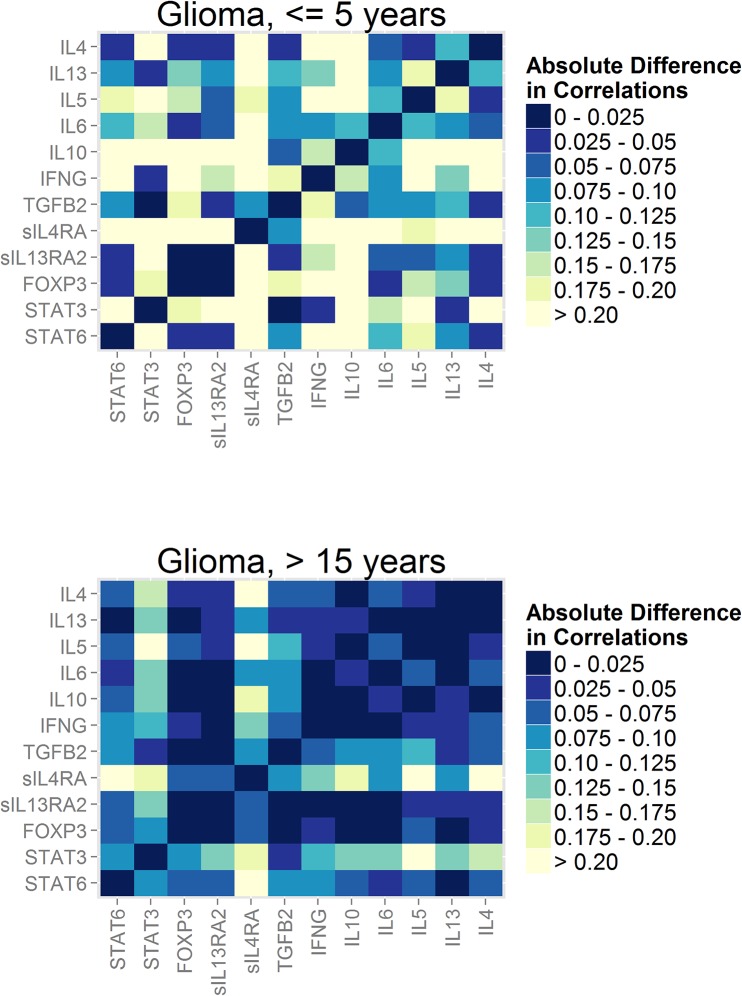
Allergy is inversely related to glioma risk. To determine whether prediagnostic allergy-related serum proteins are associated with glioma, we conducted a nested case-control study of seven cytokines (IL4, IL13, IL5, IL6, IL10, IFNG, TGFB2), two soluble cytokine receptors (sIL4RA, sIL13RA2) and three allergy-related transcription factors (FOXP3, STAT3, STAT6) using serum specimens from the Janus Serum Bank Cohort in Oslo, Norway. Blood donors subsequently diagnosed with glioma (n = 487) were matched to controls (n = 487) on age and date of blood draw and sex. We first estimated individual effects of the 12 serum proteins and then interactions between IL4 and IL13 and their receptors using conditional logistic regression. We next tested equality of case-control inter-correlations among the 12 serum proteins. We found that TGFB2 is inversely related to glioblastoma (Odds Ratio (OR) = 0.87, 95% Confidence Interval (CI)) = 0.76, 0.98). In addition, ≤ 5 years before diagnosis, we observed associations between IL4 (OR = 0.82, 95% CI = 0.66, 1.01), sIL4RA (OR = 0.80, 95% CI = 0.65, 1.00), their interaction (OR = 1.06, 95% CI = 1.01, 1.12) and glioblastoma. This interaction was apparent > 20 years before diagnosis (IL4-sIL4RA OR = 1.20, 95% CI = 1.05, 1.37). Findings for glioma were similar. Case correlations were different from control correlations stratified on time before diagnosis. Five years or less before diagnosis, correlations among case serum proteins were weaker than were those among controls. Our findings suggest that IL4 and sIL4RA reduce glioma risk long before diagnosis and early gliomagenesis affects circulating immune function proteins.


Conflict of interest statement

Competing Interests: Ruo-Pan Huang and Brett Burkholder are employed by RayBiotech, Inc. and Adam Brandemihl by Buckeye Psychiatry. There are no patents, products in development or marketed products to declare. This does not alter the authors' adherence to all the PLOS ONE policies on sharing data and materials, as detailed online in the guide for authors.

Figures

Fig 1
Fig 1. Association between IL4 and sIL4RA among glioma cases and controls (Observations more than three standard deviations from the mean are excluded).
Graph on left shows the association among glioma controls (n = 482); graph on right shows the association among glioma cases (n = 474).
Fig 2
Fig 2. Glioma Case and Control Serum Protein Pearson Correlation Matrices ≤ 5 Years before Diagnosis.
The top graph shows case correlations, the bottom graph shows control correlations. Color scale: blue = negative correlations, green, yellow = moderate correlations, red = positive correlations.
Fig 3
Fig 3. Glioma Case and Control Serum Protein Pearson Correlation Matrices > 15 Years before Diagnosis.
The top graph shows case correlations, the bottom graph shows control correlations. Color scale: blue = negative correlations, green, yellow = moderate correlations, red = positive correlations.
Fig 4
Fig 4. Absolute difference between glioma case and control correlation coefficients.
Lighter colors indicate larger absolute differences between case and control correlation coefficients. Top graph represents glioma cases and controls whose blood was drawn ≤ 5 years before diagnosis (n = 55 cases, 55 controls). Bottom graph represents glioma cases and controls whose blood was drawn > 15 years before diagnosis (n = 228 cases and 230 controls).

Similar articles

Cited by

References

    1. Koshy M, Villano JL, Dolecek TA, Villano JL, Howard A, Mahmood U, et al. Improved survival time trends for glioblastoma using the SEER 17 population-based registries. J Neurooncol 2012;107:207–12. 10.1007/s11060-011-0738-7 - DOI - PMC - PubMed
    1. Zhao H, Cai W, Su S, Zhi D, Lu J, Liu S. Allergic conditions reduce the risk of glioma: a meta-analysis based on 128,936 subjects. Tumour biology: the journal of the International Society for Oncodevelopmental Biology and Medicine. 2013. Epub 2013/12/19. 10.1007/s13277-013-1514-4 . - DOI - PubMed
    1. Schwartzbaum J, Ding B, Johannesen TB, Osnes LT, Karavodin L, Ahlbom A, et al. Association between prediagnostic IgE levels and risk of glioma. J Natl Cancer Inst. 2012;104(16):1251–9. Epub 2012/08/03. djs315 [pii] 10.1093/jnci/djs315 - DOI - PMC - PubMed
    1. Wei J, Barr J, Kong LY, Wang Y, Wu A, Sharma AK, et al. Glioma-associated cancer-initiating cells induce immunosuppression. Clin Cancer Res. 2010;16(2):461–73. Epub 2010/01/14. 10.1158/1078-0432.CCR-09-1983 - DOI - PMC - PubMed
    1. Zhu VF, Yang J, Lebrun DG, Li M. Understanding the role of cytokines in Glioblastoma Multiforme pathogenesis. Cancer Lett. 2012;316(2):139–50. Epub 2011/11/15. 10.1016/j.canlet.2011.11.001 . - DOI - PubMed

Publication types