. 2016 Jan;64(1):21-34.
doi: 10.1002/glia.22900. Epub 2015 Sep 9.

Characterization of glucose-related metabolic pathways in differentiated rat oligodendrocyte lineage cells

Affiliations

Characterization of glucose-related metabolic pathways in differentiated rat oligodendrocyte lineage cells

Ana I Amaral et al. Glia. 2016 Jan.

Abstract

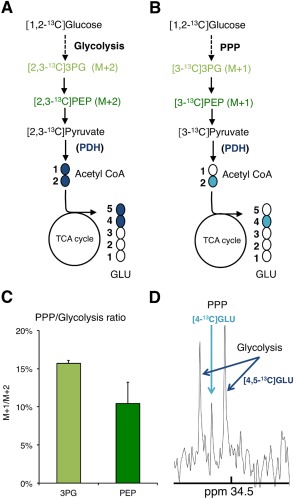
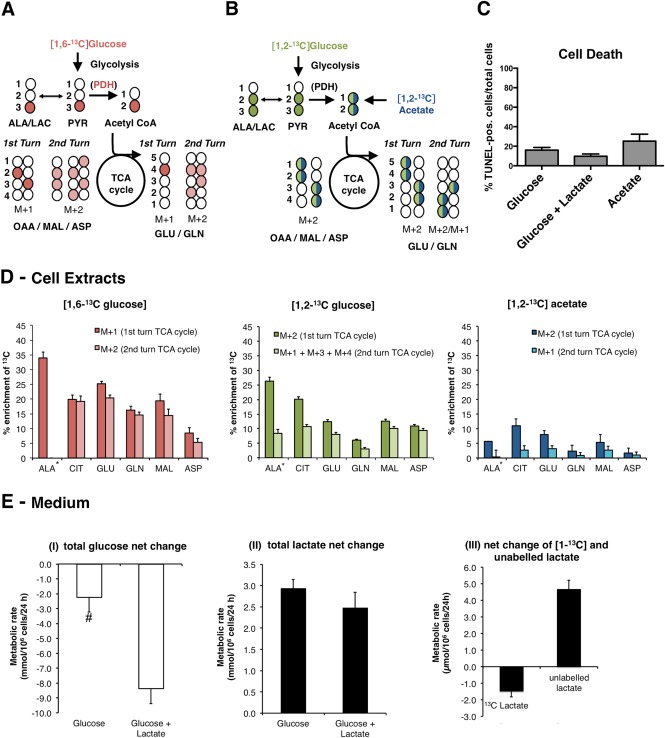
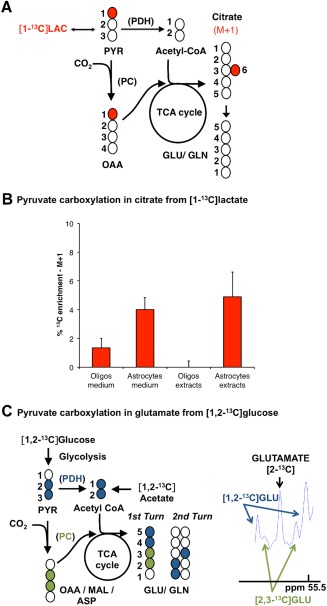
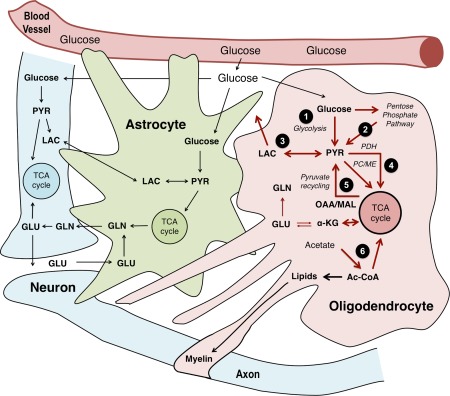
Although oligodendrocytes constitute a significant proportion of cells in the central nervous system (CNS), little is known about their intermediary metabolism. We have, therefore, characterized metabolic functions of primary oligodendrocyte precursor cell cultures at late stages of differentiation using isotope-labelled metabolites. We report that differentiated oligodendrocyte lineage cells avidly metabolize glucose in the cytosol and pyruvate derived from glucose in the mitochondria. The labelling patterns of metabolites obtained after incubation with [1,2-(13)C]glucose demonstrated that the pentose phosphate pathway (PPP) is highly active in oligodendrocytes (approximately 10% of glucose is metabolized via the PPP as indicated by labelling patterns in phosphoenolpyruvate). Mass spectrometry and magnetic resonance spectroscopy analyses of metabolites after incubation of cells with [1-(13)C]lactate or [1,2-(13)C]glucose, respectively, demonstrated that anaplerotic pyruvate carboxylation, which was thought to be exclusive to astrocytes, is also active in oligodendrocytes. Using [1,2-(13)C]acetate, we show that oligodendrocytes convert acetate into acetyl CoA which is metabolized in the tricarboxylic acid cycle. Analysis of labelling patterns of alanine after incubation of cells with [1,2-(13)C]acetate and [1,2-(13)C]glucose showed catabolic oxidation of malate or oxaloacetate. In conclusion, we report that oligodendrocyte lineage cells at late differentiation stages are metabolically highly active cells that are likely to contribute considerably to the metabolic activity of the CNS.

Keywords: 13C; acetate; energy metabolism; glucose; glycolysis; mitochondria; oligodendroglia; pyruvate carboxylation.


Figures

Figure 1
Figure 1
Purity of the primary cultures of rat oligodendrocytes. Oligodendrocyte precursor cells were isolated from mixed glia cultures and cultured in Sato's medium + 0.05% FCS to induce differentiation. At day 1 of differentiation, more than 93% of the cells expressed the oligodendroglial lineage marker O4 (A) and at 5 days of differentiation, approximately 65% of the cells expressed myelin basic protein (MBP), a marker of mature oligodendrocytes (B). Scale bars, 50 µm. [Color figure can be viewed in the online issue, which is available at wileyonlinelibrary.com.]
Figure 2
Figure 2
Evidence of pentose phosphate pathway (PPP) activity in mature oligodendrocytes in culture after incubation with [1,2‐13C]glucose. Labelling patterns derived from [1,2‐13C]glucose metabolism via glycolysis (A) and the PPP (B). The % enrichment of 13C in M+1 and M+2 isotopologues for 3PG and PEP was determined using GC–MS analysis of cell extracts after 24‐h incubation with [1,2‐13C]glucose. The ratio shown in (C) between M+1 (labelling from the PPP) and M+2 (labelling from glycolysis) enables to estimate the contribution of the PPP versus glycolysis to the formation of the glycolytic intermediates 3PG and PEP in mature oligodendrocyte (mean ± s.e.m.; n = 3). (D) 13C nuclear magnetic resonance spectrum of a cell extract from cultures incubated in medium containing [1,2‐13C]glucose for 24 h. The C‐4 region of glutamate at 34.5 ppm (GLU) is shown. The doublet peak represents [4,5‐13C]glutamate ([4,5‐13C]GLU) which derives from glucose metabolism via glycolysis only. The singlet peak corresponds to [4‐13C]glutamate ([4‐13C]GLU) which is produced after glucose metabolism via the PPP. Abbreviations: 3PG, 3‐phosphoglycerate; GLU, glutamate; PEP, phosphoenolpyruvate; PDH, pyruvate dehydrogenase; M+1, parent ion with one 13C atom; M+2, parent ion with two 13C atoms. [Color figure can be viewed in the online issue, which is available at wileyonlinelibrary.com.]
Figure 3
Figure 3
Evidence of high TCA cycle activity and acetate metabolism in mature oligodendrocytes in culture. Oligodendrocytes were differentiated for 5 days and incubated for 24 h in medium containing [1,6‐13C]glucose (A), [1,2‐13C]glucose (B), or [1,2‐13C]acetate (B), followed by GC–MS analysis of samples of cell culture medium and cell extracts. A and B describe the labelling patterns deriving from the metabolism of these 13C‐labelled substrates. The isotopologues formed in the second turn of the TCA cycle result from condensation of labelled oxaloacetate (OAA) with labelled or unlabelled acetyl CoA. (C) Quantification of TUNEL positive/total cell number (given by DAPI staining) in cells incubated with glucose alone (mean ± s.e.m., n = 12), glucose and lactate (mean ± s.e.m., n = 10), or acetate (mean ± s.e.m., n = 8); (D) % enrichment of 13C in intracellular alanine and TCA cycle‐related metabolites derived from each of the substrates (mean ± s.e.m., n = 8 for [1,6‐13C]glucose, mean ± s.e.m., n = 6 for [1,2‐13C]glucose and mean ± s.e.m., n = 12 for [1,2‐13C]acetate). (E) Glucose (I) and lactate (II) net change in the medium in experiments performed in the presence of glucose alone or glucose + [1‐13C]lactate. For the experiment where [1‐13C]lactate was used, the net change of 13C‐labelled and unlabelled lactate is shown (III) (mean ± s.e.m., n = 9). #—significantly different from the glucose + [1‐13C]lactate group (P < 0.05, Student's t‐test). Abbreviations: ALA, alanine; ASP, aspartate; CIT, citrate; GLN, glutamine; GLU, glutamate; MAL, malate; PYR, pyruvate; M+1, parent ion with one 13C atom; M+2, parent ion with two 13C atoms; M+3, parent ion with three 13C atoms; M+4, parent ion with four 13C atoms. *The enrichment detected in alanine derives directly from 13C‐labelled pyruvate and not from the TCA cycle when [1,6‐13C]glucose is the precursor. When [1,2‐13C]glucose is used, M+2 is not derived from the TCA cycle but M+1 alanine is. When [1,2‐13C]acetate is in the medium, both alanine isotopologues are derived from the TCA cycle. [Color figure can be viewed in the online issue, which is available at wileyonlinelibrary.com.]
Figure 4
Figure 4
[1‐13C]lactate metabolism and evidence for pyruvate carboxylation in oligodendrocytes. (A) Labelling patterns resulting from the metabolism of [1‐13C]lactate (13C atoms are identified as filled circles): [1‐13C]lactate (LAC) is converted into [1‐13C]pyruvate, which can be converted into acetyl CoA via PDH or into [1‐13C]oxaloacetate (OAA) via pyruvate carboxylase (PC). The first carbon of pyruvate is lost in its conversion to acetyl CoA via PDH. Therefore, the 13C label can only be observed downstream of pyruvate if PC is active. [1‐13C]oxaloacetate can condense with acetyl CoA to form [6‐13C]citrate, which also leads subsequently to the formation of unlabelled α‐ketoglutarate by loss of carbon 6. (B) The % enrichment of 13C in citrate indicates the contribution of pyruvate carboxylation to citrate formation from [1‐13C]lactate. The % of M+1 citrate was assessed using GC–MS in samples of cell extracts and culture medium from differentiated oligodendrocytes and also in cultures of cortical astrocytes after 24 h of incubation with [1‐13C]lactate (oligodendrocytes—mean ± s.e.m., n = 9; and astrocytes—mean ± s.e.m., n = 6). (C) Contribution of pyruvate carboxylation to glutamate synthesis from [1,2‐13C]glucose. Oligodendrocytes were incubated in medium containing [1,2‐13C]glucose for 24 h, extracted, and analyzed using 13C‐magnetic resonance spectroscopy for the presence of isotopologues of glutamate formed via pyruvate carboxylation. The C‐2 region of glutamate (GLU) at 55.5 ppm is shown. The doublet representing [2,3‐13C]glutamate is formed via pyruvate carboxylation and the doublet representing [1,2‐13C]glutamate is formed via pyruvate dehydrogenation. Abbreviations: ASP, aspartate; GLN, glutamine; GLU, glutamate; MAL, malate; OAA, oxaloacetate; PC, pyruvate carboxylase; PDH, pyruvate dehydrogenase; PYR, pyruvate. [Color figure can be viewed in the online issue, which is available at wileyonlinelibrary.com.]
Figure 5
Figure 5
Integration of metabolic pathways operating in oligodendrocytes in the context of metabolic interactions with astrocytes and neurons/axons. The pathways investigated in this study are highlighted in red in the oligodendrocyte: glucose is taken up and subsequently metabolized either via glycolysis only (1) or also via the pentose phosphate pathway (2); the resulting pyruvate (PYR) produced can be reduced to lactate (LAC) (3) which can be released and taken up by cells with lower lactate concentration. Moreover, pyruvate can be carboxylated via PC or malic enzyme (ME) into oxaloacetate (OAA) or malate (MAL) or enter the TCA cycle after being converted to acetyl CoA (Ac‐CoA) via PDH (4). The TCA cycle intermediate α‐ketoglutarate (α‐KG) gives rise to glutamate (GLU) and, subsequently, glutamine (GLN), but none of these aminoacids appear to be significantly released. Pyruvate can be further completely oxidized if it is decarboxylated via ME, a pathway called pyruvate recycling (5), which also seems to be present in this cell type. Oligodendrocytes can also metabolize acetate into acetyl CoA (6) that can be then incorporated into lipids or oxidized in the TCA cycle. [Color figure can be viewed in the online issue, which is available at wileyonlinelibrary.com.]

References

    1. Almeida A, Delgado‐Esteban M, Bolanos JP, Medina JM. 2002. Oxygen and glucose deprivation induces mitochondrial dysfunction and oxidative stress in neurones but not in astrocytes in primary culture. J Neurochem 81:207–217. - PubMed
    1. Amaral AI, Alves PM, Teixeira AP. 2014. Metabolic fux analysis tools to investigate brain metabolism in vitro In: Hirrlinger J, Waagepertersen HS, editor. Brain energy metabolism. New York: Humana Press; pp 107–144.
    1. Amaral AI, Meisingset TW, Kotter MR, Sonnewald U. 2013. Metabolic aspects of neuron‐oligodendrocyte‐astrocyte interactions. Front Endocrinol (Lausanne) 4:54 - PMC - PubMed
    1. Amaral AI, Teixeira AP, Haakonsen BI, Sonnewald U, Alves AM. 2011a. A comprehensive metabolic profile of cultured astrocytes using isotopic transient metabolic flux analysis and 13C‐labeled glucose. Front Neuroenerg 3:5 - PMC - PubMed
    1. Amaral AI, Teixeira AP, Martens S, Bernal V, Sousa MFQ, Alves PM. 2010. Metabolic alterations induced by ischemia in primary cultures of astrocytes: Merging 13C NMR spectroscopy and metabolic flux analysis. J Neurochem 113:735–748. - PubMed

Publication types

MeSH terms