

Intrahepatic Transcriptional Signature Associated with Response to Interferon-α Treatment in the Woodchuck Model of Chronic Hepatitis B
- PMID: 26352406
- PMCID: PMC4564242
- DOI: 10.1371/journal.ppat.1005103
Intrahepatic Transcriptional Signature Associated with Response to Interferon-α Treatment in the Woodchuck Model of Chronic Hepatitis B
Erratum in
-
Correction: Intrahepatic Transcriptional Signature Associated with Response to Interferon-α Treatment in the Woodchuck Model of Chronic Hepatitis B.PLoS Pathog. 2016 Mar 29;12(3):e1005541. doi: 10.1371/journal.ppat.1005541. eCollection 2016 Mar. PLoS Pathog. 2016. PMID: 27022978 Free PMC article. No abstract available.
Abstract
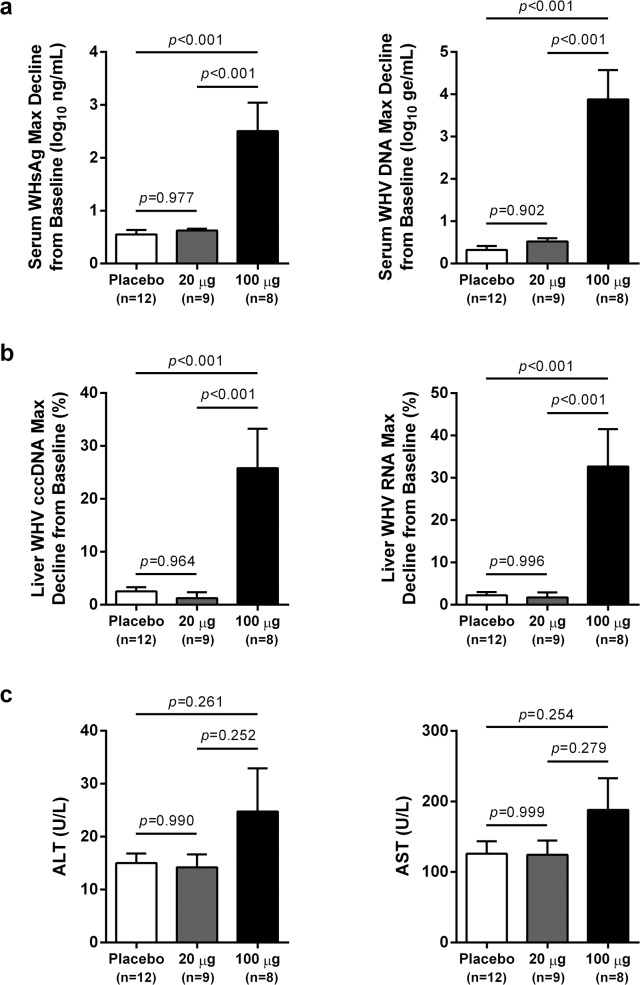
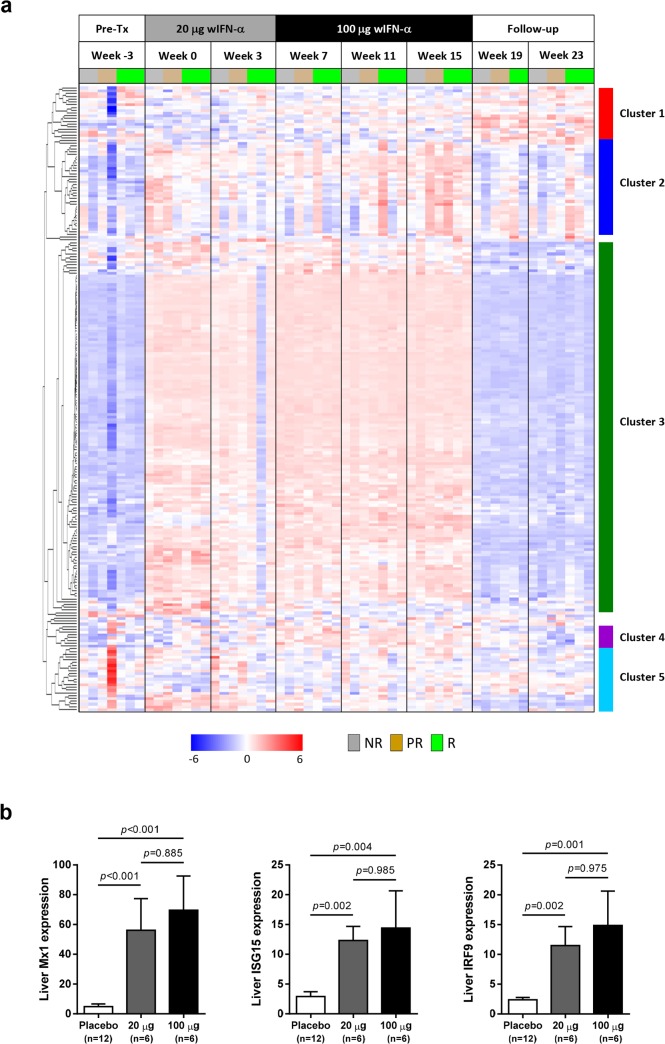
Recombinant interferon-alpha (IFN-α) is an approved therapy for chronic hepatitis B (CHB), but the molecular basis of treatment response remains to be determined. The woodchuck model of chronic hepatitis B virus (HBV) infection displays many characteristics of human disease and has been extensively used to evaluate antiviral therapeutics. In this study, woodchucks with chronic woodchuck hepatitis virus (WHV) infection were treated with recombinant woodchuck IFN-α (wIFN-α) or placebo (n = 12/group) for 15 weeks. Treatment with wIFN-α strongly reduced viral markers in the serum and liver in a subset of animals, with viral rebound typically being observed following cessation of treatment. To define the intrahepatic cellular and molecular characteristics of the antiviral response to wIFN-α, we characterized the transcriptional profiles of liver biopsies taken from animals (n = 8-12/group) at various times during the study. Unexpectedly, this revealed that the antiviral response to treatment did not correlate with intrahepatic induction of the majority of IFN-stimulated genes (ISGs) by wIFN-α. Instead, treatment response was associated with the induction of an NK/T cell signature in the liver, as well as an intrahepatic IFN-γ transcriptional response and elevation of liver injury biomarkers. Collectively, these data suggest that NK/T cell cytolytic and non-cytolytic mechanisms mediate the antiviral response to wIFN-α treatment. In summary, by studying recombinant IFN-α in a fully immunocompetent animal model of CHB, we determined that the immunomodulatory effects, but not the direct antiviral activity, of this pleiotropic cytokine are most closely correlated with treatment response. This has important implications for the rational design of new therapeutics for the treatment of CHB.
Conflict of interest statement
I have read the journal's policy and the authors of this manuscript have the following competing interests: SPF, DJC, LG, HB, ER, PR, DCS, FB, RS, SHL, EK, JC, MT are/were employees of Hoffmann-La Roche, Inc. (
Figures


Similar articles
-
Helper-dependent adenoviral vector-mediated delivery of woodchuck-specific genes for alpha interferon (IFN-alpha) and IFN-gamma: IFN-alpha but not IFN-gamma reduces woodchuck hepatitis virus replication in chronic infection in vivo.J Virol. 2004 Sep;78(18):10111-21. doi: 10.1128/JVI.78.18.10111-10121.2004. J Virol. 2004. PMID: 15331744 Free PMC article.
-
Woodchuck gamma interferon upregulates major histocompatibility complex class I transcription but is unable to deplete woodchuck hepatitis virus replication intermediates and RNAs in persistently infected woodchuck primary hepatocytes.J Virol. 2002 Jan;76(1):58-67. doi: 10.1128/jvi.76.1.58-67.2002. J Virol. 2002. PMID: 11739671 Free PMC article.
-
Innate and adaptive immunity associated with resolution of acute woodchuck hepatitis virus infection in adult woodchucks.PLoS Pathog. 2019 Dec 23;15(12):e1008248. doi: 10.1371/journal.ppat.1008248. eCollection 2019 Dec. PLoS Pathog. 2019. PMID: 31869393 Free PMC article.
-
Diverse Virus and Host-Dependent Mechanisms Influence the Systemic and Intrahepatic Immune Responses in the Woodchuck Model of Hepatitis B.Front Immunol. 2020 May 27;11:853. doi: 10.3389/fimmu.2020.00853. eCollection 2020. Front Immunol. 2020. PMID: 32536912 Free PMC article. Review.
-
Immunomodulation as an option for the treatment of chronic hepatitis B virus infection: preclinical studies in the woodchuck model.Expert Opin Investig Drugs. 2007 Jun;16(6):787-801. doi: 10.1517/13543784.16.6.787. Expert Opin Investig Drugs. 2007. PMID: 17501692 Review.
Cited by
-
The Genome Sequence of the Eastern Woodchuck (Marmota monax) - A Preclinical Animal Model for Chronic Hepatitis B.G3 (Bethesda). 2019 Dec 3;9(12):3943-3952. doi: 10.1534/g3.119.400413. G3 (Bethesda). 2019. PMID: 31645421 Free PMC article.
-
Recent Drug Development in the Woodchuck Model of Chronic Hepatitis B.Viruses. 2022 Aug 3;14(8):1711. doi: 10.3390/v14081711. Viruses. 2022. PMID: 36016334 Free PMC article. Review.
-
Interferon Alpha Induces Sustained Changes in NK Cell Responsiveness to Hepatitis B Viral Load Suppression In Vivo.PLoS Pathog. 2016 Aug 3;12(8):e1005788. doi: 10.1371/journal.ppat.1005788. eCollection 2016 Aug. PLoS Pathog. 2016. PMID: 27487232 Free PMC article. Clinical Trial.
-
Diversification of mammalian deltaviruses by host shifting.Proc Natl Acad Sci U S A. 2021 Jan 19;118(3):e2019907118. doi: 10.1073/pnas.2019907118. Proc Natl Acad Sci U S A. 2021. PMID: 33397804 Free PMC article.
-
Woodchuck Hepatic Anatomy and Vascular Alterations Due to Hepatocellular Carcinoma with Angiographic Atlas of the Abdomen and Pelvis.J Vasc Interv Radiol. 2022 Mar;33(3):316-323.e4. doi: 10.1016/j.jvir.2021.11.005. Epub 2021 Nov 17. J Vasc Interv Radiol. 2022. PMID: 34800622 Free PMC article.
References
-
- Lavanchy D (2004) Hepatitis B virus epidemiology, disease burden, treatment, and current and emerging prevention and control measures. J Viral Hepat 11: 97–107. - PubMed
Publication types
MeSH terms
Substances
Associated data
- Actions
Grants and funding
LinkOut - more resources
Full Text Sources
Other Literature Sources
Molecular Biology Databases
