. 2015 Sep 24;525(7570):486-90.
doi: 10.1038/nature15368. Epub 2015 Sep 9.

Structure of the toxic core of α-synuclein from invisible crystals

Affiliations

Structure of the toxic core of α-synuclein from invisible crystals

Jose A Rodriguez et al. Nature. .

Abstract

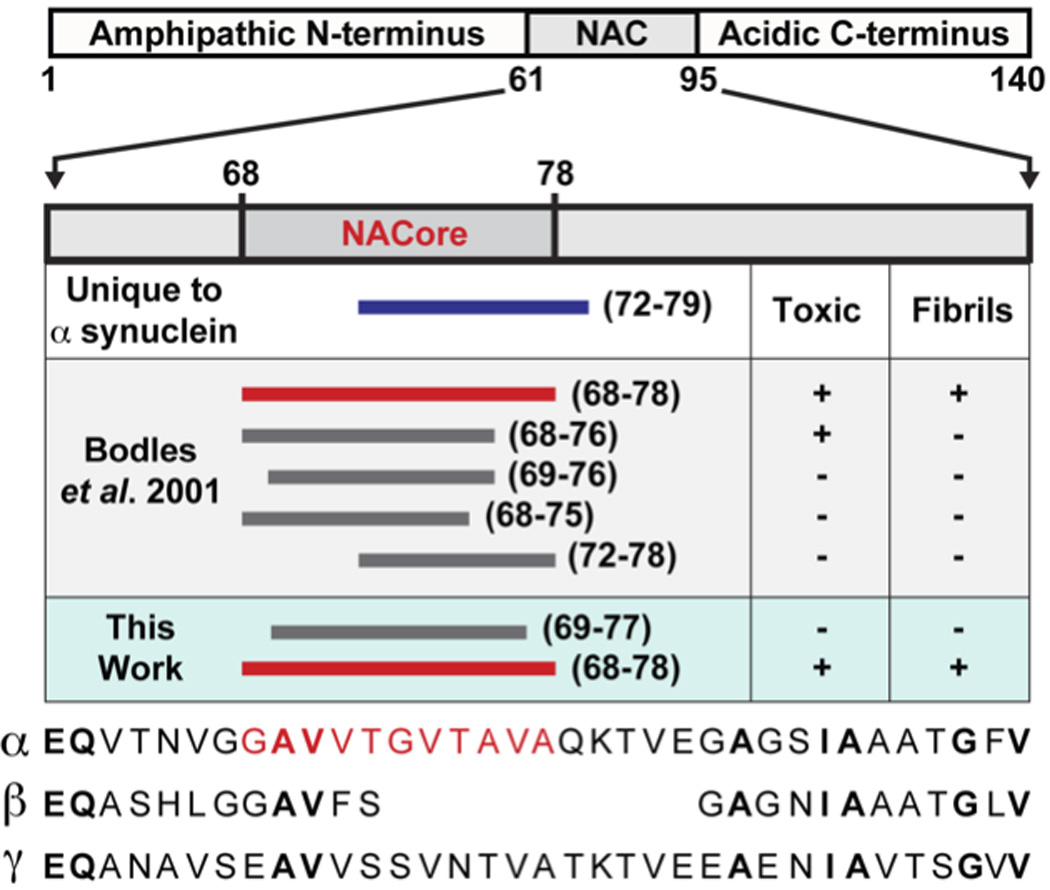
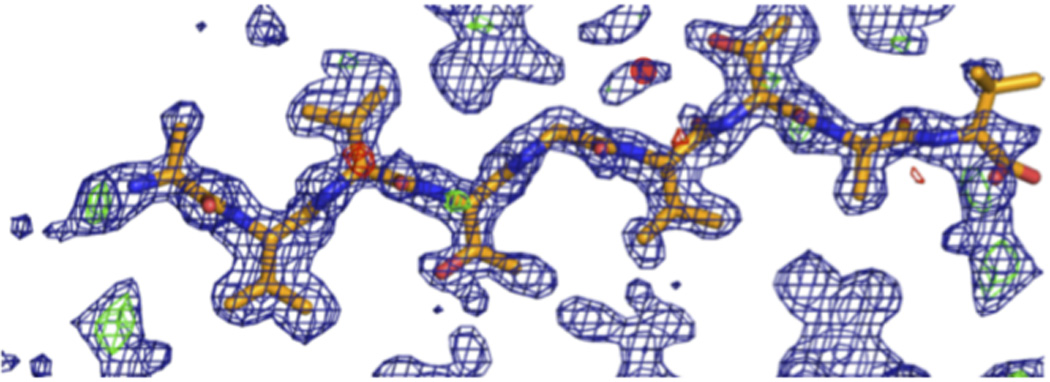
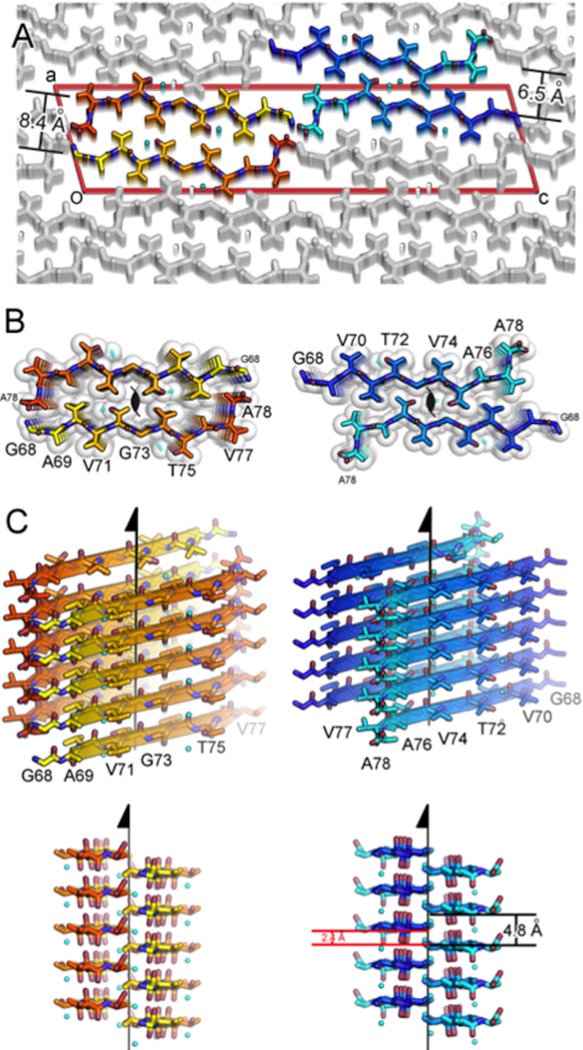
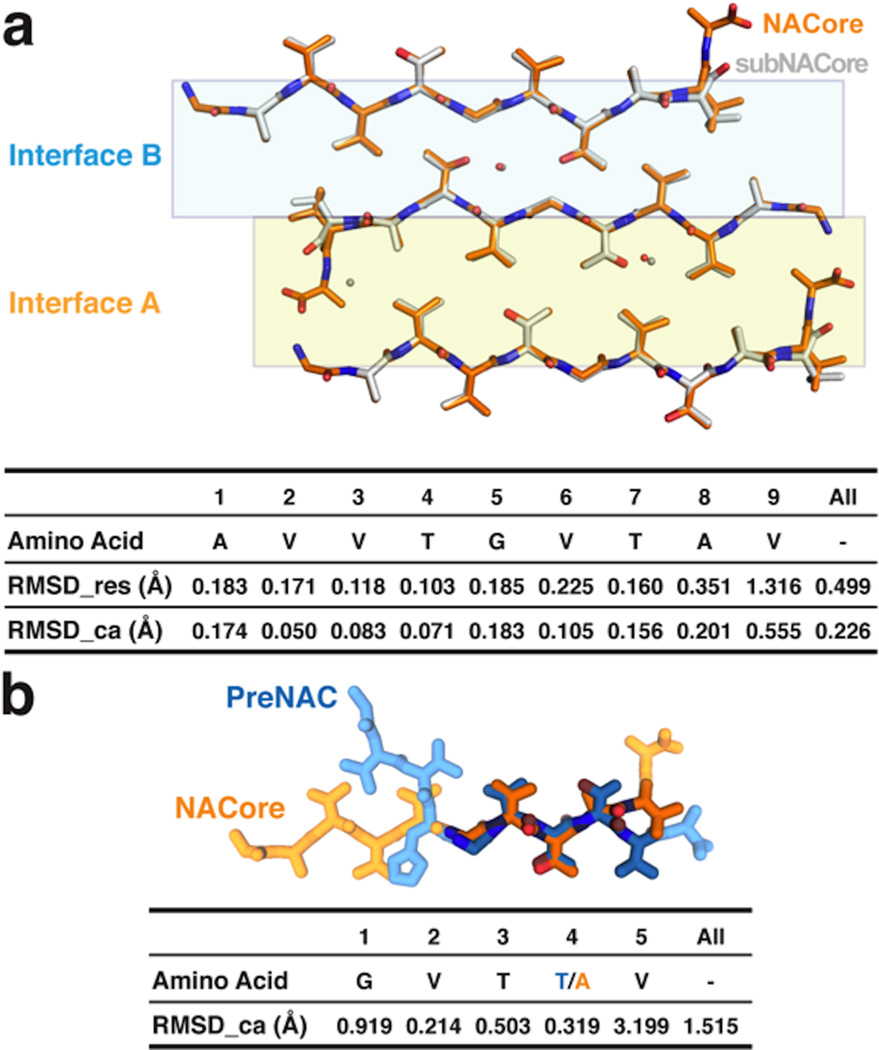
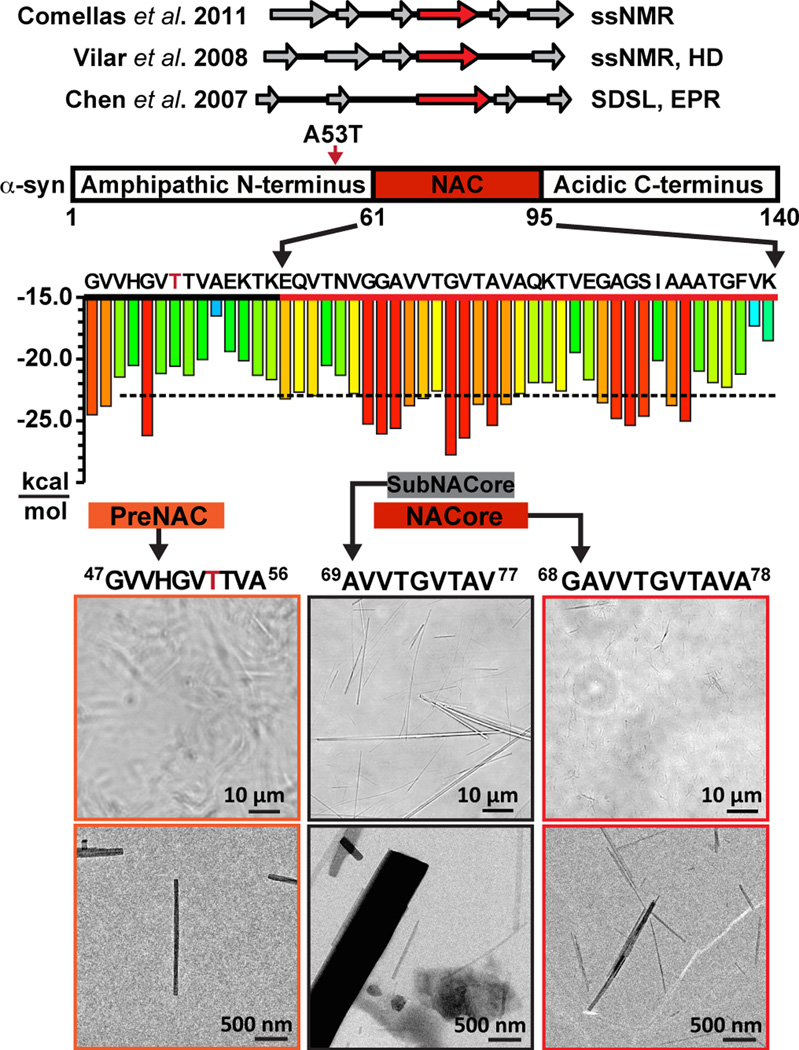
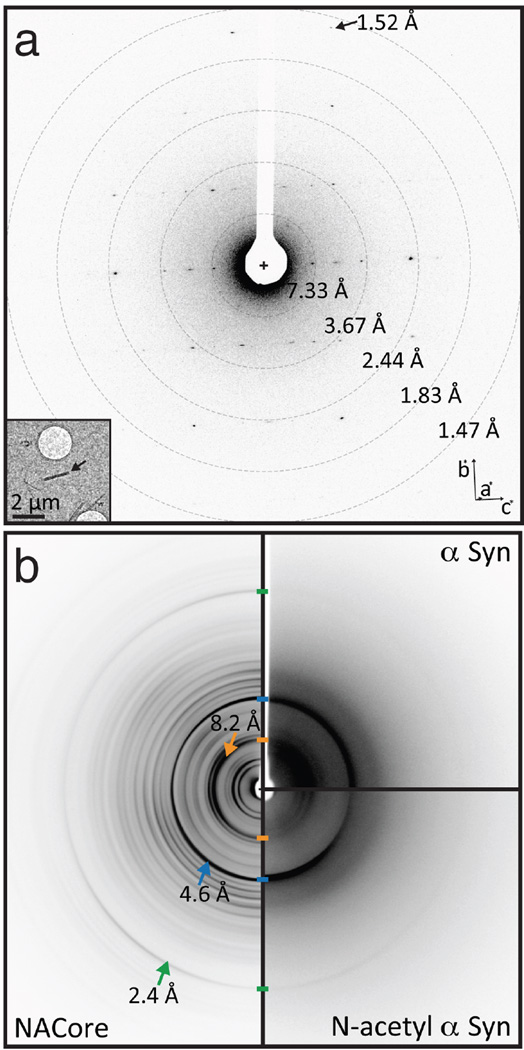
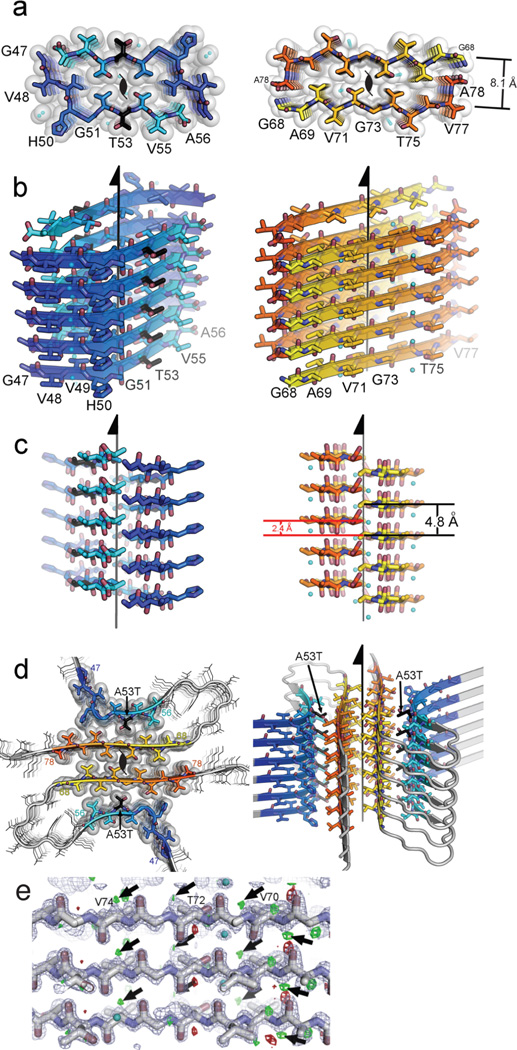
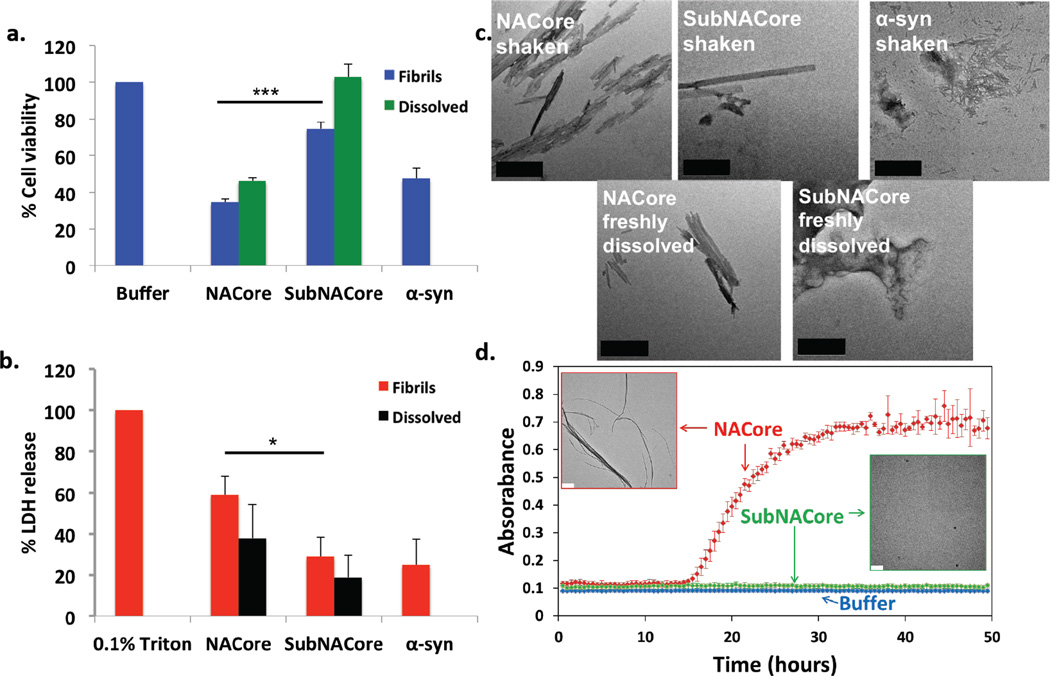
The protein α-synuclein is the main component of Lewy bodies, the neuron-associated aggregates seen in Parkinson disease and other neurodegenerative pathologies. An 11-residue segment, which we term NACore, appears to be responsible for amyloid formation and cytotoxicity of human α-synuclein. Here we describe crystals of NACore that have dimensions smaller than the wavelength of visible light and thus are invisible by optical microscopy. As the crystals are thousands of times too small for structure determination by synchrotron X-ray diffraction, we use micro-electron diffraction to determine the structure at atomic resolution. The 1.4 Å resolution structure demonstrates that this method can determine previously unknown protein structures and here yields, to our knowledge, the highest resolution achieved by any cryo-electron microscopy method to date. The structure exhibits protofibrils built of pairs of face-to-face β-sheets. X-ray fibre diffraction patterns show the similarity of NACore to toxic fibrils of full-length α-synuclein. The NACore structure, together with that of a second segment, inspires a model for most of the ordered portion of the toxic, full-length α-synuclein fibril, presenting opportunities for the design of inhibitors of α-synuclein fibrils.


Figures

Extended Data Figure 1
A schematic representation of α-syn, highlighting the NAC region (residues 61–95) and within it the NACore sequence (residues 68–78). A series of bars span regions of α-syn that are of interest to this work. Among the three synuclein paralogs (α, β, and γ), the region whose sequence is unique to α-syn is shown as a blue bar (residues 72–83) that overlaps with a large portion of NACore. Segments investigated by Bodles et al. are also shown. These span a variety of regions within NACore. Two of the segments we now investigate, SubNACore and NACore, are shown in this context. Only one of the segments studied by Bodles et al. is an exact match to our NACore sequence, and only this segment is both toxic and fibrillar. The sequences of α-synuclein, β-synuclein, and γ-synuclein are shown as a reference with conserved residues in bold and the NACore sequence in red.
Extended Data Figure 2
Difference density maps calculated after successful molecular replacement using the SubNACore search model clearly revealed the positions of the missing residues (positive Fo-Fc density at N and C termini corresponding to G68 and A78) and one water molecule near a threonine side chain (red circle); a second water was located during the refinement process. The blue mesh represents 2Fo-Fc density contoured at 1.2 σ level. The green and red mesh represent Fo-Fc density contoured at 3.0 and −3.0 σ, respectively. All maps were σa-weighted.
Extended Data Figure 3
The crystal structure of NACore reveals pairs of sheets as in the spines of amyloid fibrils. a, NACore’s two types of sheet-sheet interfaces: a larger interface (orange, 268 Å2 of buried accessible surface area per chain) we call interface A, and a weaker interface (blue, 167 Å2) we call interface B. The crystal is viewed along the hydrogen-bonding direction (crystal “b” dimension). The red lines outline the unit cell. b, The van der Waals packing between sheets.The sheets are related by a 21 screw axis denoted in black. The only gaps left by the interface are filled with water molcules which hydrogen-bond to the threonine residues (partly showing aqua spheres). The shape complementarity of both interfaces is 0.7. The viewing direction is the same as in a. c, Orthogonal view of the fibrillar assembly. The protofibril axis, coinciding with the 21 screw axis designated by the arrow, runs vertically between the pairs of sheets.
Extended Data Figure 4
a, Comparison of the crystal packing for NACore (orange chain) and SubNACore (white chain). The face-to-face interactions are virtually the same for the pairs of NACore peptides in its crystal structure and the SubNACore peptides in its structure (A and B shown in gold and blue, respectively). The table below shows a pairwise the RMSD comparing the nine residues shared in common between the structures. RMSD_res is an all-atom comparison between residue pairs, while RMSD_ca compares only alpha carbon pairs. b, PreNAC (blue) is compared with NACore (orange). Five residues from each strand are shown in darker color and the RMS deviations between their alpha carbon pairs compared in the table below. Therefore the PreNAC-NACore interaction mimics weaker Interface B in the NACore structure.
Extended Data Figure 5
Intense reflections common among the NACore and the two polymorphs of full length α-syn suggest common structural features. These features are illustrated here on the crystal packing diagrams of NACore. The (0,0,2) planes approximate the separation between sheets in interface A (orange). The (0,2,0), (−1,1,1), and (1,1,1) reflections are intense because the corresponding Bragg planes recapitulate the staggering of strands from opposing sheets. The red lines correspond to the unit cell boundaries and all planes are shown in black.
Extended Data Figure 6
Mass spectrometry analysis of recombinantly expressed, full length α-syn, with and without N-terminal acetylation The mass profile of wild-type full length α-syn (left) is compared to that of an N-terminally acetylated form of the protein (right). The mass shift for the N-terminally acetylated form is appropriately shifted with respect to the native form of the protein (14464.0 Da for alpha-synuclein and 14506.0 for acetylated alpha-synuclein), within a margin of error of 4 Da.
Figure 1
Figure 1
NACore (residues 68–78) is the fibril-forming core of the NAC domain of full-length α-syn. Top: beta strands indicated byNMR and EPR,,. Center: red 6-residue segments are predicted to form amyloid fibrils. The A53T early-onset Parkinson mutation is indicated by a red arrow and red letter T. Bottom: the miniscule size of the preNAC and NACore crystals used for MicroED is illustrated by this comparison to SubNACore microcrystals (middle. Scale comparisons are illustrated on two magnifications using phase contrast light microscope images and electron micrographs, in which individual NACore and PreNAC nanocrystals are indistinguishable by light microscopy.
Figure 2
Figure 2
Diffraction from NACore nano crystals is similar to that from full length α-syn fibrils. a, Single crystal electron diffraction pattern obtained duringMicroED data collection (see text). Equally spaced concentric rings denote resolution shells. An arrow points to The highest resolution spot is at 1.52 Å (arrow). The inset shows the overfocused image of the diffracting crystal (arrow), which is ~1480 × 200 × 200 nm. b, Composite of fibril diffraction patterns from α-syn preparations and NACore. Full-length α-syn reveals reflections that match those from NACore and N-terminally acetylated α-syn. The two patterns of full-length α-syn share with NACore three major peaks denoted by arrows: 8.2 Å (orange), 4.6 Å (blue), and 2.4 Å (green). The origin of these peaks can be traced to the (0 0 2), [(1,1,1),(−1 1 1)], and (0 2 0) planes in the NACore structure, respectively. The reflection at 8.2Å likely arises from adjacent pairs of β-sheets.
Figure 3
Figure 3
Structure of the amyloid core of α-syn. a, The crystal structure of NACore (orange) reveals pairs of sheets as in the spines of amyloid fibrils. The A53T mutation in PreNAC is shown in black. The sheets in both structures are related by the 21 fibril axes shown in black. The gaps left by the interface are filled with water molcules which hydrogen-bond to the threonine residues (partly showing aqua spheres). b, and c, are orthogonal views of the fibrillar assemblies. d, A speculative model of an α-syn protofibril containing the A53T mutation (black), where the strong interface of NACore (orange) forms the core of the fibril and its weaker interface interacts with PreNAC (blue). e, The locations of 5 out of a possible 73 protons are suggested by small, positive Fo-Fc density (green contoured at 2.8σ, shown by arrows.. The blue mesh is 2Fo-Fc density contoured at 1.4 σ.
Figure 4
Figure 4
NACore aggregates faster than SubNACore and is more cytotoxic to cultured cells. Cytotoxicity of NACore, SubNACore and α-syn measured on PC12 cells using a, MTT assay and b, LDH release assay. In both assays NACore is more toxic than SubNACore. Also, shaken fibrils are more toxic than an equal concentration of freshly dissolved sample. Results shown as mean ± standard error of the mean from triplicate samples. A t-test was used to measure statistical significance * <0.05, **<0.01,***<0.001. c, Representative electron micrographs of NACore, SubNACore and α-syn samples tested for cytotoxicity. NACore and α-syn show abundant fibrils but SubNACore few. NACore also forms fibrils immediately upon dissolving whereas SubNACore shows no fibers, but instead amorphous aggregates. Scale 500nm. d, NACore and SubNACore were aggregated in identical conditions and monitored by turbidity. NACore begins to aggregate in 15 hours while SubNACore forms no aggregates for up to 50 hours. Electron microscopy of the samples at 50 hours confirmed the turbidity readings (insets, scale 2 µm), with error bars denoting standard deviation from triplicates.

Comment in

  • Parkinson's disease: Crystals of a toxic core.
    Goedert M, Cheng Y. Goedert M, et al. Nature. 2015 Sep 24;525(7570):458-9. doi: 10.1038/nature15630. Epub 2015 Sep 9. Nature. 2015. PMID: 26352470 No abstract available.
  • Invisible Killers.
    Volpicelli-Daley LA, Standaert DG. Volpicelli-Daley LA, et al. Mov Disord. 2016 Jan;31(1):44. doi: 10.1002/mds.26465. Epub 2016 Jan 9. Mov Disord. 2016. PMID: 26748962 No abstract available.

References

    1. Spillantini MG, et al. Alpha-synuclein in Lewy bodies. Nature. 1997;388:839–840. - PubMed
    1. Goedert M, Spillantini MG, Del Tredici K, Braak H. 100 years of Lewy pathology. Nat. Rev. Neurol. 2013;9:13–24. - PubMed
    1. Polymeropoulos MH, et al. Mutation in the alpha-synuclein gene identified in families with Parkinson’s disease. Science. 1997;276:2045–2047. - PubMed
    1. Krüger R. Ala30Pro mutation in the gene encoding alpha-synuclein in Parkinson’s disease. Nat. Genet. 1998;18:106–108. - PubMed
    1. Zarranz JJ, et al. The new mutation, E46K, of alpha-synuclein causes Parkinson and Lewy body dementia. Ann. Neurol. 2004;55:164–173. - PubMed

Extended References

    1. Otwinowski Z, Minor W. In: Methods in Enzymology. Charles W, Carter J, editors. Vol. 276. Academic Press; 1997. pp. 307–326. - PubMed
    1. Weierstall U, Spence JCH, Doak RB. Injector for scattering measurements on fully solvated biospecies. Rev. Sci. Instrum. 2012;83:035108. - PubMed
    1. Hattne J, et al. Accurate macromolecular structures using minimal measurements from X-ray free-electron lasers. Nat. Methods. 2014;11:545–548. - PMC - PubMed
    1. Sauter NK, Hattne J, Grosse-Kunstleve RW, Echols N. New Python-based methods for data processing. Acta Crystallogr. D Biol. Crystallogr. 2013;69:1274–1282. - PMC - PubMed
    1. Kabsch W. XDS. Acta Crystallogr. D Biol. Crystallogr. 2010;66:125–132. - PMC - PubMed

Publication types