. 2015 Sep 24;525(7570):533-7.
doi: 10.1038/nature15365. Epub 2015 Sep 9.

Loss of Karma transposon methylation underlies the mantled somaclonal variant of oil palm

Affiliations

Loss of Karma transposon methylation underlies the mantled somaclonal variant of oil palm

Meilina Ong-Abdullah et al. Nature. .

Abstract

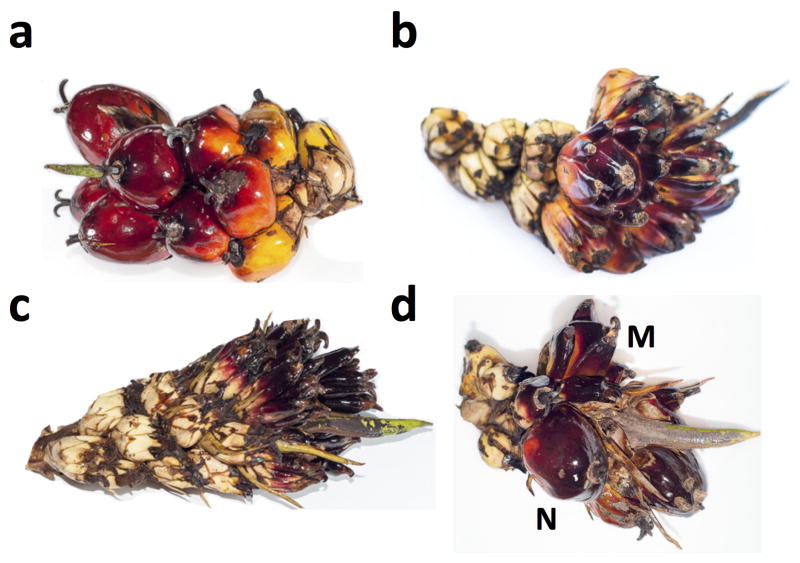
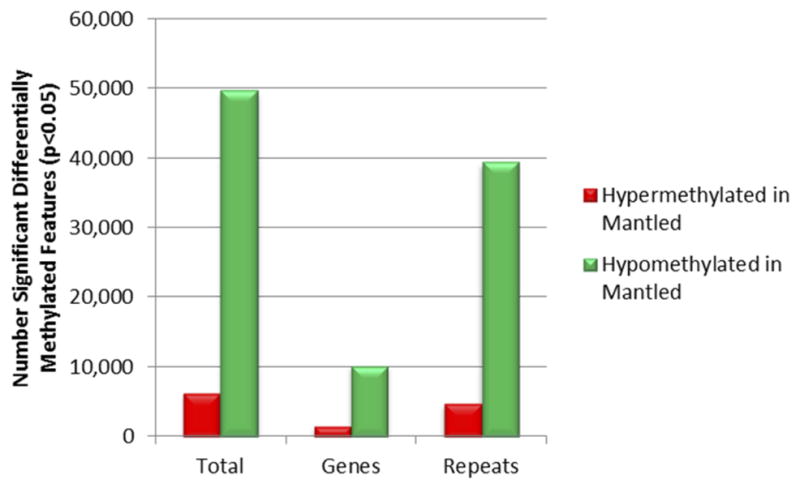
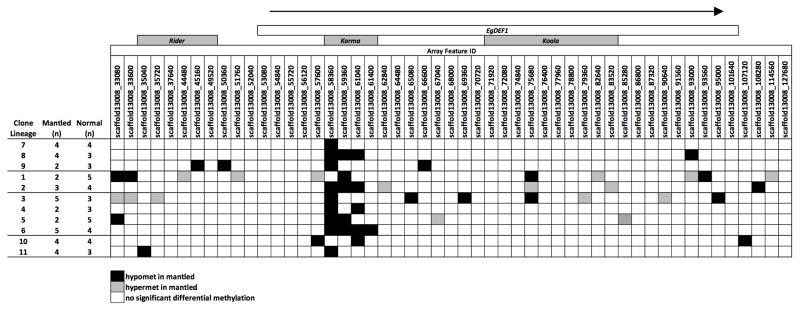
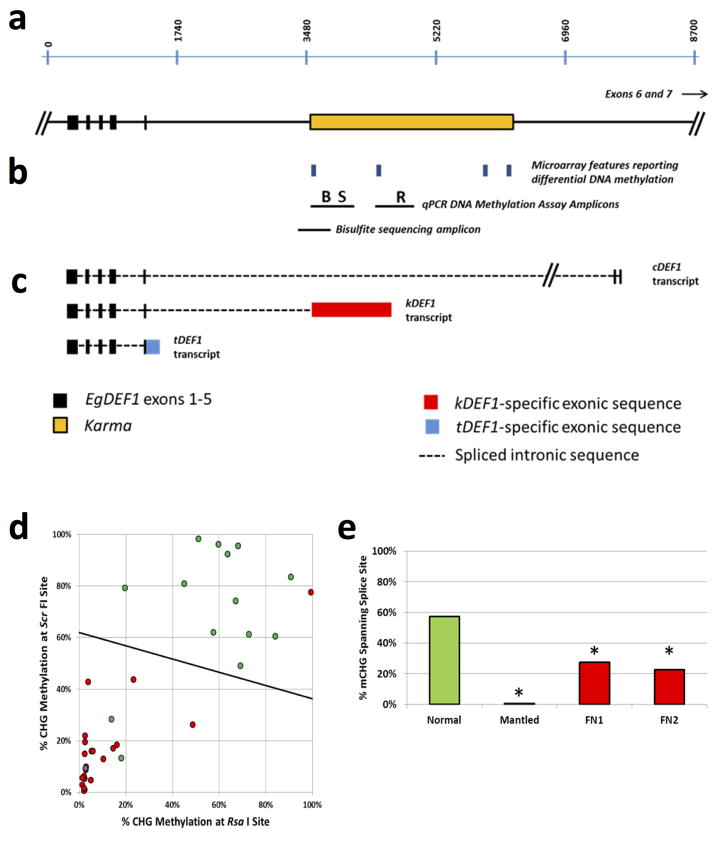
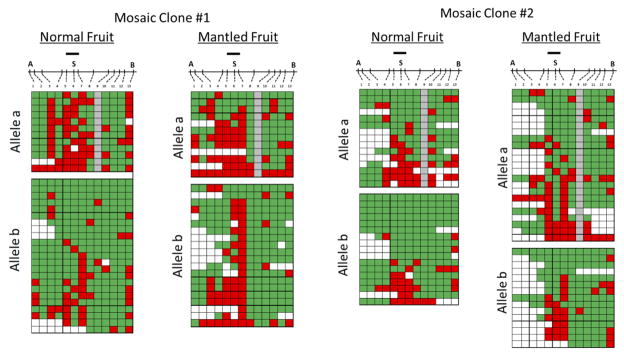
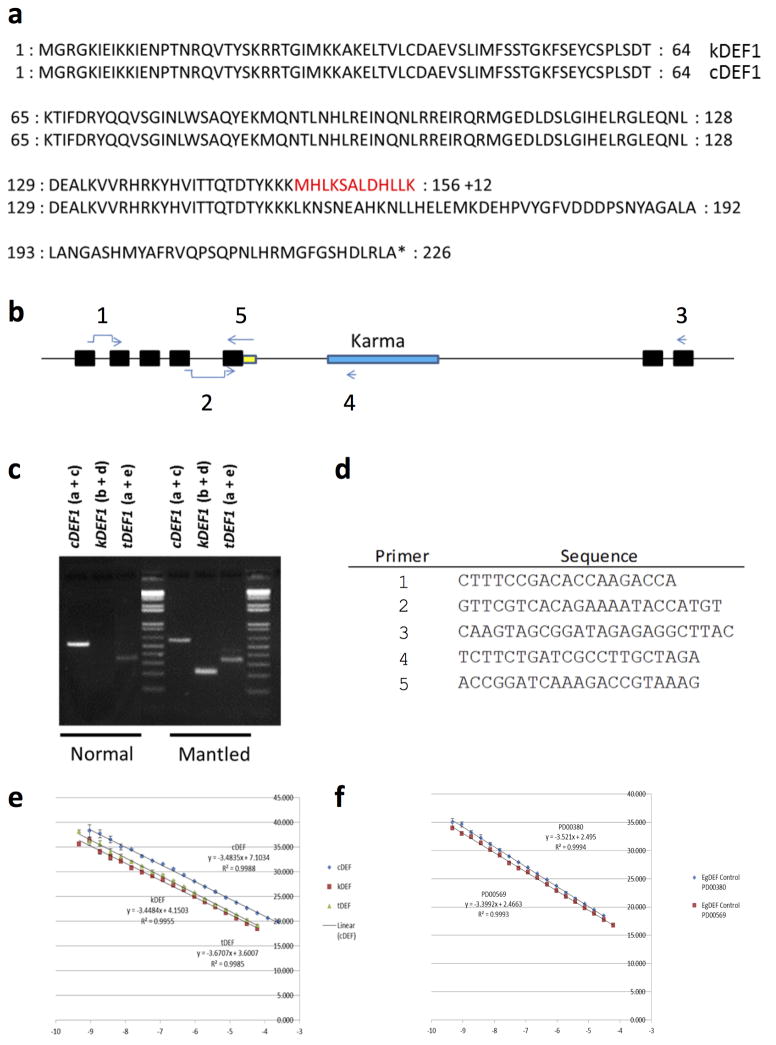
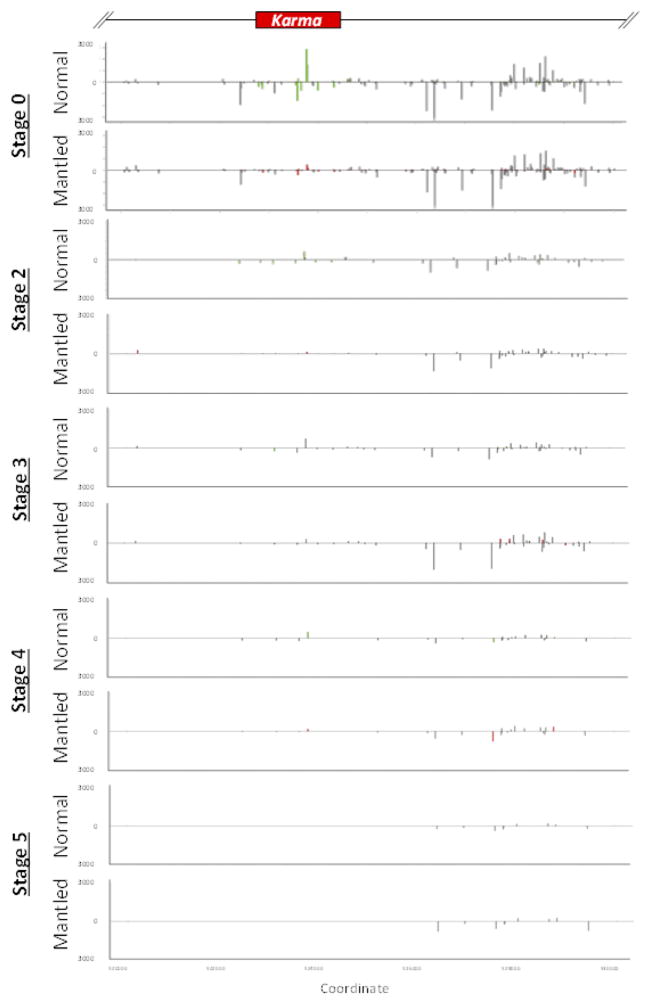
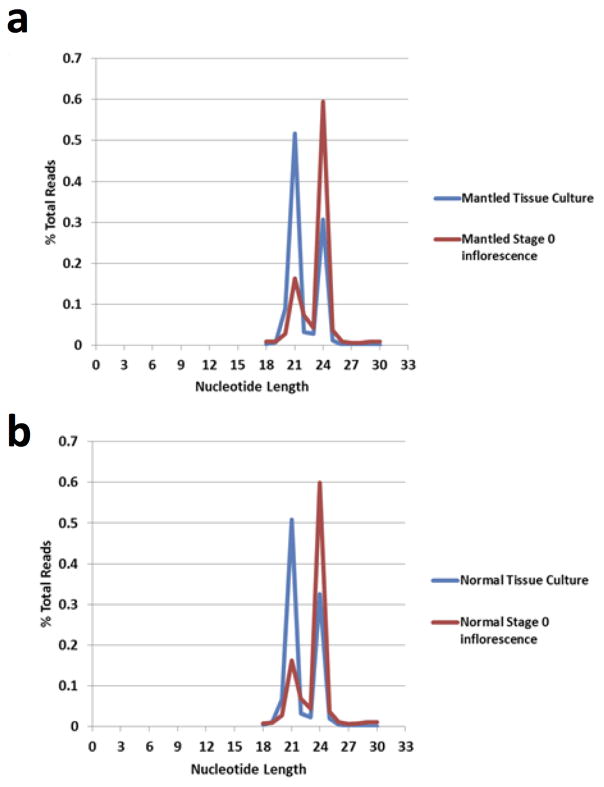
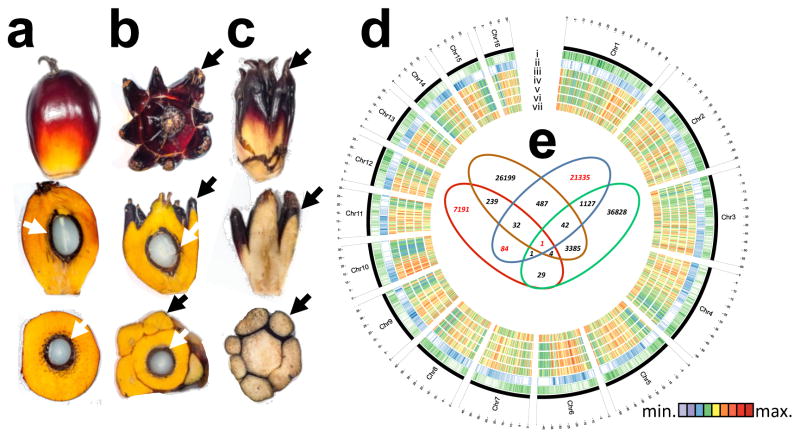
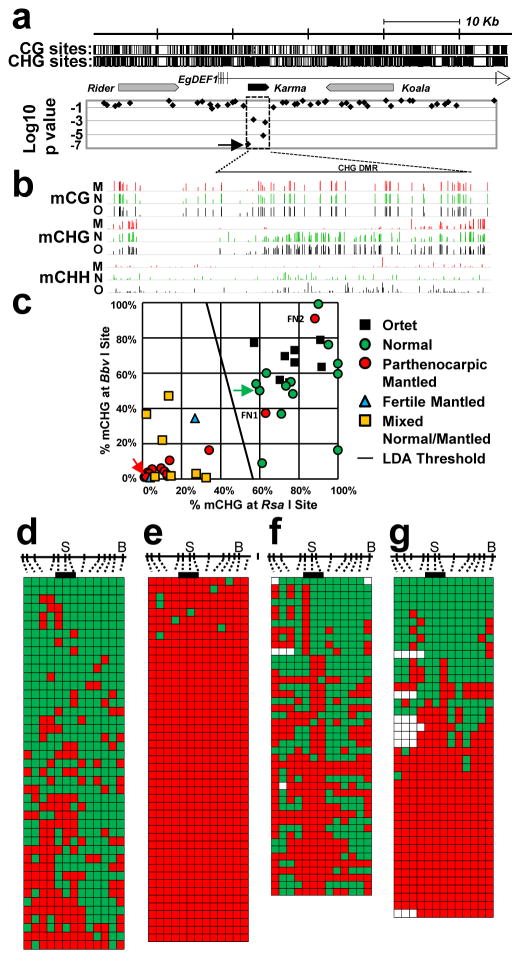
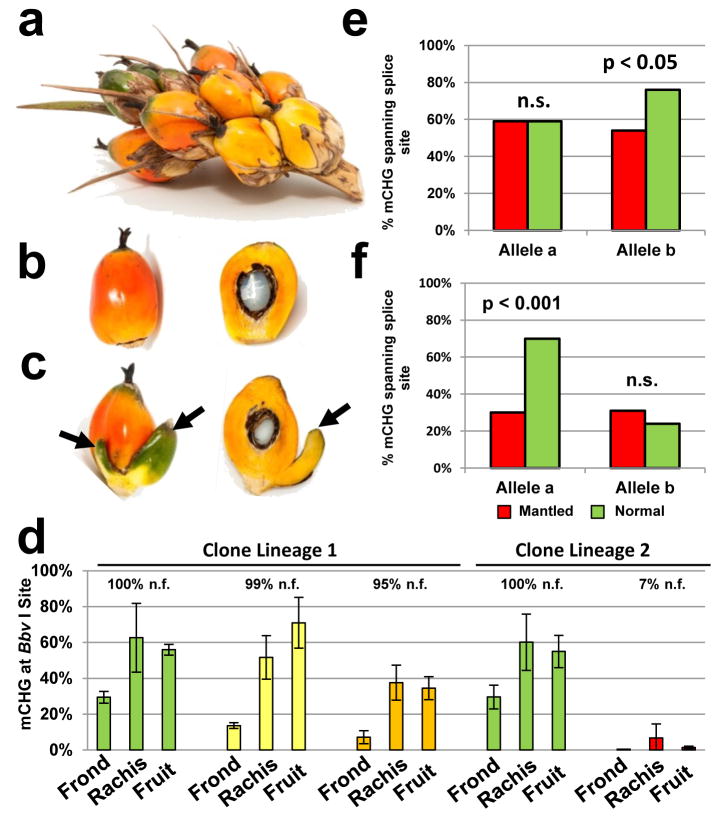
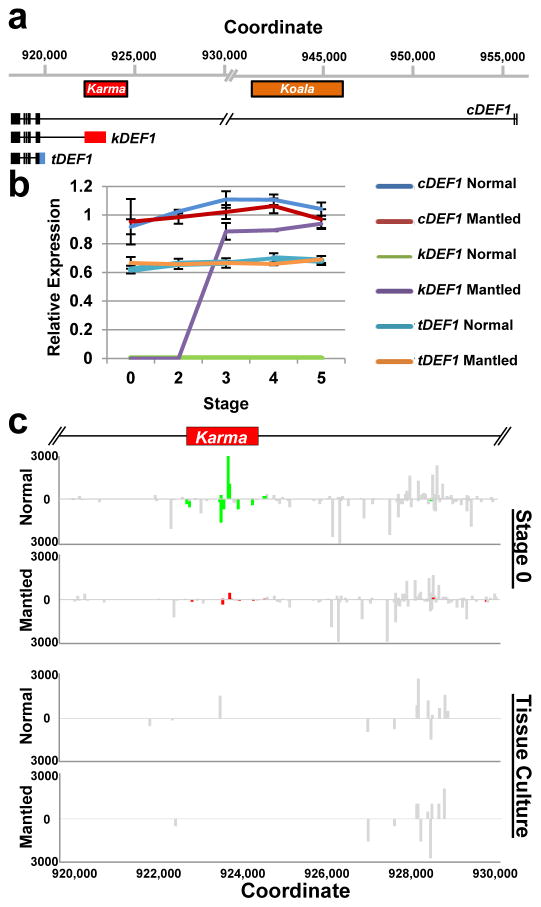
Somaclonal variation arises in plants and animals when differentiated somatic cells are induced into a pluripotent state, but the resulting clones differ from each other and from their parents. In agriculture, somaclonal variation has hindered the micropropagation of elite hybrids and genetically modified crops, but the mechanism responsible remains unknown. The oil palm fruit 'mantled' abnormality is a somaclonal variant arising from tissue culture that drastically reduces yield, and has largely halted efforts to clone elite hybrids for oil production. Widely regarded as an epigenetic phenomenon, 'mantling' has defied explanation, but here we identify the MANTLED locus using epigenome-wide association studies of the African oil palm Elaeis guineensis. DNA hypomethylation of a LINE retrotransposon related to rice Karma, in the intron of the homeotic gene DEFICIENS, is common to all mantled clones and is associated with alternative splicing and premature termination. Dense methylation near the Karma splice site (termed the Good Karma epiallele) predicts normal fruit set, whereas hypomethylation (the Bad Karma epiallele) predicts homeotic transformation, parthenocarpy and marked loss of yield. Loss of Karma methylation and of small RNA in tissue culture contributes to the origin of mantled, while restoration in spontaneous revertants accounts for non-Mendelian inheritance. The ability to predict and cull mantling at the plantlet stage will facilitate the introduction of higher performing clones and optimize environmentally sensitive land resources.


Figures

Extended Data Figure 1
Extended Data Figure 1. Spikelets from clonal palms of different fruit form phenotypes
a, Spikelets from a normal ramet. b, Spikelet from a fertile mantled ramet. c, Spikelet from a parthenocarpic mantled ramet. d, Spikelet from a revertant ramet displaying both normal (N) and mantled (M) fruits in the same spikelet.
Extended Data Figure 2
Extended Data Figure 2. Annotation of genome-wide differentially methylated loci
Sequences of microarray features reporting significant differential DNA methylation between fully normal and fully mantled leaf DNA samples of one or more clonal lineages were mapped to the reference E. guineensis pisifera genome. Features were assigned to gene and repeat classes according to annotations of genomic elements mapped within 3 Kb of the microarray feature sequence, as this is the distance at which McrBC is capable of monitoring DNA methylation density. The Repeat class includes all repetitive sequences, including transposons and pisifera-specific repetitive sequences. Features mapping within 3 Kb of both a gene and a repeat were assigned to both classes. The number of features reporting hypermethylation (red) and hypomethylation (green) are plotted.
Extended Data Figure 3
Extended Data Figure 3. Summary of DNA methylation changes predicted by EWAS within clonal lineages
Rows indicate independent clonal lineages from four oil palm industry sources (Source A–D, as indicated in Fig. 1e). The numbers of fully normal and fully mantled palms per lineage represented are indicated to the left. Columns represent each microarray feature mapping to the EgDEF1 (open box at top) and upstream region. The relative positions of Rider, Karma and Koala elements are indicated. The arrow indicates the direction of EgDEF1 transcription. Features reporting significant hypomethylation or hypermethylation in mantled relative to normal clones are indicated as black and gray boxes, respectively. White boxes indicate features reporting no significant DNA methylation difference. Only clonal lineages including more than 1 ramet per phenotype are shown in order to determine statistical significance within each clonal lineage (n=41 normal; n=37 parthenocarpic mantled). Ramets from four additional clonal lineages were included in the source-by-source analysis shown in Fig. 1e.
Extended Data Figure 4
Extended Data Figure 4. DNA methylation assays and supporting DNA methylation data
a, Diagram of the EgDEF1 gene including the Karma element within intron 5 (orange box). Black boxes represent exons and the horizontal line represents introns. Scale bar is in base pair units. b, Blue tick marks represent the relative positions of the four microarray features reporting significant hypomethylation of mantled clones in all source lineages. The left-most feature includes the Karma splice acceptor site. Horizontal lines labeled B (BbvI) and R (RsaI) indicate the relative positions of amplicons used for qPCR based CHG methylation assays. The BbvI amplicon also includes a ScrFI site (S) utilized in panel d. The relative position of the bisulfite sequencing amplicon used to determine Karma splice site CHG methylation is shown below the qPCR amplicons. c, Diagrams of the three alternatively spliced EgDEF1 transcripts. Black boxes represent exons included in each transcript. The dotted lines represent intronic sequences spliced out of the mature mRNA transcripts. The red box represents Karma element sequence spliced to EgDEF exon 5 in the kDEF1 transcript. The blue box represents EgDEF1 intron 5 sequence included in the tDEF1 transcript that does not utilize the exon 5 splice donor site. d, In addition to adult leaf samples analyzed by BbvI and RsaI qPCR assays (Fig. 2c), 37 samples were found to have a SNP in the BbvI site and were therefore analyzed by ScrFI and RsaI qPCR assays (Methods, Extended Data Fig. 4b). LDA was performed between normal (n=14) and mantled (n=22 parthenocarpic mantled; n=1 fertile mantled) samples. Combining these results with those shown in Figure 2c, sensitivity and specificity for detection of mantling are each 94%. e, Bisulphite sequencing of controls, FN1 and FN2 (Fig. 2c). mCHG density was calculated for the 3 CHG sites covered by the unique common microarray feature (Fig. 1e, Fig. 2d–g). FN1, FN2 and the mantled control were significantly hypomethylated relative to the normal control (* p<0.0001, two-tailed Fisher’s exact test).
Extended Data Figure 5
Extended Data Figure 5. Clone based bisulfite sequencing maps of normal and mantled phenotype fruits from epigenetic mosaics
The heatmap format is as described in Figure 2d–g. Gray boxes indicate a site in which a SNP on allele a resulting in a CHG to CHH site conversion. Mosaic Clone #1 represents a revertant clone yielding 95% normal fruit. Mosaic Clone #2 represents a revertant clone yielding 99% normal fruit. Alleles were analyzed independently based on a SNP not affecting a potentially methylated base. Statistical analyses of methylation at the three CHG sites spanning the Karma splice site are shown in Fig. 3e–f.
Extended Data Figure 6
Extended Data Figure 6. CHG methylation in rachis sectors of an oil palm yielding 7% normal fruit (Clone lineage 2 in Fig. 3d)
Rachis of three successive fronds was dissected into 8 equal sectors. DNA methylation in each sector per frond was measured by BbvI and ScrFI assays, as described in Methods. Average DNA methylation density measurements of three technical replicates per frond, per sector, per assay are plotted on a radial graph representing the 8 rachis sections around the palm trunk (ScrFI assay, light blue; BbvI assay dark blue). Sector numbering was ratcheted for frond 2 vs. 1 and frond 3 vs. 2 based on the R2 best fit of CHG methylation density around the circumference of the palm to correct for out-of-register numbering of rachis sectors between successive fronds (data not shown). Consistent with the fact that this oil palm yields only 7% normal phenotype fruit, the majority of DNA methylation measurements are consistent with the mantled phenotype. However, sectors 8 and 2 display gains of CHG methylation in rachis sectors of all three fronds, and reach or approach normal levels in sectors 8 and 2 of frond 2, thus demonstrating mosaicism directly.
Extended Data Figure 7
Extended Data Figure 7. Protein sequences and summary of qRT-PCR assay designs
a, Residues highlighted in red are encoded by Karma sequence splice to exon 5 of EgDEF1. The alternate splicing event disrupts the transcription activation domain of EgDEF1. 12 variant amino acids are coded by Karma sequencing, followed by a stop codon. b, Diagram of EgDEF1 locus including positions of qRT-PCR primers. cDEF1 transcripts were detected using primer a (spanning the splice junction of exons 1 and 2) and primer c (internal to exon 7). kDEF1 transcripts were detected using primer b (spanning the splice junction of exons 4 and 5) and primer d (internal to Karma ORF2). tDEF1 transcripts were detected using primer a and primer e (spanning the 3′ end of exon 5 and including tDEF1-specific intron 5 sequence. c, All assays were confirmed to give a single band of the correct size by agarose gel electrophoresis. Amplicons were Sanger sequence verified. Note that no band is amplified using the kDEF1 primer pair in samples from normal inflorescence, consistent with lack of expression of kDEF1 in normal inflorescence. d, Sequences of primers diagrammed in panel b. e–f, PCR amplicons including each qRT-PCR amplified sequence were serially diluted and quantified in triplicate by qPCR using the indicated primer pairs. Dilutions (x-axis) were plotted against the measured cycle threshold (y-axis). e, Standard curves for cDEF1 (blue), kDEF1 (red) and tDEF1 (green). Line equations were used to calculate the efficiency of each primer pair. The efficiency of each primer pair was used in calculations for quantification of expression of each associated transcript. f, Standard curves for two endogenous oil palm control genes. The efficiency of each primer pair was used in calculations for quantification of expression of each associated transcript. Expression of each alternative transcript was calculated relative to the control PD00569 control. Control qRT-PCR primers are described in Chan et al..
Extended Data Figure 8
Extended Data Figure 8. 24nt sRNA analysis of inflorescence development
sRNA expression at inflorescence stages 0 (shoot apical meristem), 2, 3, 4 and 5, was analyzed by Illumina sRNA sequencing (Methods). FPKM normalized expression values for each measured 24nt sRNA are plotted in scale with the genomic elements diagrammed at the top of the figure. Gray bars indicate detected 24nt sRNA that are not significantly differentially expressed between normal relative to mantled tissues (p > 0.05, student’s t test, two tailed assuming equal variance). Differentially expressed 24nt sRNAs are plotted as green or red bars for normal or mantled tissues, respectively. Bars above and below the zero line represent sense and antisense sRNAs, respectively, and are plotted on the same scale in both directions.
Extended Data Figure 9
Extended Data Figure 9. Relative abundance of 21nt and 24nt sRNA in normal and mantled reclones and stage 0 inflorescence
a, Distribution of small RNA lengths derived from mantled reclone (blue) and stage 0 inflorescence (red). b, Distribution of small RNA lengths derived from normal reclone (blue) and stage 0 inflorescence (red). Read lengths of small RNA sequencing reads are plotted as the percentage of total reads for each incremental sRNA nucleotide length.
Extended Data Figure 10
Extended Data Figure 10. CHG methylation in recloned tissue cultures
Tissue cultures were reconstituted from normal and mantled ramets from two clonal lineages (“clones of clones”). Methylation at three CHG sites across the Karma DMR was quantified by qPCR assays at two (SC2) and seven (SC7) passages in tissue culture. Cultures derived from normal ramets displayed higher CHG methylation than those derived from mantled ramets. In both normal and mantled reclones, CHG methylation generally decreased with time in culture. At SC2, the time point at which 24nt sRNAs were measured (Figure 5c), the culture from normal ramet lineage 1 had lost methylation at the Bbv I (the site nearest the Karma splice acceptor site).
Figure 1
Figure 1. Epigenome Wide Association Study (EWAS)
a, Normal, b, fertile mantled, c, parthenocarpic mantled fruit shown as whole fruit (top), longitudinal sectioned (middle) and cross sectioned (bottom). Black arrows, pseudocarpels. White arrows, kernel. d, Circos plot of Oil Palm Chromosomes. Track order: gene density (i); repeat density (ii); cytosine methylation density (whole genome bisulphite sequencing) in an ortet (iii); cytosine methylation densities (microarray) of ortet (iv), normal ramet (v) and mantled ramet (vi); differential cytosine methylation of normal minus mantled ramets (vii). Heatmaps represent average cytosine methylation densities in ~300 Kb windows independent of sequence context. e, Venn diagram of microarray features differentially methylated between leaves from mantled and normal ramets (p<0.05, two-sided Student t-test, Methods). Each set represents clonal lineages of given genotypes obtained from one source: Source A (red, 15 mantled, 15 normal), Source B (brown, 6 mantled, 14 normal), Source C (blue, 14 mantled, 15 normal), and Source D (green, 8 mantled, 10 normal). Red numbers indicate subsets including one of the four microarray features mapping to the Karma LINE element.
Figure 2
Figure 2. Hypomethylation of Karma is associated with the mantled phenotype
a, Microarray feature data plotted below a map of the EgDEF1/MANTLED gene (vertical ticks, exons; horizontal line, introns; arrow, direction of transcription) including locations of Rider, Karma (dashed box) and Koala retrotransposons. CG and CHG sites are shown at the top. Log10 p values (54 normal vs. 43 parthenocarpic mantled ramets) are plotted (two-sided Student’s t-test). Arrow in p value plot, feature detected as hypomethylated in mantled ramets from all 4 sources (Fig. 1e). b, Genome-wide bisulphite sequencing of leaf samples from ortet (O, black, n=5), normal ramets (N, green, n=5) and parthenocarpic mantled ramets (M, red, n=5). Mean methylation density per cytosine is plotted on a 0 to 100% scale for each cytosine context and sample type. CHG DMR, differentially CHG methylated region corresponding to Karma. c, CHG methylation monitored in 86 additional ortets, mantled and normal ramet leaf samples by restriction enzyme digestion and qPCR (Methods). LDA was performed between normal (n=21) and mantled (n=28) samples with BbvI and RsaI restriction sites. FN1 and FN2, two false negative mantled samples. Green and red arrows, normal and mantled control samples, respectively. A similar analysis was performed on remaining normal (n=14) and mantled (n=23) samples with ScrFI restriction sites (Extended Data Fig. 4d). d–g, Karma bisulphite sequencing maps (antisense strand) of (d) normal control, (e) mantled control, (f) FN1 and (g) FN2. 13 CHG sites are shown to scale above. “S”, CHG at the Karma splice acceptor site (CAG/CTG). “B”, BbvI site. Bar, CHGs within the common microarray feature (Fig. 1e). Methylated and unmethylated CHG sites are indicated by green and red boxes, respectively. Open boxes, low quality base calls. Each row represents an individual Sanger DNA sequencing read.
Figure 3
Figure 3. Karma methylation in revertant palms
a–c, Spikelet (a) from a revertant ramet including normal (b) and fertile mantled (c) fruit with one or two pseudocarpels (arrows). d, density of CHG methylation (% mCHG) at the BbvI site (Methods) in ramets yielding 100% normal fruit (n.f.) (green), revertant ramets yielding 99% (yellow) or 95% (orange) normal fruit and a mosaic ramet yielding 7% (red) normal fruit per bunch. Error bars, standard deviation (biological replicates of fronds (n=4), rachis sections (n=8) or fruit (n=2)). e–f, % mCHG for the 3 CHG sites found in the unique common microarray feature (Fig. 3b) in normal (green) and subtly mantled (red) fruit from revertant ramets yielding 99% (e) or 95% (f) normal fruit per bunch (two-tailed Fisher’s exact test, n.s., not significant). Alleles were analyzed separately based on a heterozygous SNP within the bisulphite sequencing amplicon.
Figure 4
Figure 4. Alternative splicing and loss of 24nt small RNA
a, EgDEF1/MANTLED transcripts assembled from transcriptome sequencing (data not shown) and RT-PCR (Methods). Black boxes, exons. Blue box, intron 5 sequence included in the tDEF1 transcript. Coordinates relative to the reference pisifera oil palm genome. b, Quantitative RT-PCR of cDEF1, tDEF1 and kDEF1 transcripts in shoot apices (stage 0) and in early (stage 2) to late (stage 5) female inflorescences from normal and parthenocarpic mantled ramets. Error bars, standard deviations between 3 replicate assays of 3 replicate tissue samples per phenotype, per stage. Expression relative to an endogenous reference gene is shown (Methods). c, 24nt siRNA accumulation in shoot apices (stage 0) from normal (n=5) and parthenocarpic mantled (n=7) ramets, and from second passage apical leaf tissue cultures re-cloned from normal (n=2) or mantled (n=1) ramets (Methods). Values expressed as fragments per kilobase per million mapped reads (FPKM). Bars above (sense) and below (antisense) the line indicate mapped normalized 24nt siRNAs that are not significantly different in abundance in normal and mantled (grey) or significantly differentially expressed in normal (green) relative to mantled (red) (p <0.05, Student’s t-test, two tailed, assuming equal variance).

Comment in

References

    1. Stroud H, et al. Plants regenerated from tissue culture contain stable epigenome changes in rice. Elife. 2013;2:e00354. - PMC - PubMed
    1. Corley RHV. Oil palm. In: Monselise SP, editor. CRC Handbook of fruit set and development. CRC Press; Boca Raton, Florida: 1986. pp. 253–259.
    1. Zeven AC. The ‘mantled’ oil palm (Elaeis guineensis Jacq.) J W Afr Inst Oil Palm Res. 1973;5:31–33.
    1. Mgbeze GC, Iserhienrhien A. Somaclonal variation associated with oil palm (Elaeis guineensis Jacq.) clonal propagation: A review. African Journal of Biotechnology. 2014;13:989–997.
    1. Jaligot E, Rival A, Beule T, Dussert S, Verdeil JL. Somaclonal variation in oil palm (Elaeis guineensis Jacq.): the DNA methylation hypothesis. Pl Cell Rep. 2000;19:684–690. - PubMed

Publication types

MeSH terms