. 2015 Sep 17;525(7569):376-9.
doi: 10.1038/nature14907. Epub 2015 Sep 9.

A new cyanogenic metabolite in Arabidopsis required for inducible pathogen defence

Affiliations

A new cyanogenic metabolite in Arabidopsis required for inducible pathogen defence

Jakub Rajniak et al. Nature. .

Abstract

Thousands of putative biosynthetic genes in Arabidopsis thaliana have no known function, which suggests that there are numerous molecules contributing to plant fitness that have not yet been discovered. Prime among these uncharacterized genes are cytochromes P450 upregulated in response to pathogens. Here we start with a single pathogen-induced P450 (ref. 5), CYP82C2, and use a combination of untargeted metabolomics and coexpression analysis to uncover the complete biosynthetic pathway to 4-hydroxyindole-3-carbonyl nitrile (4-OH-ICN), a previously unknown Arabidopsis metabolite. This metabolite harbours cyanogenic functionality that is unprecedented in plants and exceedingly rare in nature; furthermore, the aryl cyanohydrin intermediate in the 4-OH-ICN pathway reveals a latent capacity for cyanogenic glucoside biosynthesis in Arabidopsis. By expressing 4-OH-ICN biosynthetic enzymes in Saccharomyces cerevisiae and Nicotiana benthamiana, we reconstitute the complete pathway in vitro and in vivo and validate the functions of its enzymes. Arabidopsis 4-OH-ICN pathway mutants show increased susceptibility to the bacterial pathogen Pseudomonas syringae, consistent with a role in inducible pathogen defence. Arabidopsis has been the pre-eminent model system for studying the role of small molecules in plant innate immunity; our results uncover a new branch of indole metabolism distinct from the canonical camalexin pathway, and support a role for this pathway in the Arabidopsis defence response. These results establish a more complete framework for understanding how the model plant Arabidopsis uses small molecules in pathogen defence.


Figures

Extended Data Figure 1
Extended Data Figure 1. Elicitation of compounds identified in metabolomics screen by Flg22 peptide and origin of ICA methyl ester as artifact of the methanol extraction method
(A) Levels of compounds in Flg22-elicited Arabidopsis Col-0 seedling tissue, quantified as mean [M+H]+ ion (m/z ± 10 ppm) abundances extracted from raw data, with error bars indicating ± standard deviation based on 3 biological replicates. Production of these compounds in axenic plant culture demonstrates that they are plant-derived. (B) Structure and mass peaks of ICA methyl ester (compound A1) seen in LC-MS analysis, and (C) EICs for the expected m/z using a standard extraction with 80:20 CH3OH/H2O or with 80:20 CD3OD/D2O. (D) Structure and mass spectrum peaks seen for the triply deuterated A1 analog, and (E) EICs for the expected m/z using extraction with 80:20 CH3OH /H2O, or with 80:20 CD3OD/D2O (all EICs are to scale). The presence of the deuterated analog of ICA methyl ester and the complete absence of the non-deuterated compound in plant extracts when CD3OD is substituted for CH3OH show that the methyl ester is not a product of Arabidopsis metabolism, but arises due to the extraction method as a degradation product of ICN.
Extended Data Figure 2
Extended Data Figure 2. Comparison of spectra for plant-extracted and synthetic compound establishes identity of ICN as new indolic metabolite produced by A. thaliana
(A) Full range (δ 10.5 to −0.5) and (B) downfield region partial (δ 8.5 to 7.0) 1H NMR spectra in CD3CN. Upfield contaminants in the full range spectra are presumed to be residual solvent. (C) UV/Vis absorbance spectra obtained via a diode array detector during liquid chromatography (LC) analysis. Note that the prominent peak at 230 nm is due to acetonitrile in the LC mobile phase. (D) Targeted MS/MS spectra for the parent ICN [M+H]+ ion (m/z = 171.0550) at a 20 V collision energy. See SI Table 1 for relative peak intensities at other collision energies. (E) Aligned EICs for the ICN [M+H]+ ion for a Col-0 +Psta tissue sample extracted with DMSO and synthetic compound, showing identical retention times.
Extended Data Figure 3
Extended Data Figure 3. Comparison of plant-extracted ICN derivatives, 4-OH-ICN derivatives and synthetic standards shows identical column elution times for all compounds
Col-0 +Psta combined EICs were extracted for the relevant compound [M+H]+ m/z values for a DMSO-extracted medium sample (4-OH-ICN trace), or a MeOH-extracted seedling tissue sample (all other traces), while synthetic EICs were extracted for a mixed standard in DMSO. Note that chromatograms are not to scale, and the synthetic standard is not equimolar with respect to all compounds due to partial degradation.
Extended Data Figure 4
Extended Data Figure 4. CYP82C2 is an ICN 4-hydroxylase
1H NMR spectra in CD3OD of synthetic ICA (A) and 4-OH-ICA (B). (C) Spectrum for large scale enzymatic reaction extract of ICN incubated with CYP82C2. In addition to ICA, resulting from hydrolysis of ICN, peaks for a singly hydroxylated analog of ICA are seen; these are qualitatively consistent with, but shifted slightly upfield (~30–60 Hz) from, the 4-OH-ICA spectrum, possibly due to impurities or a pH effect in the enzymatic reaction sample. (D) To confirm the identity conclusively, 80 µg of 4-OH-ICA dissolved in CD3OD was added to the enzymatic reaction NMR sample prior to acquiring another spectrum: no new peaks are seen, while the prior hydroxylated ICA peaks grow in intensity, establishing the product of the enzymatic reaction as 4-OH-ICA. (E) EICs for enzymatic reactions of CYP82C2 on ICN or ICA, or empty vector control incubation with ICN. Only trace amounts of the expected 4-OH-ICN product but significant amounts of 4-OH-ICA are seen for the CYP82C2/ICN reaction. No hydroxylated products are seen for the CYP82C2/ICA or empty vector/ICN reactions, indicating that CYP82C2 catalyzes only the hydroxylation of ICN to 4-OH-ICN, but 4-OH-ICA is seen as the predominant end product due to rapid hydrolysis of 4-OH-ICN (F). Chromatograms in this figure were obtained using the 20 min LC-MS gradient (see Methods section 1.9 LC-MS analysis).
Extended Data Figure 5
Extended Data Figure 5. Levels of numerous Arabidopsis indolic metabolites are altered in ICN pathway gene insertion lines compared to WT plants
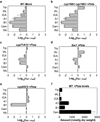
(A-E) Relative compound levels for mock treatment condition and indicated pathway insertion line mutants, and (F) absolute levels in Psta-treated WT (Col-0) seedlings. For panels A-E, data bars represent a logarithmically scaled ratio of mean metabolite levels in the indicated line or treatment condition, quantified as [M+H]+ ion abundances by LC-MS analysis with XCMS processing, to levels in Psta-treated WT Arabidopsis seedlings. In panel F, absolute levels for all compounds except RA were quantified by measuring [M+H]+ ion abundances and comparing to standard curves. Error bars indicate ± standard deviation, based on 6 biological replicates. Cam: camalexin; RA: raphanusamic acid; other abbreviations as detailed in the abbreviations list above.
Extended Data Figure 6
Extended Data Figure 6. Putative indole cyanogenic glycosides (ICGs) observed in Arabidopsis and in N. benthamiana expressing ICN pathway enzymes
(A) EICs for putative ICGs in WT Arabidopsis and fox mutant elicited with Psta. The m/z values shown are median values calculated by XCMS. (B) Hypothesized structures and theoretical m/z values for the two ICGs identified. (C) MS/MS spectrum for ICG1; m/z values and relative abundances are shown above each peak. The ion analyzed here (m/z = 691.2210) represents a [2M+Na]+ dimer that is significantly more abundant than the [M+Na]+ ion. Direct analysis of the [M+Na]+ ion (m/z = 357.1057) yielded low abundance spectra that could not be easily analyzed. At lower collision energies, the [2M+Na]+ ion fragments to [M+Na]+, but yields a rich spectrum at 40 V, which is shown. Predicted peak assignments for the ICG1 MS/MS spectrum are shown in the accompanying table. For peaks in bold, exact counterparts could be identified in the dhurrin [M+Na]+ 20 V MS/MS spectrum in the METLIN Metabolite Database. (D) MS/MS spectrum obtained for the ICG2 [M+Na]+ ion and predicted peak assignments. While the [2M+Na]+ peak (m/z = 864.2225) is also seen for this compound (not shown), [M+Na]+ is more abundant in this case, and was analyzed directly. (E) Levels of ICG1 and ICG2 in ICN pathway mutants and (F) in WT plants elicited with Psta and N. benthamiana expressing ICN pathway enzymes. For panels (E) and (F), levels are quantified as mean [M+Na]+ ion (m/z ± 10 ppm) abundances extracted from raw data, with error bars indicating ± standard deviation based on 6 biological replicates.
Extended Data Figure 7
Extended Data Figure 7. ICN pathway metabolites are produced in N. benthamiana transiently expressing pathway genes
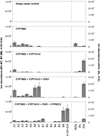
Levels of ICN and 4-OH-ICN derivatives (left axis) and other relevant indolic compounds (right axis), quantified as mean [M+H]+ ion (m/z ± 10 ppm) abundances extracted from raw data, with error bars indicating ± standard deviation based on 6 biological replicates. The set of transiently expressed genes is indicated for each panel. Background levels of ICA and IAL detected when only the early pathway genes CYP71A12 and/or CYP79B2 are expressed indicate potential involvement of endogenous N. benthamiana enzymes.
Extended Data Figure 8
Extended Data Figure 8. ICN pathway metabolites contribute to disease resistance towards B. cinerea but not towards G. orontii
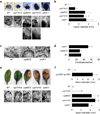
(A) Top: Typical lactophenol trypan blue staining of leaves drop-inoculated with spores from the virulent fungal necrotroph Botrytis cinerea to visualize the extent of host cell death (darkly stained areas within and beyond the fungal spore droplet region). Middle: Microscopic analysis of stained leaves to visualize the extent of fungal colonization (stained filamentous fungal hyphae within and beyond the fungal spore droplet region). Images were taken at the same magnification (25×) and are representative of 5 biological replicates. Bottom: Close up images of the fungal hyphae beyond the fungal spore droplet region for cyp82C2 and cyp71A13-3 mutants. Images were taken at the same magnification (100×). (B) Measurement of the disease lesion diameters in infected leaves. Data represent the median ± standard error for 5 biological replicates. Asterisks denote statistical significance relative to WT (p < 0.05, two-tailed t test). (C) Typical lactophenol trypan blue staining of fungal conidiophores (spore-bearing structures) formed in leaves infected with the adapted powdery mildew Golovinomyces orontii. The pad4-1 mutant is more susceptible to fungal growth by G. orontii and thus produces significantly more conidiophores. Images were taken at the same magnification (100×) and are representative of 3 biological replicates. (D) Measurement of the number of conidiophores in infected leaves. Data represent the mean ± standard deviation for 3 biological replicates. (E) Top: Typical disease symptoms three days after drop inoculation of leaves with spores from the avirulent fungal necrotroph Alternaria brassicicola. Bottom: Microscopic analysis of infected leaves after lactophenol trypan blue staining confirming that disease symptoms are consistent with extent of fungal colonization (lightly stained fungal hyphae extending from the fungal spore droplet region) and host cell death (darkly stained areas along and beyond the border of the spore droplet region). Images were taken at the same magnification (25×) and are representative of 10 biological replicates. (F) Measurement of the disease lesion diameters in infected leaves. Data represent the median ± standard error of 8 (top graph) or 10 biological replicates (bottom graph). Different letters denote statistically significant differences (p < 0.05, two-tailed t test).
Extended Data Figure 9
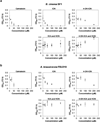
Extended Data Figure 9. ICN and 4-OH-ICN but not their degradation products inhibit fungal growth in vitro
Fungal growth inhibition assays on Botrytis cinerea SF1 (A) or Alternaria brassicicola FSU218 (B) with the tested compound (or compound combination) indicated. For compound combinations, the concentration indicated is for each compound; the given combinations approximate the hydrolysis products of ICN or 4-OH-ICN. Growth of fungi in PDB on a microplate was quantified by measuring absorbance at 600 nm (OD600) 72 hours after spore inoculation and subtracting the absorbance at 0 h; see Methods for further details. Error bars represent ± standard deviation based on 3 biological replicates. Note that the IC50 for both camalexin and ICN is approximately 25 µM against B. cinerea and 50 µM against A. brassicicola. For 4-OH-ICN, the inhibitory effect is not as pronounced, possibly due to rapid degradation of 4-OH-ICN in PDB (see SI Table 2).
Extended Data Figure 10
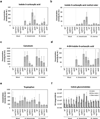
Extended Data Figure 10. Levels of indolic compounds in leaves of mature plants after mock treatment or fungal infection
Tissue extracts were analyzed by LC-MS 7 dpi for Alternaria brassicicola FSU218 and 5 dpi for Botrytis cinerea SF1. (A-E) Levels of indicated compound, quantified as EIC integral for the [M+H]+ ion (m/z ± 10 ppm) and converted to absolute amounts by comparison with a standard curve. (F) Ion count integrals for indole glucosinolates ([M-H] ion, m/z ± 10 ppm). Error bars in all panels represent ± standard deviation based on 6 biological replicates.
Fig. 1
Fig. 1. Transcriptomic and metabolomic analyses implicate CYP82C2 in the biosynthesis of novel pathogen defense-related secondary metabolites
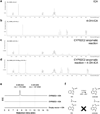
(A) Heat map of relative gene expression levels for cytochrome P450 genes in Arabidopsis under various pathogen stress conditions. The enlarged map shows the top 10 P450 genes after sorting by mean expression level over all conditions. P450s in gray have previously been biochemically characterized. (B) Levels of the most significantly differing metabolites identified in seedling comparative metabolomics experiments with cyp82C2. Data represent the mean ± standard deviation of 6 biological replicates. (C) ICA methyl ester (A1) and 4-OH-ICA methyl ester (B1) are methanolic degradation products of ICN and 4-OH-ICN. (D) HPLC traces of growth medium for WT and cyp82C2 seedlings, showing Psta-dependent accumulation of ICN and 4-OH-ICN.
Fig. 2
Fig. 2. Targeted metabolic profiling of candidate T-DNA insertion lines helps uncover the entire ICN biosynthetic pathway
(A) Heat map of mean ICN-derived metabolite levels relative to WT in Psta-elicited T-DNA insertion lines. Mutants in bold have significantly decreased levels of ICN derivatives. Note that A6 levels are not affected to the same extent as levels of other metabolites in any line except for cyp79B2/B3, hinting at an alternative biosynthetic route from IAOx for this metabolite. (B) Structures of all ICN derivatives, confirmed by comparison with synthetic standards (see Extended Data Fig. 3 and SI Table 1). (C) Proposed biosynthetic pathway from Trp to 4-OH-ICN and downstream metabolites.
Figure 3
Figure 3. In vitro reconstitution of 4-OH-ICN biosynthesis from IAOx
Combined extracted ion chromatograms for IAOx substrate and reaction products for various subsets of enzymes in the 4-OH-ICN pathway. 4-OH-ICN could not be detected directly and its hydrolysis product 4-OH-ICA is shown instead.
Figure 4
Figure 4. Camalexin and CYP82C2-synthesized 4-OH-ICN contribute nonredundantly to disease resistance against the virulent bacterial pathogen Pseudomonas syringae
(A) Growth analysis of the virulent P. syringae pv. tomato DC3000 (Pst) in surface-inoculated adult leaves. Data represent the mean ± standard error of 4 biological replicates. Different letters denote statistically significant differences (p <0.05, two-tailed t test). WT, wildtype (Col-0 ecotype). (B) Growth analysis of Pst in 10-day-old seedlings pretreated with water or 1 µM bacterial MAMP flg22 for 6 h. Data represent the median ± standard error of 4 biological replicates of 10–15 seedlings each. Different letters denote statistically significant differences (p < 0.05, two-tailed t test). (C) Growth analysis of Pst in wildtype adult leaves pre-immunized with 1 µM flg22 and 100 µM ICN, 4OH-ICN, camalexin or solvent control (DMSO) for 24 h prior to infiltration with Pst. Data represent the median ± standard error of 3 biological replicates. Asterisk denotes statistical significance relative to wildtype (p < 0.01, two-tailed t test). Experiment was repeated three times, producing similar results. (D) Summary of known major Trp-derived secondary metabolites in Arabidopsis and oxidative biosynthetic enzymes that have been used to reconstitute the pathways in vitro or in planta.

References

    1. Chae L, Kim T, Nilo-Poyanco R, Rhee SY. Genomic signatures of specialized metabolism in plants. Science. 2014;344:510–513. - PubMed
    1. D'Auria JC, Gershenzon J. The secondary metabolism of Arabidopsis thaliana: growing like a weed. Current opinion in plant biology. 2005;8:308–316. - PubMed
    1. Bednarek P, Osbourn A. Plant-microbe interactions: chemical diversity in plant defense. Science. 2009;324:746–748. - PubMed
    1. Denoux C, et al. Activation of defense response pathways by OGs and Flg22 elicitors in Arabidopsis seedlings. Molecular plant. 2008;1:423–445. - PMC - PubMed
    1. Bak S, et al. Cytochromes p450. The Arabidopsis book / American Society of Plant Biologists. 2011;9:e0144. - PMC - PubMed

Publication types

MeSH terms