

30-Day Survival Probabilities as a Quality Indicator for Norwegian Hospitals: Data Management and Analysis
- PMID: 26352600
- PMCID: PMC4564217
- DOI: 10.1371/journal.pone.0136547
30-Day Survival Probabilities as a Quality Indicator for Norwegian Hospitals: Data Management and Analysis
Abstract
Background: The Norwegian Knowledge Centre for the Health Services (NOKC) reports 30-day survival as a quality indicator for Norwegian hospitals. The indicators have been published annually since 2011 on the website of the Norwegian Directorate of Health (www.helsenorge.no), as part of the Norwegian Quality Indicator System authorized by the Ministry of Health. Openness regarding calculation of quality indicators is important, as it provides the opportunity to critically review and discuss the method. The purpose of this article is to describe the data collection, data pre-processing, and data analyses, as carried out by NOKC, for the calculation of 30-day risk-adjusted survival probability as a quality indicator.
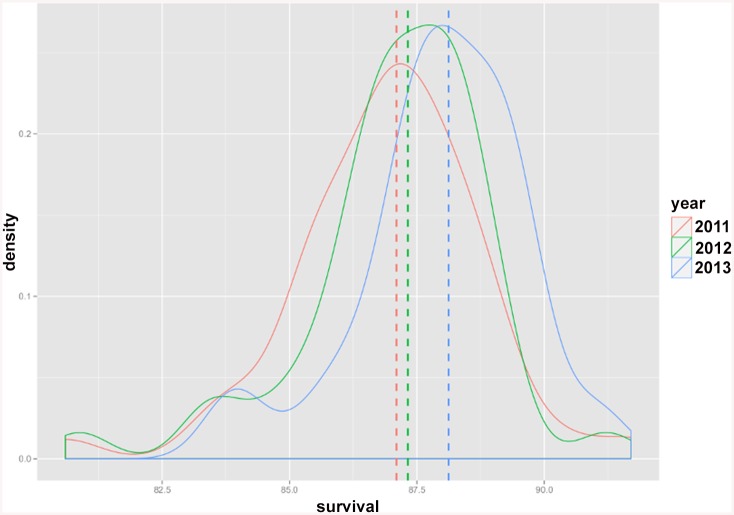
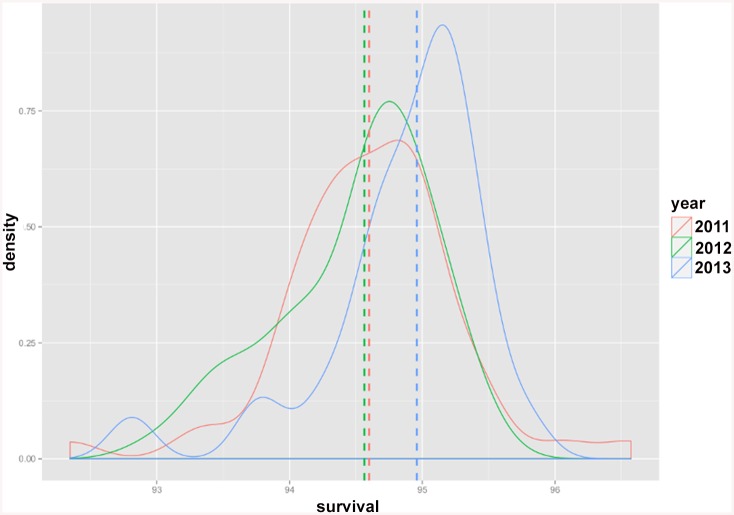
Methods and findings: Three diagnosis-specific 30-day survival indicators (first time acute myocardial infarction (AMI), stroke and hip fracture) are estimated based on all-cause deaths, occurring in-hospital or out-of-hospital, within 30 days counting from the first day of hospitalization. Furthermore, a hospital-wide (i.e. overall) 30-day survival indicator is calculated. Patient administrative data from all Norwegian hospitals and information from the Norwegian Population Register are retrieved annually, and linked to datasets for previous years. The outcome (alive/death within 30 days) is attributed to every hospital by the fraction of time spent in each hospital. A logistic regression followed by a hierarchical Bayesian analysis is used for the estimation of risk-adjusted survival probabilities. A multiple testing procedure with a false discovery rate of 5% is used to identify hospitals, hospital trusts and regional health authorities with significantly higher/lower survival than the reference. In addition, estimated risk-adjusted survival probabilities are published per hospital, hospital trust and regional health authority. The variation in risk-adjusted survival probabilities across hospitals for AMI shows a decreasing trend over time: estimated survival probabilities for AMI in 2011 varied from 80.6% (in the hospital with lowest estimated survival) to 91.7% (in the hospital with highest estimated survival), whereas it ranged from 83.8% to 91.2% in 2013.
Conclusions: Since 2011, several hospitals and hospital trusts have initiated quality improvement projects, and some of the hospitals have improved the survival over these years. Public reporting of survival/mortality indicators are increasingly being used as quality measures of health care systems. Openness regarding the methods used to calculate the indicators are important, as it provides the opportunity of critically reviewing and discussing the methods in the literature. In this way, the methods employed for establishing the indicators may be improved.
Conflict of interest statement
Figures
Similar articles
-
Comparing hospital mortality--how to count does matter for patients hospitalized for acute myocardial infarction (AMI), stroke and hip fracture.BMC Health Serv Res. 2012 Oct 22;12:364. doi: 10.1186/1472-6963-12-364. BMC Health Serv Res. 2012. PMID: 23088745 Free PMC article.
-
Survival curves to support quality improvement in hospitals with excess 30-day mortality after acute myocardial infarction, cerebral stroke and hip fracture: a before-after study.BMJ Open. 2015 Mar 25;5(3):e006741. doi: 10.1136/bmjopen-2014-006741. BMJ Open. 2015. PMID: 25808167 Free PMC article.
-
A two-stage estimation of hospital quality using mortality outcome measures: an application using hospital administrative data.Health Econ. 2010 Dec;19(12):1404-24. doi: 10.1002/hec.1560. Health Econ. 2010. PMID: 19937614
-
Validity of the indicator 'death in low-mortality diagnosis-related groups' for measuring patient safety and healthcare quality in hospitals.Intern Med J. 2010 Apr;40(4):250-7. doi: 10.1111/j.1445-5994.2009.02161.x. Intern Med J. 2010. PMID: 20529039 Review.
-
An international review of projects on hospital performance assessment.Int J Qual Health Care. 2008 Jun;20(3):162-71. doi: 10.1093/intqhc/mzn008. Epub 2008 Mar 13. Int J Qual Health Care. 2008. PMID: 18339665 Review.
Cited by
-
Progress in Biomedical Knowledge Discovery: A 25-year Retrospective.Yearb Med Inform. 2016 Aug 2;Suppl 1(Suppl 1):S117-29. doi: 10.15265/IYS-2016-s033. Yearb Med Inform. 2016. PMID: 27488403 Free PMC article.
-
Variation between Hospitals with Regard to Diagnostic Practice, Coding Accuracy, and Case-Mix. A Retrospective Validation Study of Administrative Data versus Medical Records for Estimating 30-Day Mortality after Hip Fracture.PLoS One. 2016 May 20;11(5):e0156075. doi: 10.1371/journal.pone.0156075. eCollection 2016. PLoS One. 2016. PMID: 27203243 Free PMC article.
-
Effects of Hypertension Alone and in Comorbidity with Diabetes on Death within 30 Days among Inpatients with COVID-19 Infection.J Res Health Sci. 2022 Dec;22(4):e00565. doi: 10.34172/jrhs.2022.100. J Res Health Sci. 2022. PMID: 37571936 Free PMC article.
-
Benchmarking of abdominal surgery: a study evaluating the HARM score in a European national cohort.BJS Open. 2020 Aug;4(4):637-644. doi: 10.1002/bjs5.50284. Epub 2020 Apr 21. BJS Open. 2020. PMID: 32315119 Free PMC article.
-
Inter-Professional Collaboration and Patient Mortality: Protocol for a Systematic Review and Meta-Analysis.Nurs Rep. 2020 Sep 8;10(1):15-22. doi: 10.3390/nursrep10010003. Nurs Rep. 2020. PMID: 34968260 Free PMC article.
References
-
- DepartmentofHealth. Health Care Quality Indicators in the Irish Health System: Examining the Potential of Hospital Discharge Data using the Hospital Inpatient Enquiry System Website of The Department of Health of Ireland: 2014.
MeSH terms
LinkOut - more resources
Full Text Sources
Other Literature Sources
