

Temporal and Spatial Comparisons of Underwater Sound Signatures of Different Reef Habitats in Moorea Island, French Polynesia
- PMID: 26352701
- PMCID: PMC4564141
- DOI: 10.1371/journal.pone.0135733
Temporal and Spatial Comparisons of Underwater Sound Signatures of Different Reef Habitats in Moorea Island, French Polynesia
Abstract
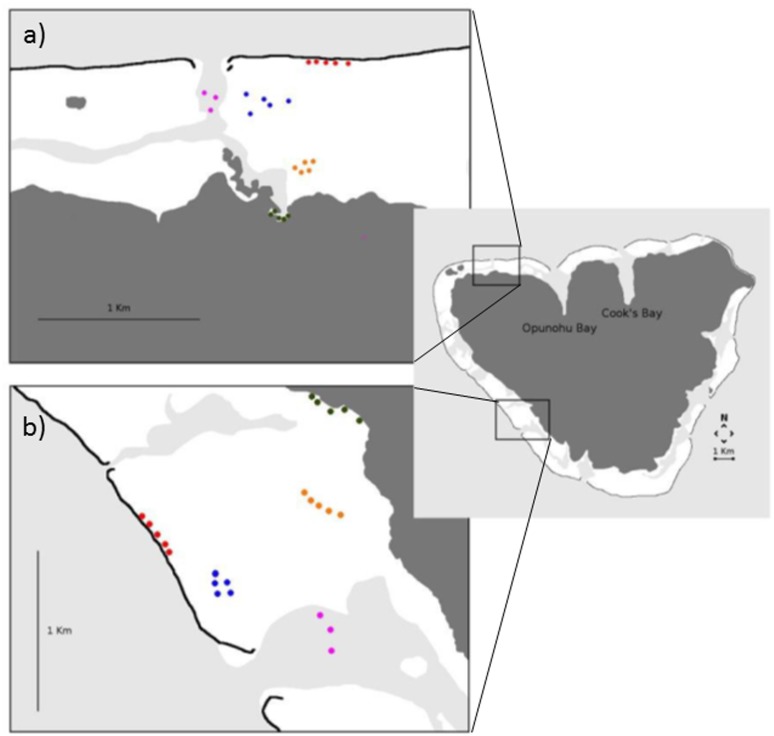
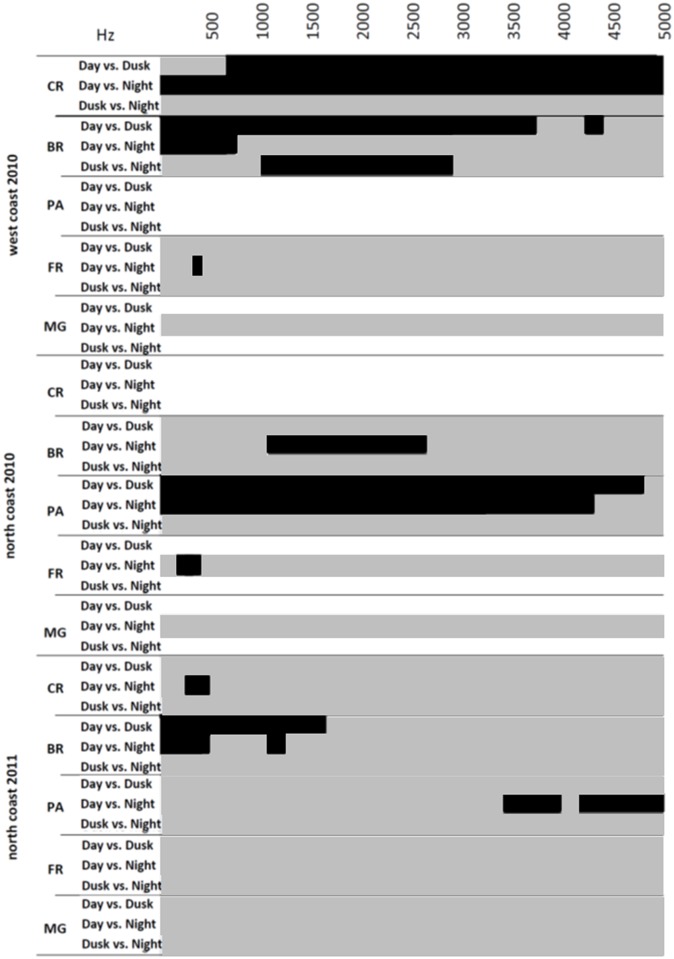
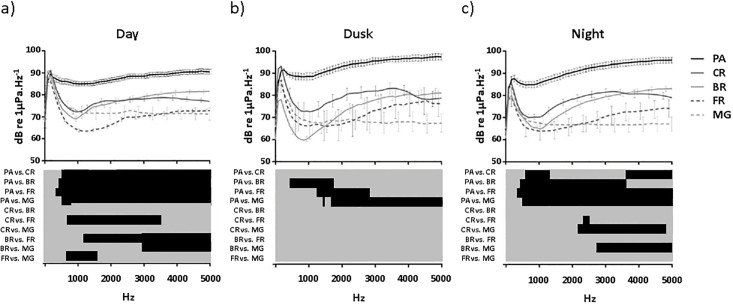
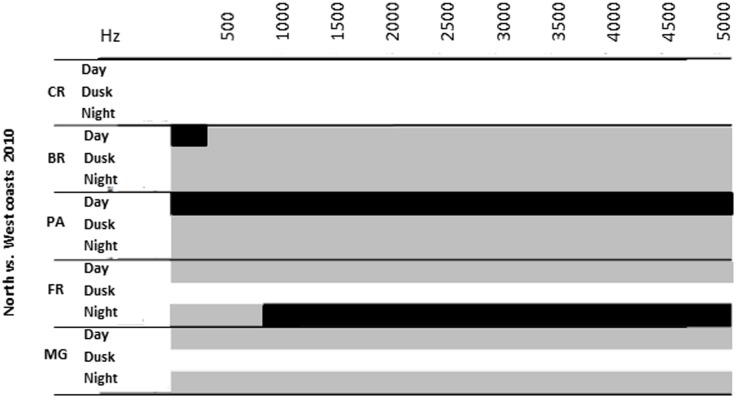
As environmental sounds are used by larval fish and crustaceans to locate and orientate towards habitat during settlement, variations in the acoustic signature produced by habitats could provide valuable information about habitat quality, helping larvae to differentiate between potential settlement sites. However, very little is known about how acoustic signatures differ between proximate habitats. This study described within- and between-site differences in the sound spectra of five contiguous habitats at Moorea Island, French Polynesia: the inner reef crest, the barrier reef, the fringing reef, a pass and a coastal mangrove forest. Habitats with coral (inner, barrier and fringing reefs) were characterized by a similar sound spectrum with average intensities ranging from 70 to 78 dB re 1 μPa.Hz(-1). The mangrove forest had a lower sound intensity of 70 dB re 1 μPa.Hz(-1) while the pass was characterized by a higher sound level with an average intensity of 91 dB re 1 μPa.Hz(-1). Habitats showed significantly different intensities for most frequencies, and a decreasing intensity gradient was observed from the reef to the shore. While habitats close to the shore showed no significant diel variation in sound intensities, sound levels increased at the pass during the night and barrier reef during the day. These two habitats also appeared to be louder in the North than in the West. These findings suggest that daily variations in sound intensity and across-reef sound gradients could be a valuable source of information for settling larvae. They also provide further evidence that closely related habitats, separated by less than 1 km, can differ significantly in their spectral composition and that these signatures might be typical and conserved along the coast of Moorea.
Conflict of interest statement
Figures
References
-
- Kerman BR. Underwater sound generation by breaking wind waves. The Journal of the Acoustical Society of America 1984; 75: 149–165.
-
- Montgomery JC, Jeffs A, Simpson SD, Meekan M, Tindle C. Sound as an orientation cue for the pelagic larvae of reef fishes and decapod crustaceans In: Southward AJ,Sims DW, editors. Advances in Marine Biology, Vol. 51, Academic Press; 2006. pp. 143–196. - PubMed
-
- Schwarz AL.The behavior of fishes in their acoustic environment. Environmental Biology of Fishes. 1985, 13: 3–15.
-
- Slabbekoorn H, Bouton N. Soundscape orientation: a new field in need of sound investigation. Animal Behavior. 2008; 76: e5–e8.
Publication types
MeSH terms
LinkOut - more resources
Full Text Sources
Other Literature Sources
Research Materials
Miscellaneous
