. 2015 Sep 29;6(29):26729-45.
doi: 10.18632/oncotarget.4925.

Genome-wide analysis of DNA methylation and gene expression patterns in purified, uncultured human liver cells and activated hepatic stellate cells

Affiliations

Genome-wide analysis of DNA methylation and gene expression patterns in purified, uncultured human liver cells and activated hepatic stellate cells

Adil El Taghdouini et al. Oncotarget. .

Abstract

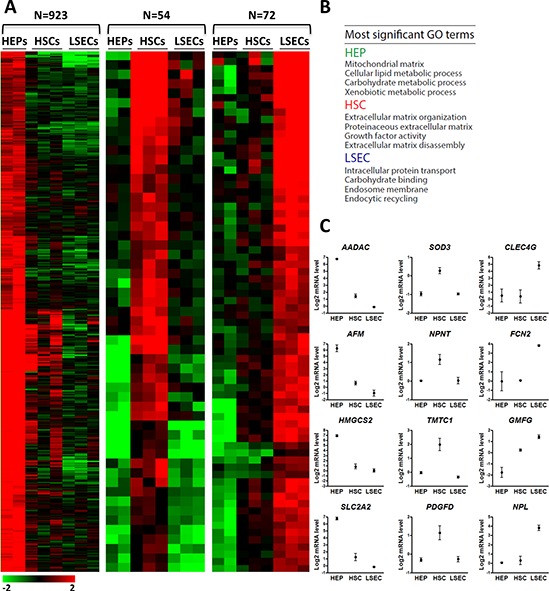
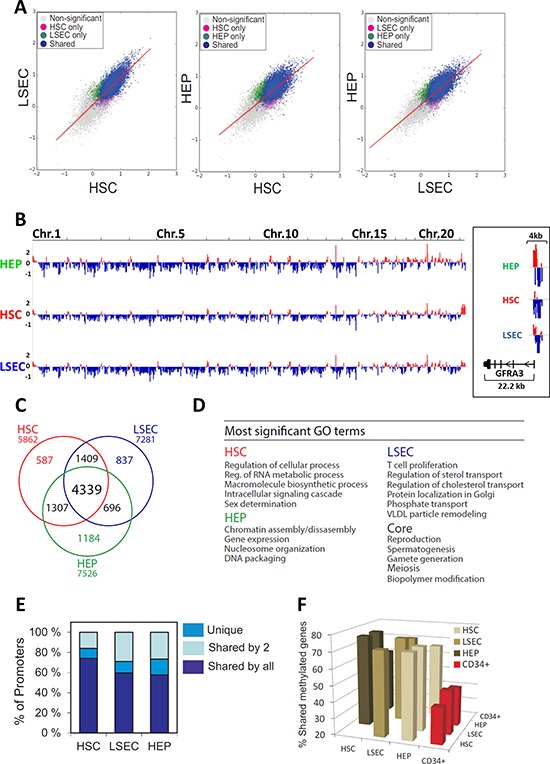
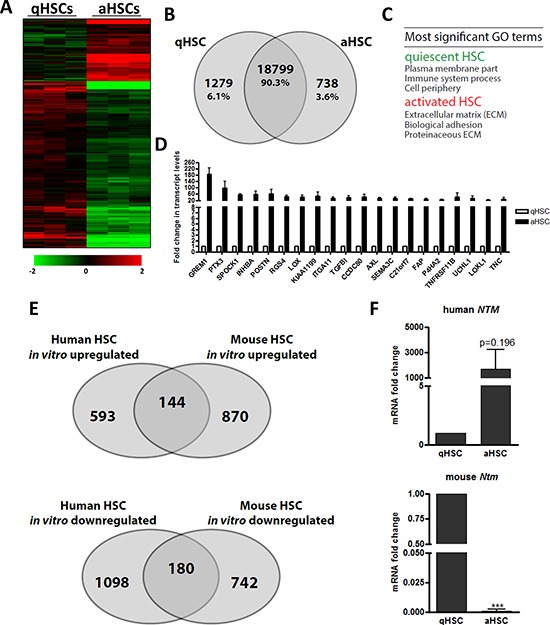
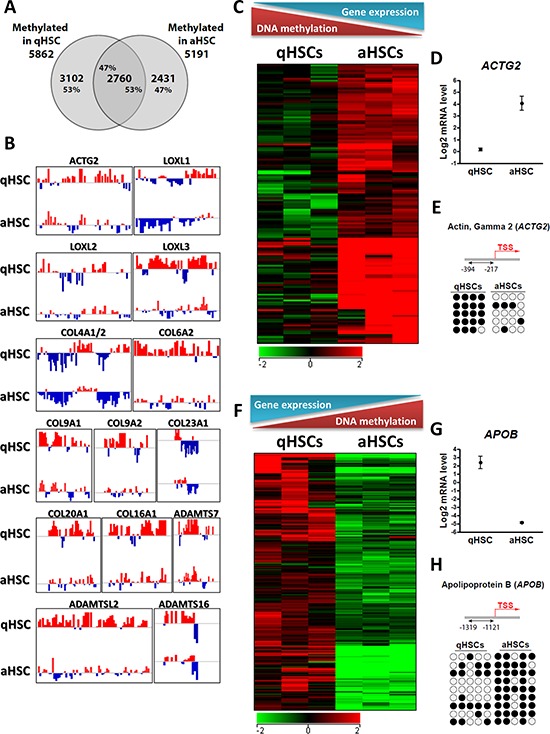
Background & aims: Liver fibrogenesis - scarring of the liver that can lead to cirrhosis and liver cancer - is characterized by hepatocyte impairment, capillarization of liver sinusoidal endothelial cells (LSECs) and hepatic stellate cell (HSC) activation. To date, the molecular determinants of a healthy human liver cell phenotype remain largely uncharacterized. Here, we assess the transcriptome and the genome-wide promoter methylome specific for purified, non-cultured human hepatocytes, LSECs and HSCs, and investigate the nature of epigenetic changes accompanying transcriptional changes associated with activation of HSCs.

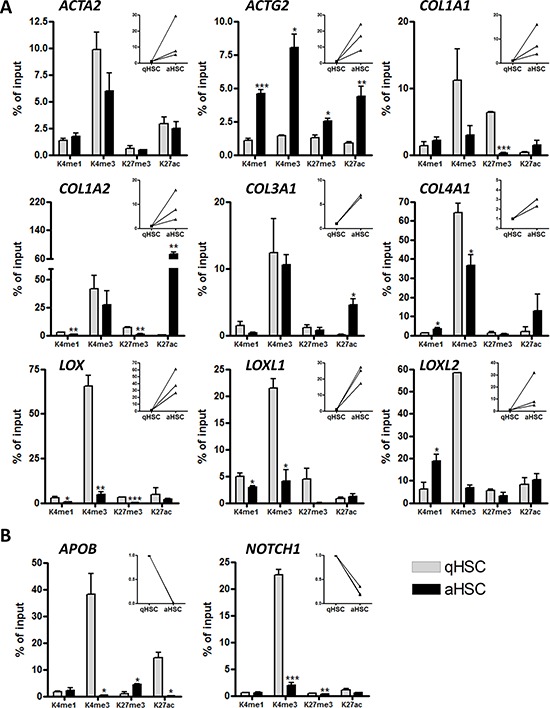
Material and methods: Gene expression profile and promoter methylome of purified, uncultured human liver cells and culture-activated HSCs were respectively determined using Affymetrix HG-U219 genechips and by methylated DNA immunoprecipitation coupled to promoter array hybridization. Histone modification patterns were assessed at the single-gene level by chromatin immunoprecipitation and quantitative PCR.

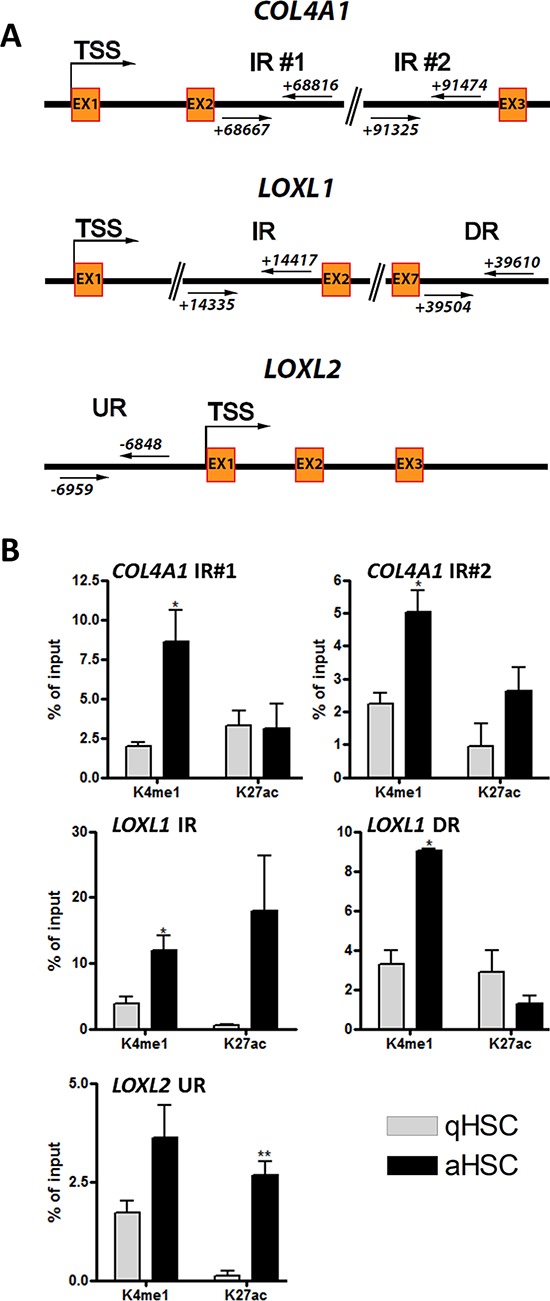
Results: We unveil a DNA-methylation-based epigenetic relationship between hepatocytes, LSECs and HSCs despite their distinct ontogeny. We show that liver cell type-specific DNA methylation targets early developmental and differentiation-associated functions. Integrative analysis of promoter methylome and transcriptome reveals partial concordance between DNA methylation and transcriptional changes associated with human HSC activation. Further, we identify concordant histone methylation and acetylation changes in the promoter and putative novel enhancer elements of genes involved in liver fibrosis.

Conclusions: Our study provides the first epigenetic blueprint of three distinct freshly isolated, human hepatic cell types and of epigenetic changes elicited upon HSC activation.

Keywords: DNA methylation; Pathology Section; epigenetics; hepatic stellate cells; liver fibrosis.


Conflict of interest statement

CONFLICTS OF INTEREST

Authors declare no conflicting interests.

Figures

Figure 1
Figure 1. Gene expression profiling of HSCs, LSECs and HEPs identifies liver cell type selective gene expression patterns
A. Heatmap of relative expression levels of genes classified based on expression patterns in HEPs, HSCs and LSECs. Cell type classification is based on a ≥ 2-fold higher expression compared to both other cell types. B. Most significant GO terms for each gene set shown in (A). C. Normalized expression level of novel indicated HEP, HSC or LSEC-specific genes.
Figure 2
Figure 2. MeDIP-chip analysis of the promoter DNA-methylome of human HEPs, HSCs and LSECs
A. Two-dimensional scatter plots of MaxTen values of methylation intensities for all promoters in HEPs, HSCs and LSECs. Genes with a promoter significantly methylated in one cell type are colored; non-significantly methylated genes are shown in gray. B. Browser view of promoter methylation on all chromosomes; right, zoom-in of GFRA3 methylation in HEPs, HSCs and LSECs (log (MeDIP/Input) ratios). Red and blue colors point to methylation peaks and depletions, respectively. C. Venn diagram analysis of numbers of genes with a methylated promoter in HSCs, LSECs and HEPs. D. Most significant GO terms for the methylation ‘core’ and for cell type-specific methylated genes. E. Proportion of genes that are uniquely or commonly methylated between two or more cell types. F. Promoter methylation in HSCs, LSECs and HEPs relative to CD34+ bone marrow progenitors. Percentage of methylated genes in cell types shown on the x-axis that are also methylated in cell types shown on the y-axis.
Figure 3
Figure 3. The gene expression changes elicited by in vitro HSC activation poorly correlate between mouse and human
A. Heatmap of relative expression levels of genes classified based on differential expression (≥ 2-fold) between human qHSCs and culture induced aHSCs. B. Venn diagram analysis of numbers of genes (absolute and as percentage of total analyzed genes) shown in (A). C. Enriched GO terms for genes differentially expressed between qHSCs and aHSCs. D. Normalized, relative expression levels of the top 20 most-upregulated genes following human HSC activation in vitro. E. Venn diagram analysis illustrating the overlap of annotated genes differentially regulated following in vitro activation of human and mouse HSCs. Mouse data from [59]. F. Relative neurotrimin (NTM) mRNA expression levels in freshly isolated, non-cultured qHSCs and culture aHSCs from human and mouse.
Figure 4
Figure 4. Culture-induced HSC activation reprograms promoter DNA methylation
A. Venn diagram analysis of the number of genes with a methylated promoter in qHSCs and aHSCs. B. Browser views of promoter methylation profiles (log (MeDIP/Input) ratios) for indicated genes in qHSCs and aHSCs. Red and blue colors point to methylation peaks and depletions, respectively. C. Heatmap of genes up-regulated and hypo-methylated after HSC activation. D. Boxwhisker plot of ACTG2 expression in qHSCs and aHSCs. E. Bisulfite sequencing analysis of CpG methylation in the ACTG2 promoter in qHSCs and aHSCs. Four CpGs are examined (columns) in 5 sequenced clones (rows). ● methylated CpG; ○ unmethylated CpG. F. Heatmap of genes down-regulated and hyper-methylated after HSC activation. G. Boxwhisker plot of APOB expression in qHSCs and aHSCs. H. Bisulfite sequencing analysis of CpG methylation in the APOB promoter in qHSCs and aHSCs. Five CpGs were analyzed.
Figure 5
Figure 5. Histone H3 methylation and acetylation occupancy on promoters of aHSC- and qHSC-associated genes
ChIP analysis of DNA isolated from freshly isolated human qHSCs and cultured induced aHSCs. A. qHSC associated genes. B. aHSC associated genes. The main graphs show the percentage enrichment of H3K4me1, H3K4me3, H3K27me3 and H3K27ac relative to input, in human qHSCs and aHSCs. The right insert panels show the fold increase or decrease in mRNA levels for the respective gene during human HSC activation in vitro.
Figure 6
Figure 6. Identification of putative novel enhancer elements for the pro-fibrotic COL4A1, LOXL1 and LOXL2 genes
A. Schematic representation of putative poised or active enhancers upstream or downstream of the COL4A1, LOXL1 and LOXL2 TSS. Two intragenic poised putative enhancer regions were identified 69 kb and 90 kb downstream of the COL4A1 TSS. Intragenic active and downstream poised putative enhancers were identified 14 kb and 39 kb downstream of the LOXL1 TSS respectively, and an upstream active putative enhancer was identified 6.5 kb upstream of LOXL2 TSS. B. Graphs showing the percentage enrichment of H3K4me1 and H3K27ac relative to input, in human qHSCs and aHSCs, at the sites shown in (A) IR, DR, UR; Intragenic, downstream, upstream region.

References

    1. Bataller R, Brenner DA. Liver fibrosis. The Journal of Clinical Investigation. 2005;115:209–218. - PMC - PubMed
    1. Davis GL, Dempster J, Meler JD, Orr DW, Walberg MW, Brown B, Berger BD, O’Connor JK, Goldstein RM. Hepatocellular carcinoma: management of an increasingly common problem. Proceedings (Baylor University Medical Center) 2008;21:266–280. - PMC - PubMed
    1. Canbay A, Friedman S, Gores GJ. Apoptosis: The nexus of liver injury and fibrosis. Hepatology. 2004;39:273–278. - PubMed
    1. DeLeve LD. Liver sinusoidal endothelial cells in hepatic fibrosis. Hepatology. 2015;61:1740–1746. - PMC - PubMed
    1. Mederacke I, Hsu CC, Troeger JS, Huebener P, Mu X, Dapito DH, Pradere J-P, Schwabe RF. Fate tracing reveals hepatic stellate cells as dominant contributors to liver fibrosis independent of its aetiology. Nature Communications. 2013;4:2823. - PMC - PubMed

Publication types

MeSH terms