. 2015 Sep 10:6:8164.
doi: 10.1038/ncomms9164.

Blood coagulation protein fibrinogen promotes autoimmunity and demyelination via chemokine release and antigen presentation

Affiliations

Blood coagulation protein fibrinogen promotes autoimmunity and demyelination via chemokine release and antigen presentation

Jae Kyu Ryu et al. Nat Commun. .

Abstract

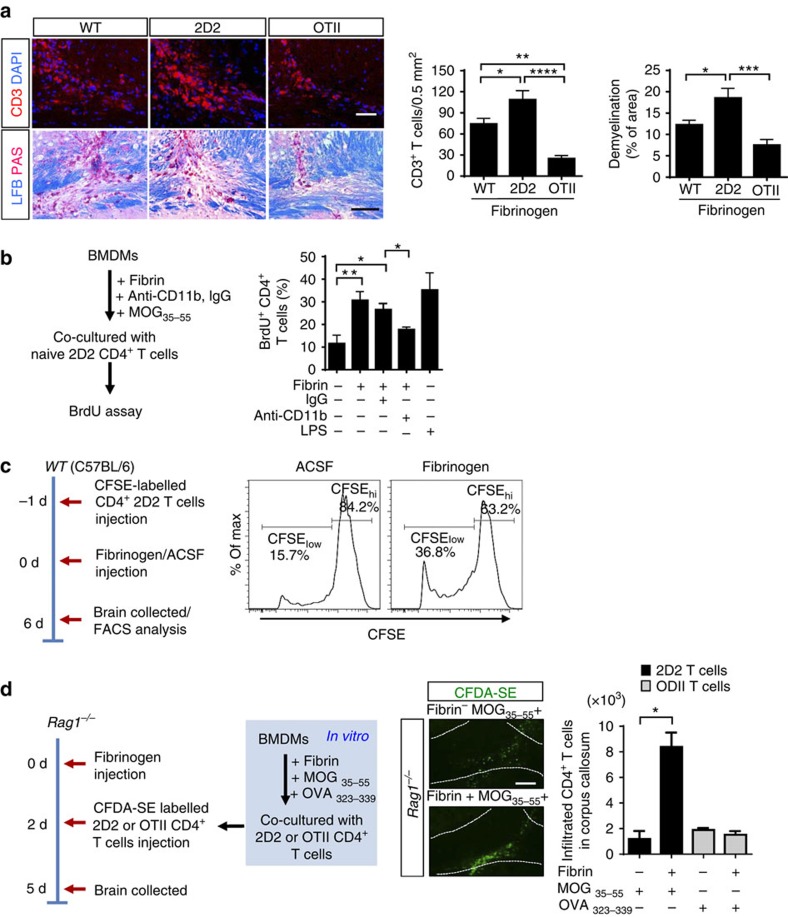
Autoimmunity and macrophage recruitment into the central nervous system (CNS) are critical determinants of neuroinflammatory diseases. However, the mechanisms that drive immunological responses targeted to the CNS remain largely unknown. Here we show that fibrinogen, a central blood coagulation protein deposited in the CNS after blood-brain barrier disruption, induces encephalitogenic adaptive immune responses and peripheral macrophage recruitment into the CNS leading to demyelination. Fibrinogen stimulates a unique transcriptional signature in CD11b(+) antigen-presenting cells inducing the recruitment and local CNS activation of myelin antigen-specific Th1 cells. Fibrinogen depletion reduces Th1 cells in the multiple sclerosis model, experimental autoimmune encephalomyelitis. Major histocompatibility complex (MHC) II-dependent antigen presentation, CXCL10- and CCL2-mediated recruitment of T cells and macrophages, respectively, are required for fibrinogen-induced encephalomyelitis. Inhibition of the fibrinogen receptor CD11b/CD18 protects from all immune and neuropathologic effects. Our results show that the final product of the coagulation cascade is a key determinant of CNS autoimmunity.


Figures

Figure 1
Figure 1. Induction of T-cell recruitment and inflammatory demyelination by a single fibrinogen injection in the CNS.
(a) Demyelination (LFB/PAS and toluidine blue), microglial activation and demyelination (MBP/Iba-1), and T-cell infiltration (CD3) in the corpus callosum of mice injected with fibrinogen compared with ACSF control. Scale bar, 100 μm (top panel); 10 μm (second panel); 100 μm (third panel); 80 μm (bottom panel). Representative histological sections from day 7 after injection are shown. Data are presented as mean±s.e.m. (n=5–6 mice per time point). *P<0.05, ***P<0.001, ****P<0.0001 (two-way ANOVA and Bonferroni's multiple comparisons test). (b) FACS analysis of T cells isolated from the brain (corpus callosum) 7 days after fibrinogen or ACSF injection stained with CD3, CD4 and CD8 (n=3 independent experiments; each experiment generated from pooled brain cells from n=3–4 mice). ANOVA, analysis of variance; d, days; FACS, fluorescence-activated cell sorting; LFB, Luxol fast blue.
Figure 2
Figure 2. Adaptive immunity and antigen presentation are required for fibrinogen-induced demyelination.
(a) Affymetrix microarray gene expression analysis and enrichment of gene ontology (GO) of fibrinogen-injected or ACSF-injected corpus callosum at 12 h post injection. Heatmaps of the 142 genes with ≥1.5 × change in expression between ACSF and fibrinogen. (b) Affymetrix microarray gene expression analysis of fibrin-stimulated rat primary microglia at 6 h in vitro. Heatmap and GO analysis of gene expression profiles of 1,342 genes with ≥1.5 × change in expression between unstimulated and fibrin treatment. (c) Affymetrix microarray gene expression analysis of fibrin-stimulated mouse APCs at 6 h in vitro. Heatmap and GO analysis of gene expression profiles of key genes with ≥1.5 × change in expression (left). Heatmap of the M1-related genes with ≥2.0 × change in expression after fibrin stimulation (right). (d) FACS analysis of CD86 expression in APCs after fibrin stimulation. LPS was used as positive control. Anti-CD11b antibody treatment reduces CD86 expression in APCs. Real-time PCR analysis of CD86 gene expression in BMDMs after fibrin stimulation treated with anti-CD11b or IgG isotype control antibody. Data are presented as mean±s.e.m. (n=4 independent experiments; right). **P<0.01, ***P<0.001, ****P<0.0001 (one-way ANOVA). (e) Demyelination (LFB/PAS) in the corpus callosum of WT, MHC II−/− or RAG2−/−γc−/− mice 7 days after fibrinogen injection. Representative images are shown. Scale bar, 100 μm. Data are presented as mean±s.e.m. (n=6 mice per group). **P<0.01, ***P<0.001 (one-way ANOVA and Bonferroni's multiple comparisons test). ANOVA, analysis of variance; FACS, fluorescence-activated cell sorting; LFB, Luxol fast blue.
Figure 3
Figure 3. Extravascular fibrinogen drives myelin-specific T cells into the CNS.
(a) T-cell infiltration (CD3) and demyelination (LFB/PAS) in the corpus callosum of WT, 2D2 and OT-II mice 7 days after fibrinogen injection. Scale bars, 100 μm (top panel); 200 μm (bottom panel). Quantification of CD3+ T cells and demyelination at 7 days after fibrinogen injection. Data are presented as mean±s.e.m. (n=6 mice per group). *P<0.05, **P<0.01, ***P<0.001, ****P<0.0001 by one-way ANOVA and Bonferroni's multiple comparisons test. (b) BMDMs treated with fibrin alone or in the presence of anti-CD11b or isotype IgG antibody control were co-cultured with naive 2D2 CD4+ T cells. BrdU proliferation assay in response to MOG35–55 peptide after fibrin stimulation and anti-CD11b treatment. LPS was used as positive control. Data are presented as mean±s.e.m. (n=3–4 independent experiments, *P<0.05, **P<0.01 by one-way ANOVA and Bonferroni's multiple comparisons test). (c) WT recipient mice received CFSE-labelled CD4+CD62L+ 2D2 T cells (0 d) and 1 day later fibrinogen or ACSF were injected in the corpus callosum. CFSE-labelled 2D2 T cells were isolated from the brains of fibrinogen- or ACSF-injected mice 6 days later and analysed by FACS. FACS plots and quantification showing CFSE dilution (CFSElow) indicate proliferation of 2D2 T cells in fibrinogen-injected brain. Data are representative of two independent experiments, each from pooled brain cells from n=4 mice. (d) Naive CD4+ 2D2 or control OT-II T cells were co-cultured with BMDMs treated with the indicated peptides, MOG35–55 or OVA323–339 alone or peptide in the presence of fibrin. CFDA-SE-labelled 2D2 or OT-II T cells were transferred into Rag1−/− mice injected with fibrinogen in the corpus callosum. CFDA-SE+ T cells (green) in the corpus callosum (dashed line) of Rag1−/− mice. Scale bar, 100 μm. Quantification shows increased 2D2 T cells after co-culture with BMDMs treated with both fibrin and MOG35–55, compared with fibrin and OVA323–339 or MOG35–55 alone. Data are presented as mean±s.e.m. (n=4 mice per group, *P<0.05 by non-parametric Mann–Whitney U-test). ANOVA, analysis of variance; d, days; FACS, fluorescence-activated cell sorting; LFB, Luxol fast blue.
Figure 4
Figure 4. Fibrinogen drives accumulation of myelin antigen-specific T cells.
(a) Experimental design diagram: C57BL/6 mice were stereotaxically injected with fibrinogen or ACSF in the corpus callosum. Seven days after injection, lymphocytes were prepared from draining lymph nodes and stimulated with MOG35–55 for 7 d. I-Ab MOG35–55 tetramer was used to detect myelin-specific CD4+ T cells in fibrinogen-injected WT mice. I-Ab OVA323–339 tetramer was used as a negative control for MOG35–55 tetramer staining. (b) Flow cytometry analysis of I-Ab MOG35–55 tetramer stained CD4+ T cells 7 days after MOG35–55 stimulation. No tetramer-positive cells were detected with I-Ab OVA323–339 tetramer. Graph shown number of I-Ab MOG35–55 tetramer stained CD4+ T cells. Data are presented as mean±s.e.m., n=8–9, with each sample being pooled from 2–3 mice from three independent experiments. ***P<0.001 (non-parametric Mann–Whitney U-test). (c) Proliferation analysis of BrdU incorporation in CD4+ T cells of ACSF- and fibrinogen-injected mice, stimulated with MOG35–55 for 7 days. Data are presented as mean±s.e.m. (four independent experiments with pooled cells from 2–3 mice per experiment for ACSF and fibrinogen), *P<0.05 (non-parametric Mann–Whitney U-test). d, days.
Figure 5
Figure 5. Fibrin induces activation of innate immunity via CD11b/CD18 to induce Th1-cell differentiation.
(a) BMDMs treated with fibrin or in the presence of anti-CD11b or isotype IgG antibody control were co-cultured with naive WT CD4+ T cells and analysed for gene expression or by FACS. Gene expression analysis of transcriptional factors indicative of Th1, Th2, Th17 and Treg cells in CD4+ T cells co-cultured with fibrin-stimulated BMDMs. Data are presented as mean±s.e.m. (n=4 independent experiments, *P<0.05 by non-parametric Mann–Whitney U-test). (b) Gated percentage of IFN-γ- or IL-4-expressing CD4+ T cells after co-culture with fibrin-stimulated BMDMs in the presence of rat IgG isotype control antibody or anti-CD11b antibody. Data are presented as mean±s.e.m. (n=3 independent experiments, *P<0.05, **P<0.01, ***P<0.001 by one-way ANOVA and Bonferroni's multiple comparisons test). Real-time PCR analysis of Th1-inducing cytokine IL-12p40 in fibrin-stimulated BMDMs in the presence or absence of anti-CD11b antibody. Data are presented as mean±s.e.m. (n=3–4 independent experiments, *P<0.05, **P<0.01 by one-way ANOVA and Bonferroni's multiple comparisons test). (c) Real-time PCR analysis of transcription factors and cytokines indicative of Th1, Th2, Th17 and Treg cells in the corpus callosum at 3 days after ACSF or fibrinogen injection. Data are presented as mean±s.e.m. (n=3–5 mice per group). *P<0.05 (non-parametric Mann–Whitney U-test). (d) Comparison of IFN-γ-, IL-4- and IL-17-producing cells in infiltrated CD4+ and CD8+ T cells isolated from the brains and spleens after ACSF or fibrinogen injection at day 7 post injection. Data are presented as mean±s.e.m. (n=3 independent experiments, *P<0.05, ***P<0.001 by one-way ANOVA and Bonferroni's multiple comparisons test). (e) IFN-γ and IL-4 expression in CD4+ lymph node T cells isolated from saline- or fibrin-depleted (ancrod) mice after PLP139–151-induced EAE and restimulated in vitro with PLP139–151. Data are presented as mean±s.e.m. (n=6 mice per group, *P<0.05, **P<0.01 by non-parametric Mann–Whitney U-test). ANOVA, analysis of variance; FACS, fluorescence-activated cell sorting; Treg, regulatory T cell.
Figure 6
Figure 6. Fibrinogen induces recruitment of peripheral macrophages into the CNS via CD11b/CD18-mediated upregulation of CCL2.
(a) Infiltration of peripheral Ccr2+ macrophages (RFP, red) in the corpus callosum 7 days after fibrinogen injection in Ccr2RFP/+Cx3cr1GFP/+. Scale bar, 200 μm. Quantification of RFP (top graph) and GFP (bottom graph) intensity in the same sections of corpus callosum of ACSF- or fibrinogen-injected Ccr2RFP/+Cx3cr1GFP/+mice on days 1, 3 and 7. Data are presented as mean±s.e.m. (n=4–6 mice per time point). *P<0.05, **P<0.01, ***P<0.001, ****P<0.0001 (two-way ANOVA and Bonferroni's multiple comparisons test). (b) Infiltration of peripheral Ccr2+ macrophages (RFP, red) in the corpus callosum 7 days after fibrinogen injection in Ccr2RFP/+- and Ccr2-deficient (Ccr2RFP/RFP) mice at 7 days post-fibrinogen injection. Scale bar, 50 μm. Quantification of infiltrated CD3+ T cells (top graph) and demyelinated area (bottom graph) in the corpus callosum of Ccr2RFP/+- and Ccr2-deficient (Ccr2RFP/RFP) mice 7 days after fibrinogen injection. Data are presented as mean±s.e.m. (n=6–7 mice per group). **P<0.01 (non-parametric Mann–Whitney U-test). (c) Real-time PCR analysis of Ccl2 gene expression in corpus callosum 12 h after injection of ACSF and plasma obtained from WT, Fibγ390–396A Fib−/− or mice. Data are presented as mean±s.e.m. (n=4 mice per group). *P<0.05, **P<0.01 (one-way ANOVA and Bonferroni's multiple comparisons test). ANOVA, analysis of variance; d, days.
Figure 7
Figure 7. Genetic inhibition of CD11b blocks fibrinogen-induced microglial activation and inflammatory demyelination.
(a) Quantification of microglial activation (IBA-1), T-cell infiltration (CD3) and demyelination (LFB/PAS) 7 days after fibrinogen injection in the corpus callosum of Itgam−/− or control WT mice (n=6). Data are presented as mean±s.e.m. *P<0.05, **P<0.01 (non-parametric Mann–Whitney U-test). (b) Fibrinogen-induced gene expression of Cxcl10 and Ccl2 is reduced in the corpus callosum of Itgam−/− mice compared with WT control. Results are mean±s.e.m. of 6–7 mice per group, **P<0.01, ****P<0.0001 (two-way ANOVA and Bonferroni's multiple comparisons test). (c) Fibrinogen-induced gene expression of T-bet, IFN-γ and IL-12p40 is reduced in the corpus callosum of Itgam−/− mice compared with WT control (n=5–8 mice). Data are presented as mean±s.e.m. **P<0.01, ***P<0.001 (two-way ANOVA and Bonferroni's multiple comparisons test). ANOVA, analysis of variance; d, days; LFB, Luxol fast blue.
Figure 8
Figure 8. Inhibition of CD11b blocks fibrinogen-induced local T-cell activation, chemokine gene expression and peripheral inflammatory cell recruitment.
(a) Fibrinogen-induced local T-cell activation (OX-40) in the corpus callosum of WT mice is significantly reduced in Itgam−/− mice (n=4). Representative images are shown. Data are presented as mean±s.e.m. **P<0.01, ***P<0.001 (one-way ANOVA and Bonferroni's multiple comparisons test). Scale bar, 100 μm. (b) In vivo pharmacologic blockade of CD11b by intracerebroventricular delivery of anti-CD11b antibody reduces fibrinogen-induced Cxcl10 and Ccl2 gene expression, compared with isotype IgG control antibody. Data are presented as mean±s.e.m. (n=5 per group). *P<0.05, **P<0.01, ***P<0.001 (one-way ANOVA and Bonferroni's multiple comparisons test). (c) Quantification of infiltrated CD3+ T cells and RFP+ macrophages in the corpus callosum 7 days after injection of fibrinogen in WT mice treated with anti-CD11b or IgG isotype control antibody. Data are presented as mean±s.e.m. (CD3, n=6–7 mice per group; RFP, n=7 mice per group). *P<0.05, **P<0.01 (non-parametric Mann–Whitney U-test). (d) Proposed model for the role of fibrin, the final product of the coagulation cascade, in the development of CNS autoimmunity. On BBB disruption, fibrinogen extravagates into the CNS and is converted to fibrin upon activation of coagulation. Fibrin, the high-affinity plasma-derived ligand for CD11b/CD18, activates CNS resident innate immune cells (microglia and perivascular macrophages) to stimulate chemokine release leading to recruitment of peripheral inflammatory macrophages/monocytes and T cells. Fibrin also induces antigen-presenting properties and provides instructive signals (such as IL-12) for inducing Th1-cell differentiation. Fibrin-induced microglial activation, recruitment of peripheral macrophages and T-cell activation lead to inflammatory demyelination. ANOVA, analysis of variance.

References

    1. Davalos D. & Akassoglou K. Fibrinogen as a key regulator of inflammation in disease. Semin. Immunopathol. 34, 43–62 (2012). - PubMed
    1. Marik C., Felts P. A., Bauer J., Lassmann H. & Smith K. J. Lesion genesis in a subset of patients with multiple sclerosis: a role for innate immunity? Brain 130, 2800–2815 (2007). - PMC - PubMed
    1. Vos C. M. et al. Blood-brain barrier alterations in both focal and diffuse abnormalities on postmortem MRI in multiple sclerosis. Neurobiol. Dis. 20, 953–960 (2005). - PubMed
    1. Davalos D. et al. Early detection of thrombin activity in neuroinflammatory disease. Ann. Neurol. 75, 303–308 (2014). - PMC - PubMed
    1. Davalos D. et al. Fibrinogen-induced perivascular microglial clustering is required for the development of axonal damage in neuroinflammation. Nat. Commun. 3, 1227 (2012). - PMC - PubMed

Publication types

MeSH terms