. 2015 Sep 22;112(38):11864-9.
doi: 10.1073/pnas.1516237112. Epub 2015 Sep 9.

Akt1/protein kinase B enhances transcriptional reprogramming of fibroblasts to functional cardiomyocytes

Affiliations

Akt1/protein kinase B enhances transcriptional reprogramming of fibroblasts to functional cardiomyocytes

Huanyu Zhou et al. Proc Natl Acad Sci U S A. .

Abstract

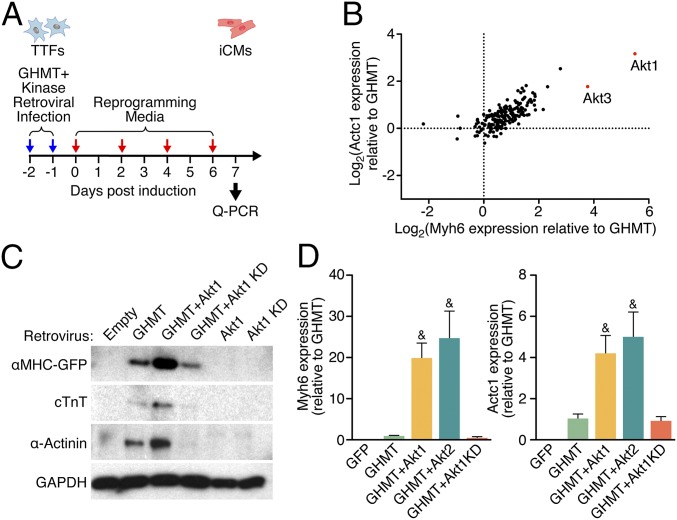
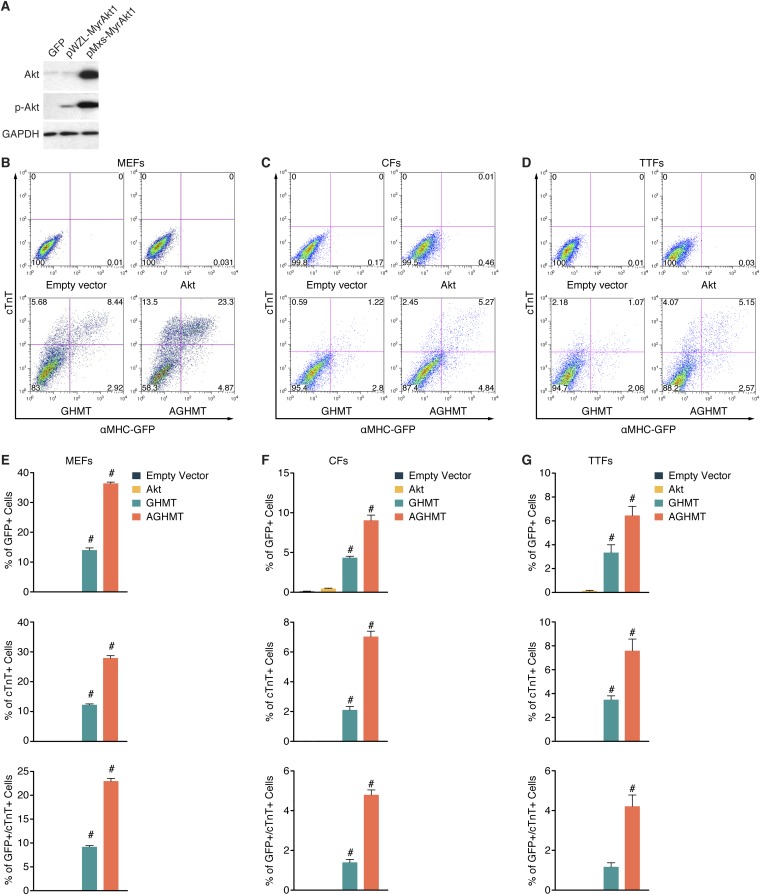
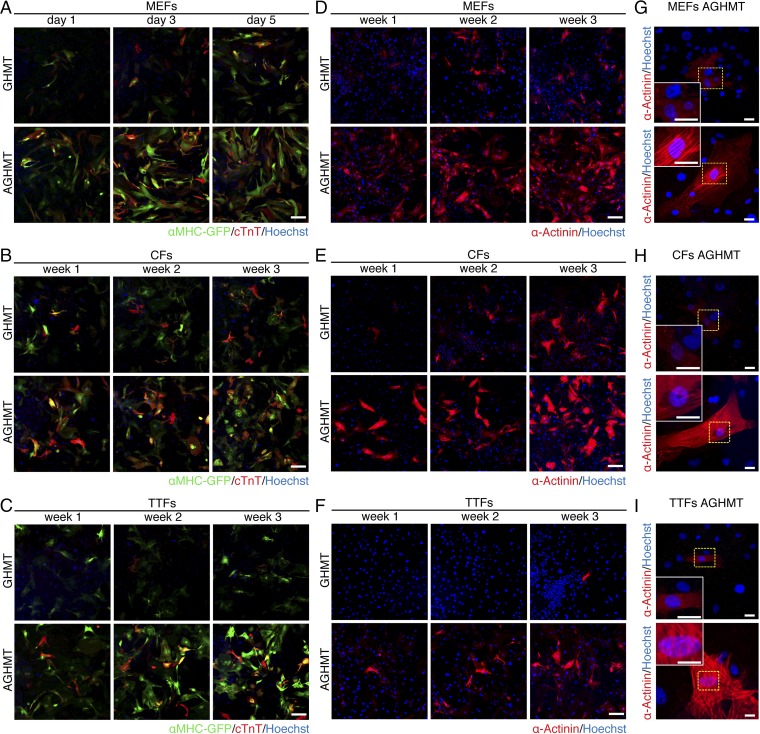
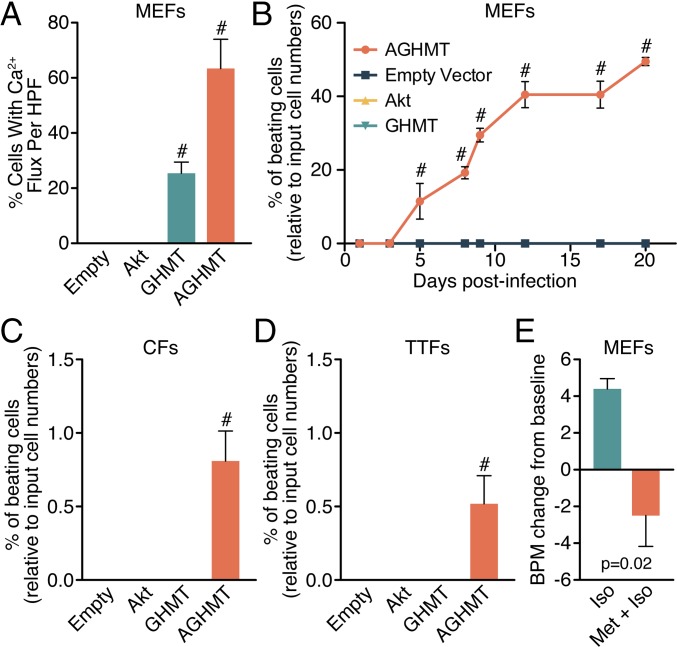
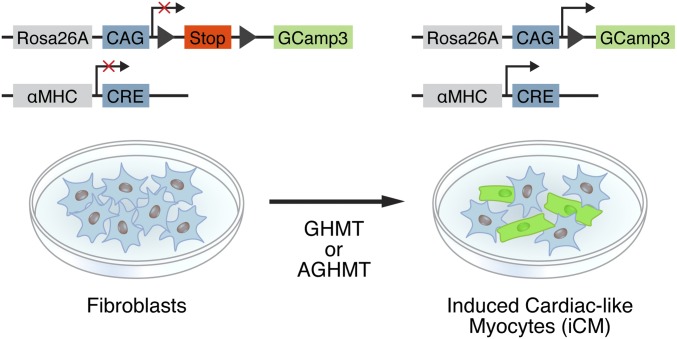
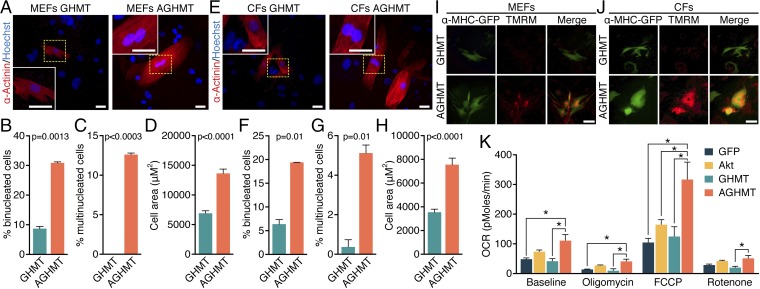
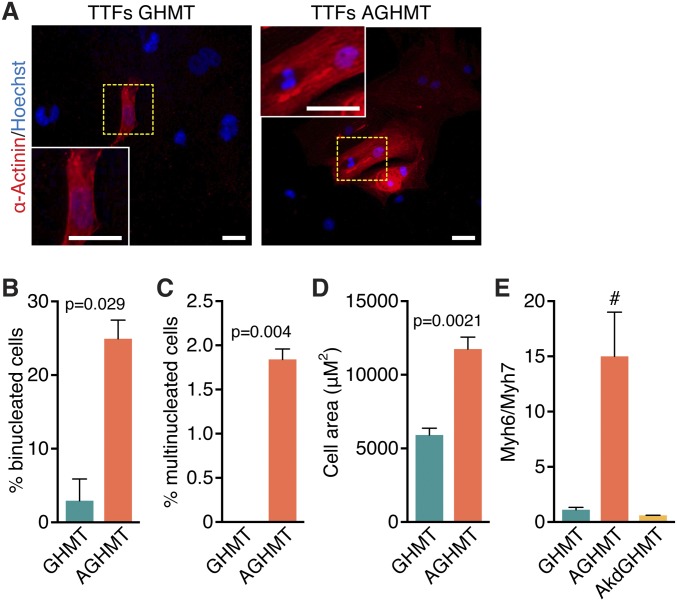
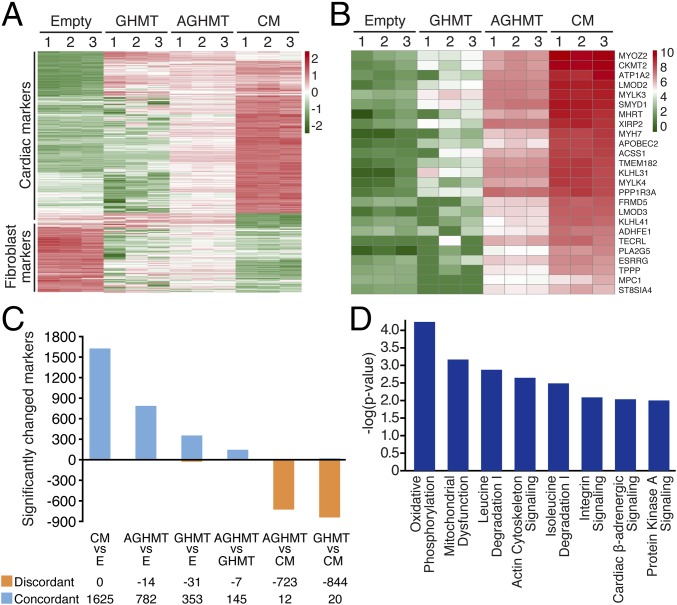
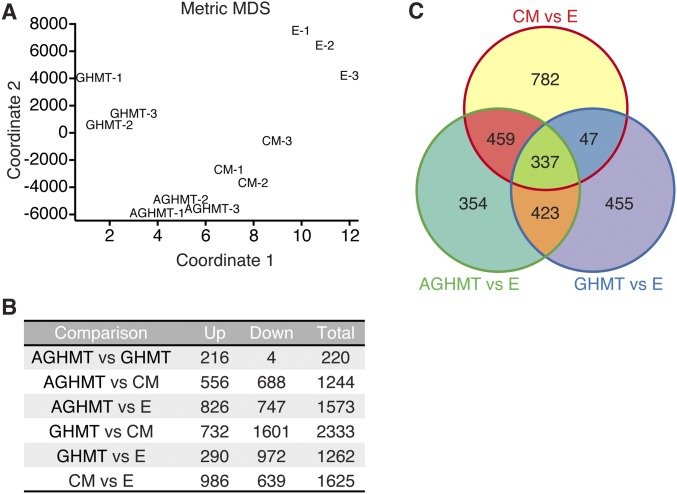
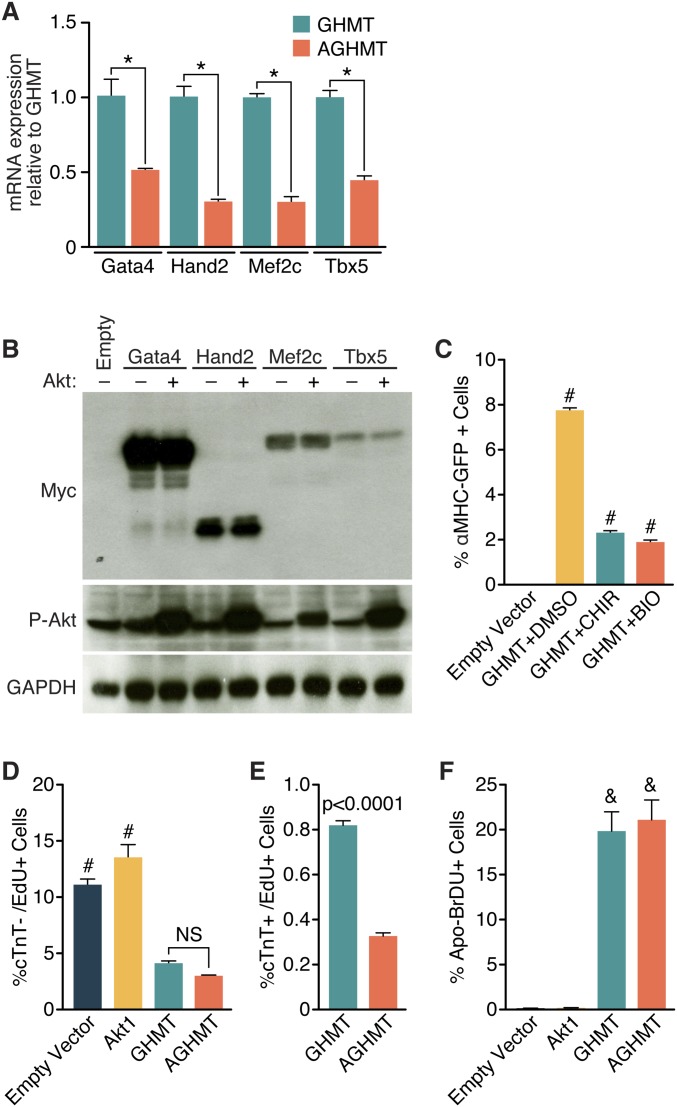
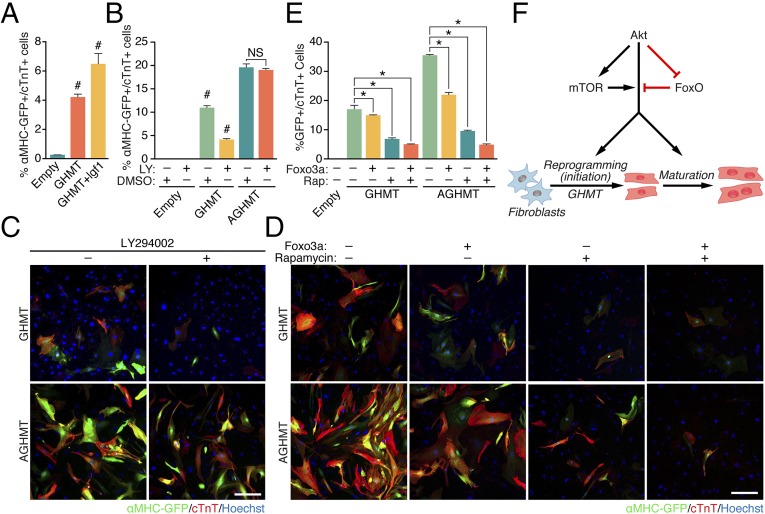
Conversion of fibroblasts to functional cardiomyocytes represents a potential approach for restoring cardiac function after myocardial injury, but the technique thus far has been slow and inefficient. To improve the efficiency of reprogramming fibroblasts to cardiac-like myocytes (iCMs) by cardiac transcription factors [Gata4, Hand2, Mef2c, and Tbx5 (GHMT)], we screened 192 protein kinases and discovered that Akt/protein kinase B dramatically accelerates and amplifies this process in three different types of fibroblasts (mouse embryo, adult cardiac, and tail tip). Approximately 50% of reprogrammed mouse embryo fibroblasts displayed spontaneous beating after 3 wk of induction by Akt plus GHMT. Furthermore, addition of Akt1 to GHMT evoked a more mature cardiac phenotype for iCMs, as seen by enhanced polynucleation, cellular hypertrophy, gene expression, and metabolic reprogramming. Insulin-like growth factor 1 (IGF1) and phosphoinositol 3-kinase (PI3K) acted upstream of Akt whereas the mitochondrial target of rapamycin complex 1 (mTORC1) and forkhead box o3 (Foxo3a) acted downstream of Akt to influence fibroblast-to-cardiomyocyte reprogramming. These findings provide insights into the molecular basis of cardiac reprogramming and represent an important step toward further application of this technique.

Keywords: cardiogenesis; cardiomyopathy; heart; regeneration; transdifferentiation.


Conflict of interest statement

The authors declare no conflict of interest.

Figures

Fig. 1.
Fig. 1.
A kinase screen identifies Akt as an enhancer of cardiac reprogramming by GHMT. (A) Protocol for reprogramming and the kinase library screen. (B) Transcript levels measured by qPCR 7 d after TTF induction with GHMT plus either GFP or one of the retrovirally expressed kinases. This log–log plot is normalized to expression with GHMT+GFP and shows that Akt1 and Akt3 caused the greatest increases in cardiac marker expression. (C) Detection of cardiac markers by Western blot of protein lysates from αMHC-GFP transgenic MEFs a week after induction with the indicated retroviruses. KD, kinase dead. (D) Transcript levels of Myh6 and Actc1 were increased a week after induction by adding Akt1 or Akt2 to GHMT in TTFs. &P < 0.05 vs. all others unless also labeled with “&.”
Fig. S1.
Fig. S1.
Akt enhances cardiac reprogramming by GHMT. (A) Western blot of Akt and phospho-Akt in TTFs 7 d after infection with the indicated retroviral Akt expression cassettes. (B–D) Representative flow cytometry plot and (E–G) analyses of αMHC-GFP+ and cTnT+ cells in MEFs, CFs, or TTFs, after infection with control, Akt, GHMT, or AGHMT retrovirus at indicated times (5 d for MEFs, 1 wk for CFs and TTFs). #P < 0.05 vs. all others.
Fig. 2.
Fig. 2.
Akt enhances cardiac reprogramming by GHMT. (AC) Immunocytochemistry of αMHC-GFP transgenic MEFs, CFs, and TTFs, respectively, at the indicated times showed more cells positive for GFP (green) and cTnT (red) with AGHMT compared with GHMT. (Scale bars: 200 µm.) (DF) α-Actinin immunocytochemistry (red) of MEFs, CFs, and TTFs, respectively, at the indicated times showed enhanced reprogramming upon addition of Akt1 to GHMT. (Scale bars: 200 µm.) (GI) α-Actinin staining of MEFs, CFs, and TTFs showed striations suggestive of sarcomere formation by 7 d of induction in AGHMT but not GHMT (two weeks for TTFs). (Scale bars: 25 µm.)
Fig. 3.
Fig. 3.
Akt1 promotes spontaneous calcium flux and cellular beating in iCMs. (A) Spontaneous calcium flux assessed in MEFs a week after induction with AGHMT compared with GHMT. (BD) AGHMT enhances spontaneous cellular beating compared with GHMT treatment in MEFs, CFs (at 2 wk), and TTFs (at 3 wk), respectively, with about half of MEFs displaying spontaneous beating by 3 wk of AGHMT treatment. (E) Change from baseline spontaneous cellular beating rate (21 BPM) in MEFs 3 wk after induction and after β-adrenoreceptor modulation with the agonist isoproterenol (Iso) and the antagonist metoprolol (Met). #P < 0.05 vs. all others. BPM, beats per minute; HPF, high-power field.
Fig. S2.
Fig. S2.
Strategy for measuring calcium flux. MEFs derived from αMHC-Cre/Rosa26A-Flox-Stop-Flox-GCaMP3 transgenic mice were reprogrammed to iCMs by addition of GHMT or AGHMT and exhibit spontaneous cyclic autofluorescence concomitant with calcium flux.
Fig. 4.
Fig. 4.
Addition of Akt1 to GHMT stimulates maturation of iCMs. (A and E) α-Actinin immunostaining shows mononucleate or binucleate iCM 3 wk after induction with GHMT or AGHMT in MEFs (A) and CFs (E). (Scale bars: 25 µm.) (B and C and F and G) Quantification of the percentage of iCMs with more than a single nucleus (binucleate, two nuclei; multinucleate, three or more nuclei) 3 wk after AGHMT treatment reveals an increase relative to cells treated with GHMT in MEFs (B and C) and CFs (F and G). (D and H) Size of iCMs was approximately doubled by addition of Akt1 to GHMT, as shown here in MEFs (D) and CFs (H) 3 wk after induction after immunocytochemistry for α-actinin. (I and J) Immunocytochemistry of MEFs (I) and CFs (J) 2 wk after induction shows that mitochondrial activity was increased in iCMs; tetramethylrhodamine methyl ester (TMRM) in red and αMHC-GFP transgene expression in green. (Scale bars: 100 µm.) (K) Oxygen consumption rates in MEFs a week after induction showed increased baseline levels for AGHMT-treated cells compared with non–Akt1-treated cells, and AGHMT-treated cells also had increased maximal oxygen consumption compared with other treatment groups (n = 4, except Akt, where n = 3, analyzed as a separate one-way ANOVA for each drug treatment). *P < 0.05.
Fig. S3.
Fig. S3.
Addition of Akt1 to GHMT stimulates maturation of iCMs in TTFs. (A) α-Actinin immunostaining shows binucleate iCM 3 wk after induction with GHMT and AGHMT. (Scale bars: 25 μm.) (B and C) Quantification of the percentage of iCMs with more than a single nucleus (binucleate, two nuclei; multinucleate, three or more nuclei) 3 wk after AGHMT treatment reveals an increase relative to cells treated with GHMT. (D) Size of iCMs was approximately doubled by addition of Akt1 to GHMT, as shown here 3 wk after induction after immunocytochemistry for α-actinin. (E) The ratio of Myh6:Myh7 by qPCR in TTFs 1 wk after induction suggests that adding Akt1 to GHMT results in more mature iCMs whereas a kinase dead mutant of Akt1 abrogates this effect. #P < 0.05 vs. all others.
Fig. 5.
Fig. 5.
Comprehensive expression analysis by RNA-Seq shows that AGHMT iCMs are more similar to adult mouse ventricular cardiomyocytes than GHMT iCMs. (A and B) Heatmaps of RNA expression data illustrating differentially expressed markers in empty vector, GHMT, AGHMT, and CMs. Red indicates up-regulated markers, and green indicates down-regulated markers. (C) Restricting analysis to the 1,625 markers that differed between CMs and MEFs and only counting those that changed expression in the same direction as CMs, 782 changed for AGHMT whereas only 353 changed for GHMT. These findings suggest that AGHMT iCMs are more similar to mature CMs than GHMT iCMs. Notably, AGHMT and GHMT iCMs had only 14 and 31 markers, respectively, that changed to look more like MEFs. (D) Analysis showed expression changes in key pathways between GHMT and AGHMT iCMs, indicating a more cardiomyocyte-like phenotype with AGHMT.
Fig. S4.
Fig. S4.
RNA-Seq global analysis shows that AGHMT iCMs are more similar to mature CM than GHMT iCMs. (A) Multidimensional scaling (MDS) plot showing RNA-Seq sample relatedness based on 2D coordinates. Distance measurements were calculated using normalized RNA expression values from all expressed markers in each sample. (B) Count table for differentially expressed markers for various sample group comparisons using fold change cutoff of ≥2 and P value of ≤0.01. (C) Venn diagram showing number of overlapping markers between GHMT, AGHMT, and CM compared with empty vector control. Marker counts include both up-regulated and down-regulated genes.
Fig. S5.
Fig. S5.
Processes not involved in the mechanism by which Akt1 enhances GHMT-mediated formation of iCMs. (A) Measurement of Gata4, Hand2, Mef2c, or Tbx5 transcript by qPCR after 7 d of induction in GHMT- or AGHMT-treated MEFs. (B) Western blot of myc-tagged GHMT proteins in the presence or absence of Akt1 in MEFs after 2 d of induction. (C) Flow cytometry analysis after 7 d of GHMT treatment in MEFs (derived from aMHC-GFP mice) in the presence or absence of CHIR99021 (CHIR) or BIO. (D and E) Flow cytometry analysis of MEFs treated with Edu for 1 h following 7 d induction with control, Akt, GHMT, or AGHMT. Cardiac troponin T (cTnT) labels iCMs and Edu labels proliferating cells. (F) Flow cytometry analysis was used to measure apoptosis of MEFs following 7 d induction with control, Akt, GHMT, or AGHMT. Addition of Akt had no significant effect on apoptosis as measured by this assay. *P < 0.05; #P < 0.05 vs. all others; &P < 0.05 vs. all others unless also labeled with “&”.
Fig. 6.
Fig. 6.
Akt1 enhancement of GHMT-mediated reprogramming relies on signaling through IGF1, PI3K, mTORC1, and Foxo3a. (A) IGF1 (300 ng/mL) enhanced the proportion of MEFs expressing cardiac markers detected by flow cytometry a week after induction. (B and C) A similar experiment using pharmacologic inhibition of PI3K activity ± genetic rescue by Akt1 suggested that PI3K activity may stimulate GHMT-mediated transdifferentiation into iCMs. LY, LY294002 (PI3K antagonist). (Scale bar: 200 µm.) (D and E) After 7 d induction of MEFs, we also found that pharmacologic inhibition of mTORC1 and/or genetic addition of Foxo3a incrementally attenuated formation of iCMs (rapamycin, mTORC1 antagonist). (Scale bar: 200 µm.) Upon treatment with both rapamycin and Foxo3a, residual formation of iCMs was equal when comparing GHMT and AGHMT treatments. (F) Proposed mechanism of action by which Akt1 enhances GHMT-mediated formation of induced cardiac-like myocytes. *P < 0.05; #P < 0.05 vs. all others.

Comment in

References

    1. Xin M, Olson EN, Bassel-Duby R. Mending broken hearts: Cardiac development as a basis for adult heart regeneration and repair. Nat Rev Mol Cell Biol. 2013;14(8):529–541. - PMC - PubMed
    1. Ieda M, et al. Direct reprogramming of fibroblasts into functional cardiomyocytes by defined factors. Cell. 2010;142(3):375–386. - PMC - PubMed
    1. Inagawa K, et al. Induction of cardiomyocyte-like cells in infarct hearts by gene transfer of Gata4, Mef2c, and Tbx5. Circ Res. 2012;111(9):1147–1156. - PubMed
    1. Jayawardena TM, et al. MicroRNA induced cardiac reprogramming in vivo: Evidence for mature cardiac myocytes and improved cardiac function. Circ Res. 2015;116(3):418–424. - PMC - PubMed
    1. Nam YJ, et al. Reprogramming of human fibroblasts toward a cardiac fate. Proc Natl Acad Sci USA. 2013;110(14):5588–5593. - PMC - PubMed

Publication types

Associated data