. 2015 Sep 22;112(38):E5351-60.
doi: 10.1073/pnas.1515982112. Epub 2015 Sep 9.

Automated measurement of mouse social behaviors using depth sensing, video tracking, and machine learning

Affiliations

Automated measurement of mouse social behaviors using depth sensing, video tracking, and machine learning

Weizhe Hong et al. Proc Natl Acad Sci U S A. .

Abstract

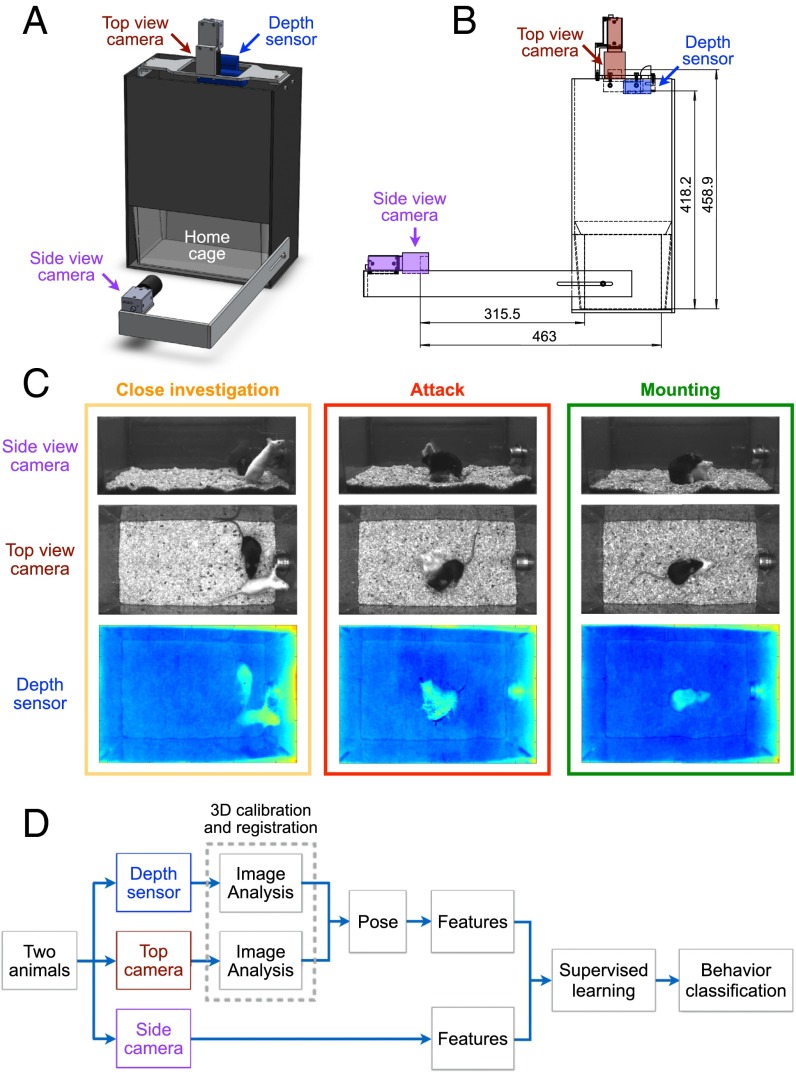
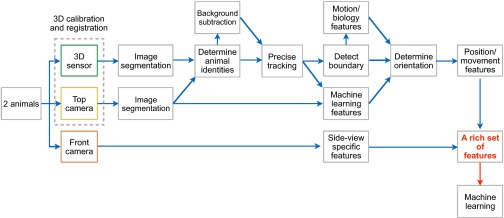
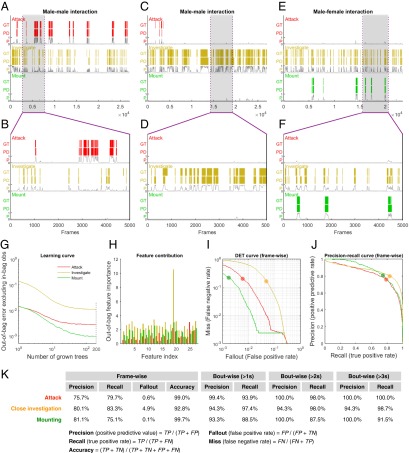
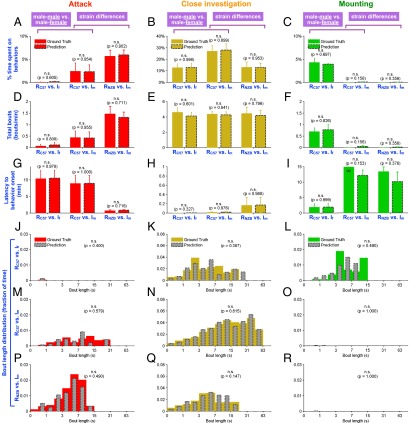
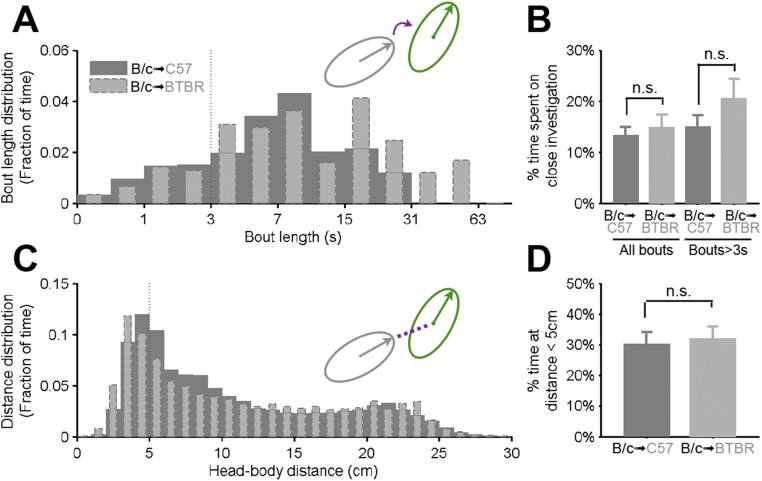
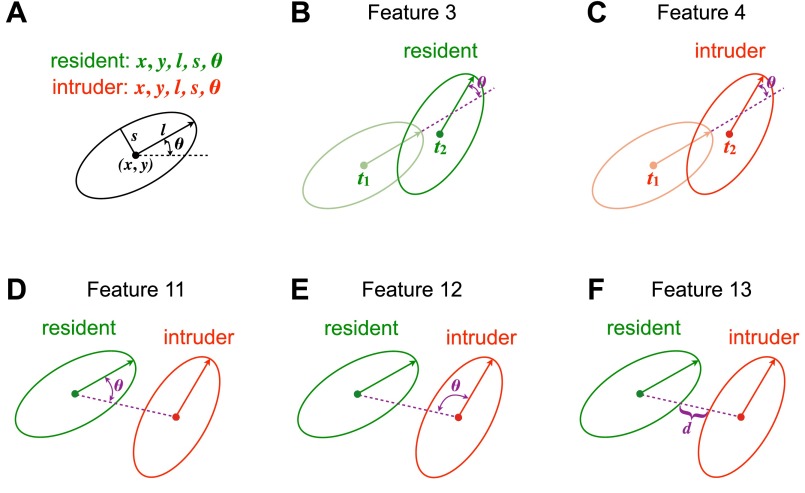
A lack of automated, quantitative, and accurate assessment of social behaviors in mammalian animal models has limited progress toward understanding mechanisms underlying social interactions and their disorders such as autism. Here we present a new integrated hardware and software system that combines video tracking, depth sensing, and machine learning for automatic detection and quantification of social behaviors involving close and dynamic interactions between two mice of different coat colors in their home cage. We designed a hardware setup that integrates traditional video cameras with a depth camera, developed computer vision tools to extract the body "pose" of individual animals in a social context, and used a supervised learning algorithm to classify several well-described social behaviors. We validated the robustness of the automated classifiers in various experimental settings and used them to examine how genetic background, such as that of Black and Tan Brachyury (BTBR) mice (a previously reported autism model), influences social behavior. Our integrated approach allows for rapid, automated measurement of social behaviors across diverse experimental designs and also affords the ability to develop new, objective behavioral metrics.

Keywords: behavioral tracking; depth sensing; machine vision; social behavior; supervised machine learning.


Conflict of interest statement

The authors declare no conflict of interest.

Figures

Fig. 1.
Fig. 1.
Equipment setup and workflow. (A and B) Schematic illustrating the customized behavior chamber. A standardized mouse cage can be placed inside the chamber. The front-view video camera is located in front of the cage, and the top-view video camera and the Senz3D sensor are located on top of the cage. Unit: millimeters. (C) Representative synchronized video frames taken from the two video cameras and the depth sensor. (D) A workflow illustrating the major steps of the postacquisition image analysis and behavior analysis.
Fig. S1.
Fig. S1.
Comparison between two depth sensors. Representative frames recorded from the Kinect Sensor from Microsoft Corporation (Left) and the Senz3D depth and gesture sensor from Creative Technology Ltd. (Right).
Fig. S2.
Fig. S2.
Detailed workflow. A workflow illustrating the individual steps of the postacquisition image analysis and behavior analysis.
Fig. 2.
Fig. 2.
Image processing, animal tracking, and pose estimation. (A) Schematic illustrating the setup of the top-view video camera and the depth sensor on top of the cage. The top-view camera and depth sensor were placed as close as possible to minimize the parallax effect. Unit: millimeters. (B) MATLAB-generated schematic showing 3D registration of the top-view video camera and the depth sensor into a common coordinate system. Locations of checkerboard patterns (Methods and Fig. S3) used for calibration are shown on the left, and the calculated positions of the two cameras are shown on the right. (C) Pose estimation using information from both top view camera and depth sensor. An ellipse that best fits an animal detected in the segmented 3D video frames is used to describe the position, orientation, shape, and scale of the animal. Head orientation is determined by the standing position, moving direction, and a set of features extracted using a previously developed machine learning algorithm (Methods). The pose of an animal is thus described by an ellipse using a set of five parameters: centroid position (x, y), length of the long axis (l), length of the short axis (s), and head orientation (θ). (D) Validation of pose estimation against ground truth (manually annotated ellipses in individual video frames). Each histogram represents the distribution of differences of individual pose parameters and overall performance between pose estimation and ground truth (see Methods for the definition of differences of individual pose parameters and overall performance). Numbers in the parenthesis at the top of each plot represent the percentage of frames to the left of the dashed lines, which represent the 98% percentiles of the differences between two independent human observers (Fig. S5). n = 634 frames.
Fig. S3.
Fig. S3.
Registration of depth sensor and top-view camera. (AD) Representative images showing planar checkerboard patterns used to fit parameterized models for each camera. (A and B) IR images taken by the depth sensor and (C and D) monochrome images taken by the top-view camera. (EH) Projected video frames in the same coordinated systems. (E and F) A top-view camera frame (F) is projected into the original coordinate of the depth view frame (E). (G and H) A depth-view frame (H) is projected into the original coordinate of the top-view camera frame (G).
Fig. S4.
Fig. S4.
Imaging processing. (AF) Representative images showing raw images taken by the depth sensor (A) and the top-view camera (B). (D) Images with subtracted background. (C) Segmented images. (E and F) Processed images showing the resident (E) and the intruder (F).
Fig. S5.
Fig. S5.
Comparisons of pose annotations between two independent human observers. Histogram of the difference in each measured parameter among a test set of 400 movie frames annotated independently by two human observers. Dashed line indicates 98th percentiles of the difference for each measurement.
Fig. 3.
Fig. 3.
Feature extraction. (A and B) In each video frame, a set of measurements (features) is computed from the pose and height of animals, describing the state of individual animals (blue: animal 1 or the resident; magenta: animal 2 or the intruder) and their relative positions (black). See Supporting Information for a complete list and descriptions of features. Two representative video episodes, one during male–male interaction and the other during male–female interaction, are shown. The human annotations of three social behaviors are shown in the raster plot on the top. (C and D) Principle component analysis of high-dimensional framewise features. (C) The first two principal components are plotted. “Other” represents frames that were not annotated as any of the three social behaviors. (D) Variance accounted for by the first 10 principal components; bars show the fraction of variance accounted for by each component, and the line shows the cumulative variance accounted for.
Fig. 4.
Fig. 4.
Supervised classification of social behaviors. (AK) Classification of attack, mounting, and closeinvestigation using TreeBagger, a random forest classifier. (AF) Raster plots showing manual annotations of attack, close investigation, and mounting behaviors, as the ground truth, vs. the machine learning classifications of these social behaviors. Three representative videos with different experimental conditions were used as the test set. A and C illustrate two representative examples of male–male interactions. GT, ground truth; P, probability; PD, machine classification/prediction. (G) Learning curve of different behavior classifiers represented by out-of-bag errors as a function of the number of grown trees. (H) Contribution of distinct features to individual classifiers. See Supporting Information for a complete list and descriptions of features. (I) DET curve representing the false negative rate vs. the false positive rate in a framewise manner. (J) Precision-recall curve representing true positive rate vs. positive predictive value in a framewise manner. (K) Table of precision, recall, fallout, and accuracy at the level of individual frames, as well as precision and recall at the level of individual behavioral episodes (“bouts”) for a range of minimum bout durations (>1 s, >2 s, and >3 s). Classification thresholds in AF and K are 0.55 (attack), 0.5 (close investigation), and 0.4 (mounting) and are highlighted in red, orange, and green dots, respectively, in I and J.
Fig. 5.
Fig. 5.
Genetic influences on social behaviors. (AR) We examined the effects of the genetic and environmental influences on attack, mounting, and close-investigation behaviors in three different experimental conditions and validated the performance of the social behavior classifiers in these conditions. In each of panels AI, the left two bars are from trials in which C57BL/6N male residents were tested with female intruders, the middle two bars are from C57BL/6N male residents tested with male intruders, and the right two bars are from NZB/B1NJ male residents tested with male intruders. All intruders are BALB/c. (AC) Percentage of time spent on attack, close investigation, or mounting behavior during 15-min behavior sessions. (DF) Total bouts per minute of individual behaviors during the same behavior sessions. (GI) Latency to the first bout of individual behaviors during the same behavior sessions. (JR) Histograms of behavioral bout duration (fraction of total time), as measured by the classifier and as measured by hand, for each type of resident–intruder pair and each behavior class. (J, M, and P) Attack. (K, N, and Q) Close investigation. (L, O, and R) Mounting. RC57: C57N male resident; RNZB: NZB male resident; Im: BALB/c male intruder; If: BALB/c female intruder.
Fig. 6.
Fig. 6.
Detection of social deficits in BTBR animals. C57BL/6N or BTBR animals were tested with a BALB/c male in an unfamiliar, neutral cage. (A) Raster plots showing the supervised classifier-based machine annotations of social investigation behavior exhibited by C57BL/6N or BTBR tester mice in the first 5 min of their interactions with BALB/c target animals. (B) Histograms of behavioral bout duration (fraction of total time) for social investigation exhibited by C57BL/6N or BTBR animals toward BALB/c during the first 5 min of their interactions. (C) Percentage of time spent on close investigation during the same behavior sessions. (D) Distribution of the distance between centroid locations of two interacting animals (fraction of total time) during the same behavior sessions. (E) Percentage of time the centroids of two interacting animals are within 6 cm during the same behavior sessions. (F) Distribution of the distance between the front end of the subject (BTBR or C57BL/6N) and the centroid of the BALB/c animal (fraction of total time) during the same behavior sessions. Note that no significant difference between tester strains is evident using this tracker-based approach to analyze the interactions. (G) Percentage of time the front end of the tester (BTBR or C57BL/6N) mouse is within 4 cm from the centroid of the target BALB/c animals during the same behavior sessions. Metrics in D and E are based solely on output from the tracker, metrics in F and G are based on output from the tracker and pose estimator, and metrics in AC are derived from the automated behavioral classifier. See Fig. S6 for metrics equivalent to DG analyzed for the BALB/c target mouse.
Fig. S6.
Fig. S6.
Social investigation behavior and head–body distance of BALB/c animals toward C57BL/6 or BTBR. (A) Histograms of behavioral bout duration (fraction of total time) for social investigation elicited by BALB/c animals toward C57BL/6 or BTBR during the first 5 min of their interactions. (B) Percentage of time spent on close investigation during the same behavior sessions. (C) Distribution of the distance between the front end of BALB/c animal and the centroid of the subject, BTBR or C57BL/6 (fraction of total time), during the same behavior sessions. (D) Percentage of time the front end of the BALB/c animal is within 4 cm from the centroid of the subject (BTBR or C57BL/6) during the same behavior sessions.
Fig. S7.
Fig. S7.
Schematic illustrating second-order features describing the state of animals in each video frame. (A) Ten ellipse parameters (five for each animal). (B) Feature 3, describing the change of the body orientation of the resident. (C) Feature 4, describing the change of the body orientation of the resident. (D) Feature 11, describing the relative angle between body orientation of the resident and the line connecting the centroids of both animals. (E) Feature 12, describing the relative angle between body orientation of the resident and the line connecting the centroids of both animals. (F) Feature 13, describing the distance between two animals.

References

    1. Silverman JL, Yang M, Lord C, Crawley JN. Behavioural phenotyping assays for mouse models of autism. Nat Rev Neurosci. 2010;11(7):490–502. - PMC - PubMed
    1. Anderson DJ, Perona P. Toward a science of computational ethology. Neuron. 2014;84(1):18–31. - PubMed
    1. Gomez-Marin A, Paton JJ, Kampff AR, Costa RM, Mainen ZF. Big behavioral data: Psychology, ethology and the foundations of neuroscience. Nat Neurosci. 2014;17(11):1455–1462. - PubMed
    1. Spink AJ, Tegelenbosch RA, Buma MO, Noldus LP. 2001. The EthoVision video tracking system—A tool for behavioral phenotyping of transgenic mice. Physiol Behav 73(5):731–744.
    1. Noldus LP, Spink AJ, Tegelenbosch RA. EthoVision: A versatile video tracking system for automation of behavioral experiments. Behav Res Methods Instrum Comp. 2001;33(3):398–414. - PubMed

Publication types