Review
. 2016 May;19(7):1168-83.
doi: 10.1017/S1368980015002505. Epub 2015 Sep 10.

A meta-analysis of the validity of FFQ targeted to adolescents

Affiliations
Review

A meta-analysis of the validity of FFQ targeted to adolescents

Garden Tabacchi et al. Public Health Nutr. 2016 May.

Abstract

Objective: The present work is aimed at meta-analysing validity studies of FFQ for adolescents, to investigate their overall accuracy and variables that can affect it negatively.

Design: A meta-analysis of sixteen original articles was performed within the ASSO Project (Adolescents and Surveillance System in the Obesity prevention).

Setting: The articles assessed the validity of FFQ for adolescents, compared with food records or 24 h recalls, with regard to energy and nutrient intakes.

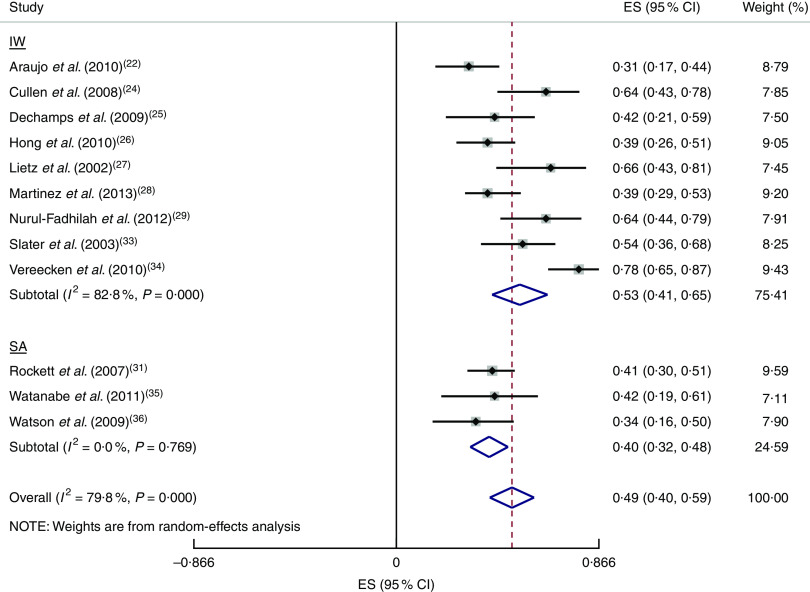
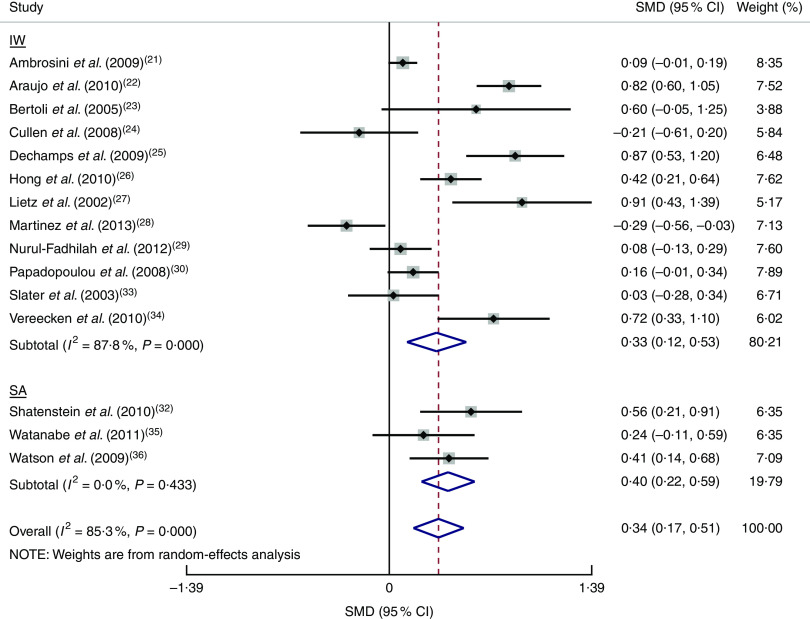
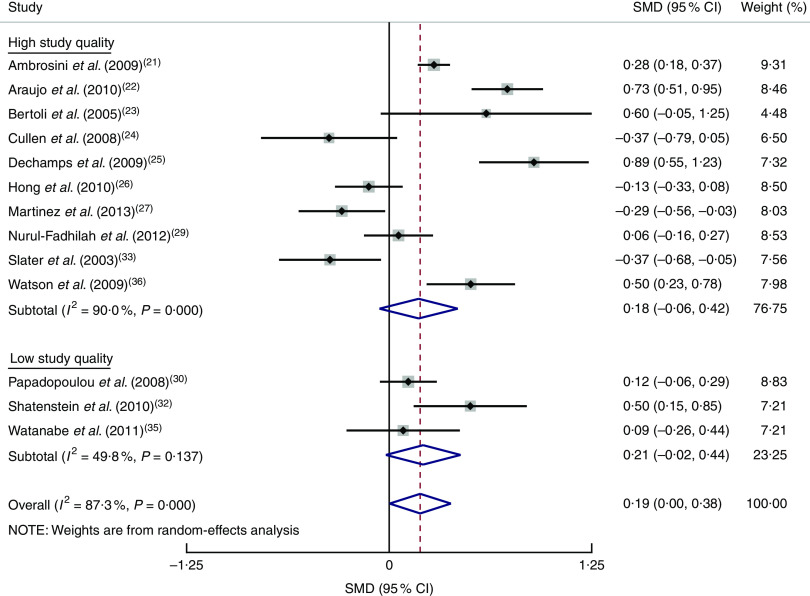
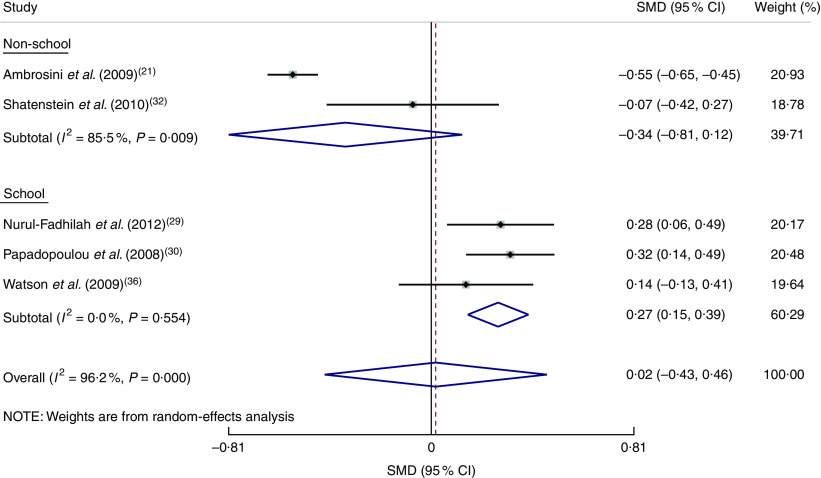
Subjects: Pearson's or Spearman's correlation coefficients, means/standard deviations, kappa agreement, percentiles and mean differences/limits of agreement (Bland-Altman method) were extracted. Pooled estimates were calculated and heterogeneity tested for correlation coefficients and means/standard deviations. A subgroup analysis assessed variables influencing FFQ accuracy.

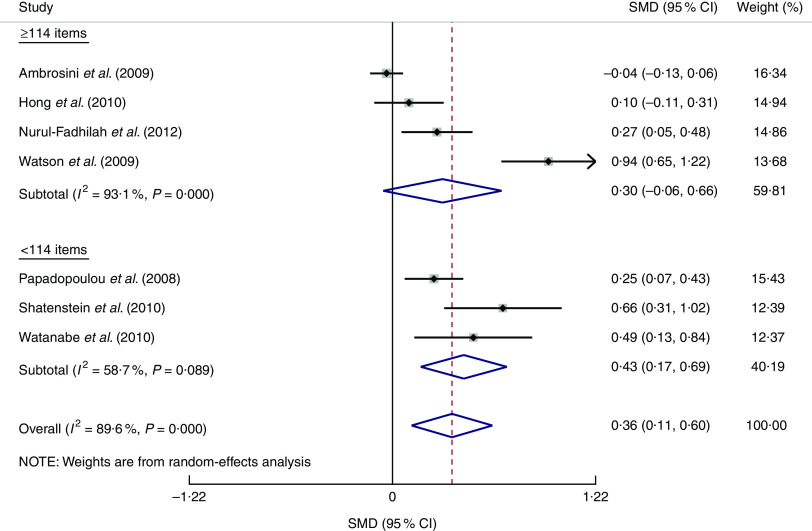
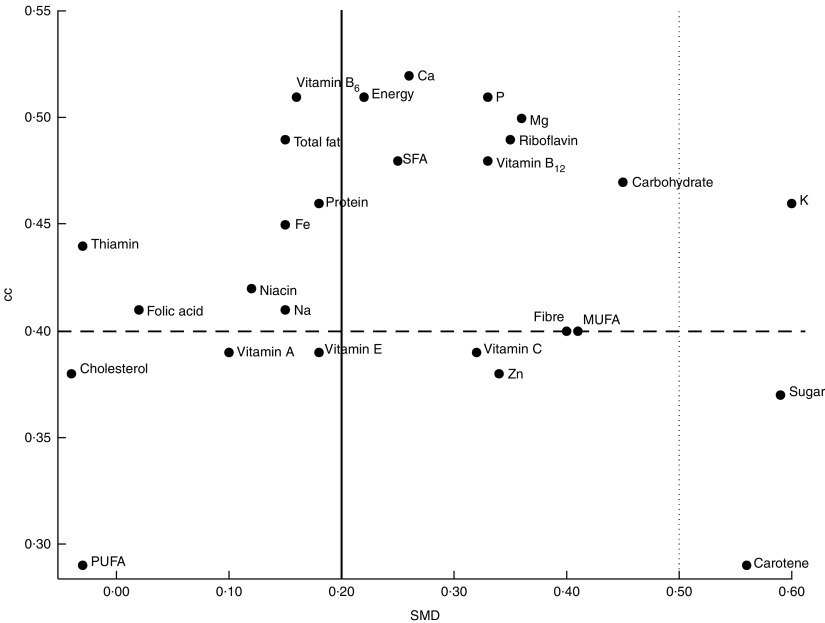
Results: An overall fair/high correlation between FFQ and reference method was found; a good agreement, measured through the intake mean comparison for all nutrients except sugar, carotene and K, was observed. Kappa values showed fair/moderate agreement; an overall good ability to rank adolescents according to energy and nutrient intakes was evidenced by data of percentiles; absolute validity was not confirmed by mean differences/limits of agreement. Interviewer administration mode, consumption interval of the previous year/6 months and high number of food items are major contributors to heterogeneity and thus can reduce FFQ accuracy.

Conclusions: The meta-analysis shows that FFQ are accurate tools for collecting data and could be used for ranking adolescents in terms of energy and nutrient intakes. It suggests how the design and the validation of a new FFQ should be addressed.

Keywords: Adolescent; FFQ; Meta-analysis; Validity.


Figures

Fig. 1
Fig. 1
Forest plot of effect estimates (ES) for the correlation coefficients of total fat intake in adolescents estimated by FFQ compared with a reference dietary instrument of food records or 24 h recalls, by administration mode (IW, interviewer-administered; SA, self-administered). The study-specific ES and 95 % CI are represented by the black diamond and horizontal line, respectively; the area of the grey square is proportional to the specific-study weight to the overall meta-analysis. The centre of the open diamond presents the pooled ES and its width represents the pooled 95 % CI
Fig. 2
Fig. 2
Forest plot of standardized mean differences (SMD) of the energy intake in adolescents estimated by FFQ compared with a reference dietary instrument of food records or 24 h recalls, by administration mode (IW, interviewer-administered; SA, self-administered). The study-specific SMD and 95 % CI are represented by the black diamond and horizontal line, respectively; the area of the grey square is proportional to the specific-study weight to the overall meta-analysis. The centre of the open diamond presents the pooled SMD and its width represents the pooled 95 % CI
Fig. 3
Fig. 3
Forest plot of standardized mean differences (SMD) of the protein intake in adolescents estimated by FFQ compared with a reference dietary instrument of food records or 24 h recalls, by study quality. The study-specific SMD and 95 % CI are represented by the black diamond and horizontal line, respectively; the area of the grey square is proportional to the specific-study weight to the overall meta-analysis. The centre of the open diamond presents the pooled SMD and its width represents the pooled 95 % CI
Fig. 4
Fig. 4
Forest plot of standardized mean differences (SMD) of the folate intake in adolescents estimated by FFQ compared with a reference dietary instrument of food records or 24 h recalls, by data collection setting. The study-specific SMD and 95 % CI are represented by the black diamond and horizontal line, respectively; the area of the grey square is proportional to the specific-study weight to the overall meta-analysis. The centre of the open diamond presents the pooled SMD and its width represents the pooled 95 % CI
Fig. 5
Fig. 5
Forest plot of standardized mean differences (SMD) of the magnesium intake in adolescents estimated by FFQ compared with a reference dietary instrument of food records or 24 h recalls, by number of food items on the FFQ. The study-specific SMD and 95 % CI are represented by the black diamond and horizontal line, respectively; the area of the grey square is proportional to the specific-study weight to the overall meta-analysis. The centre of the open diamond presents the pooled SMD and its width represents the pooled 95 % CI
Fig. 6
Fig. 6
Correlation coefficient (CC) v. standardized mean difference (SMD) of intake for energy and nutrients in adolescents estimated by FFQ compared with a reference dietary instrument of food records or 24 h recalls, showing agreement between the effect estimates derived from the two meta-analyses (– – –, CC=0·4 indicates a large effect; ———, SMD=0·2 indicates a small effect; · · · · ·, SMD=0·5 indicates a medium effect)
Fig. 7
Fig. 7
Galbraith plot of the standard normal deviate (SND) of effect estimate v. precision for energy intake in the examined studies. Regression line and 95 % CI for the intercept are represented by — — — — and the error bar, respectively

References

    1. Ortiz-Andrellucchi A, Henríquez-Sánchez P, Sánchez-Villegas A et al.. (2009) Dietary assessment methods for micronutrient intake in infants, children and adolescents: a systematic review. Br J Nutr 102, Suppl. 1, S87–S117. - PubMed
    1. Cade JE, Burley VJ, Warm DL et al.. (2004) Food frequency questionnaires: a review of their design, validation and utilisation. Nutr Res Rev 17, 5–22. - PubMed
    1. Subar AF (2004) Developing dietary assessment tools. J Am Diet Assoc 104, 769–770. - PubMed
    1. Molag ML, de Vries JHM, Ocké MC et al.. (2007) Design characteristics of food frequency questionnaires in relation to their validity. Am J Epidemiol 166, 1468–1478. - PubMed
    1. Tabacchi G, Amodio E, Di Pasquale M et al.. (2014) Validation and reproducibility of dietary assessment methods in adolescents: a systematic literature review. Public Health Nutr 17, 2700–2714. - PMC - PubMed