. 2015 Nov 1;26(21):3741-53.
doi: 10.1091/mbc.E14-07-1248. Epub 2015 Sep 9.

Centrin 3 is an inhibitor of centrosomal Mps1 and antagonizes centrin 2 function

Affiliations

Centrin 3 is an inhibitor of centrosomal Mps1 and antagonizes centrin 2 function

Dwitiya B Sawant et al. Mol Biol Cell. .

Abstract

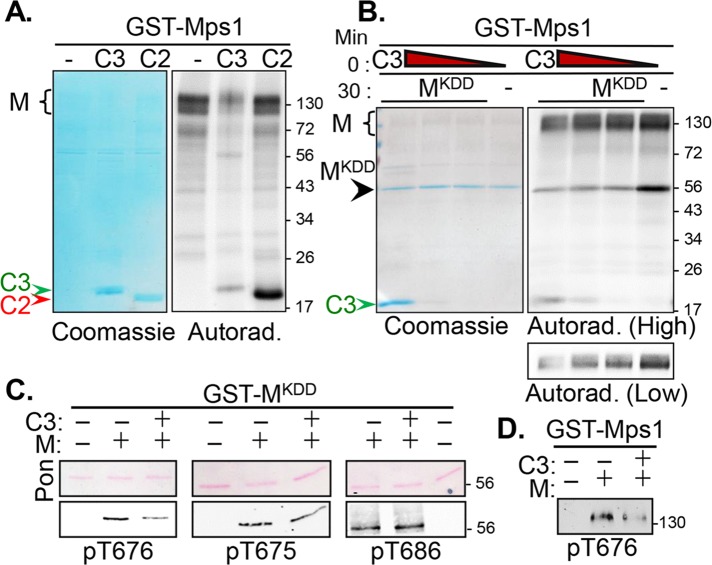
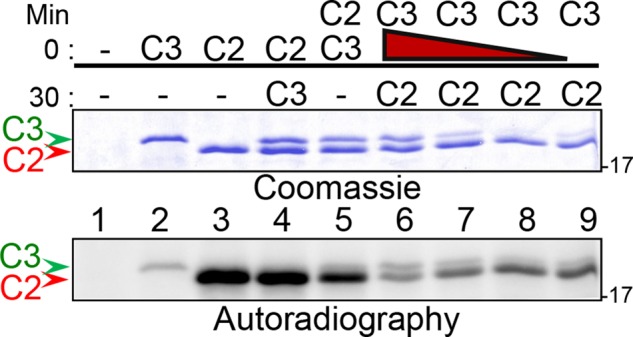
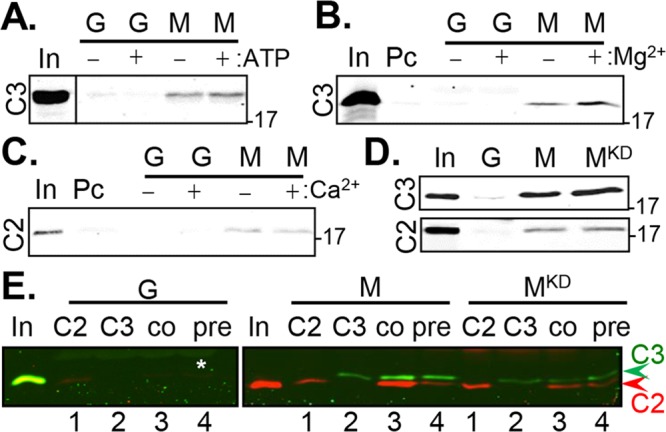
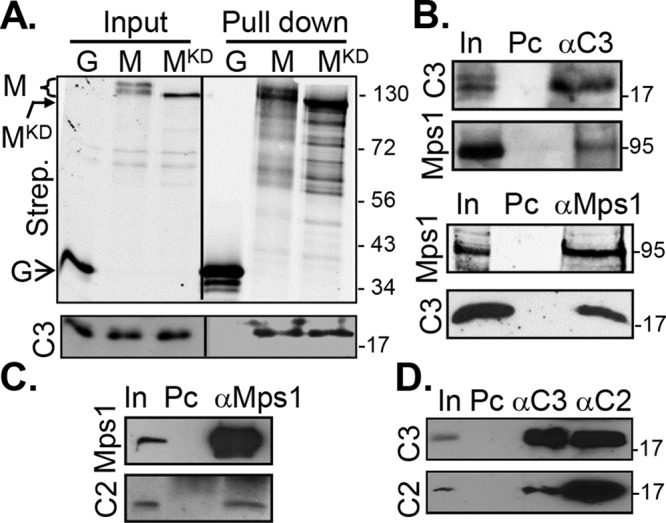
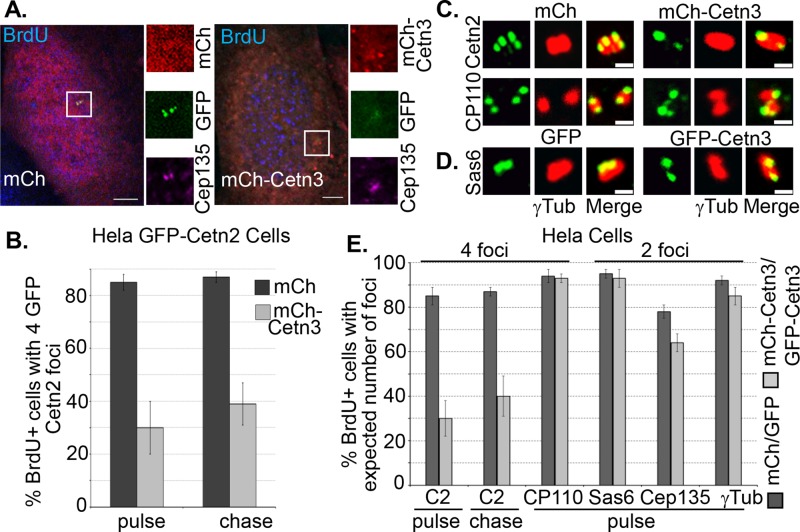
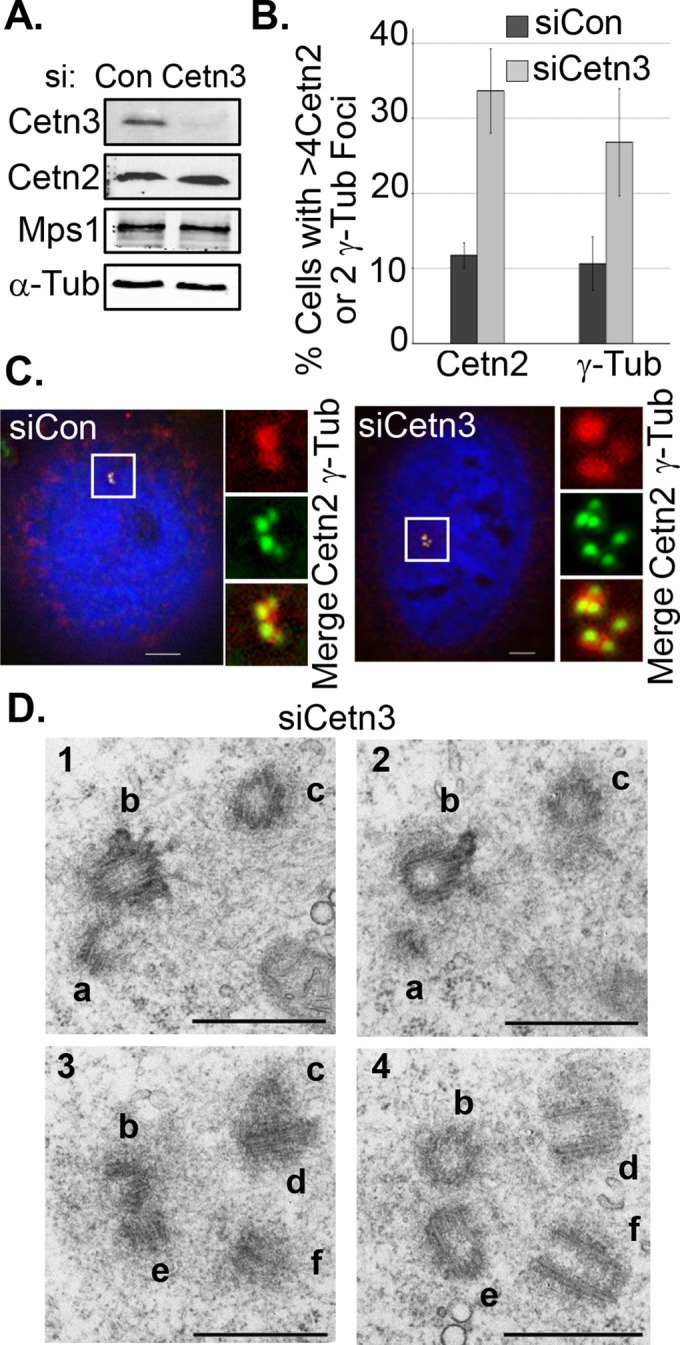
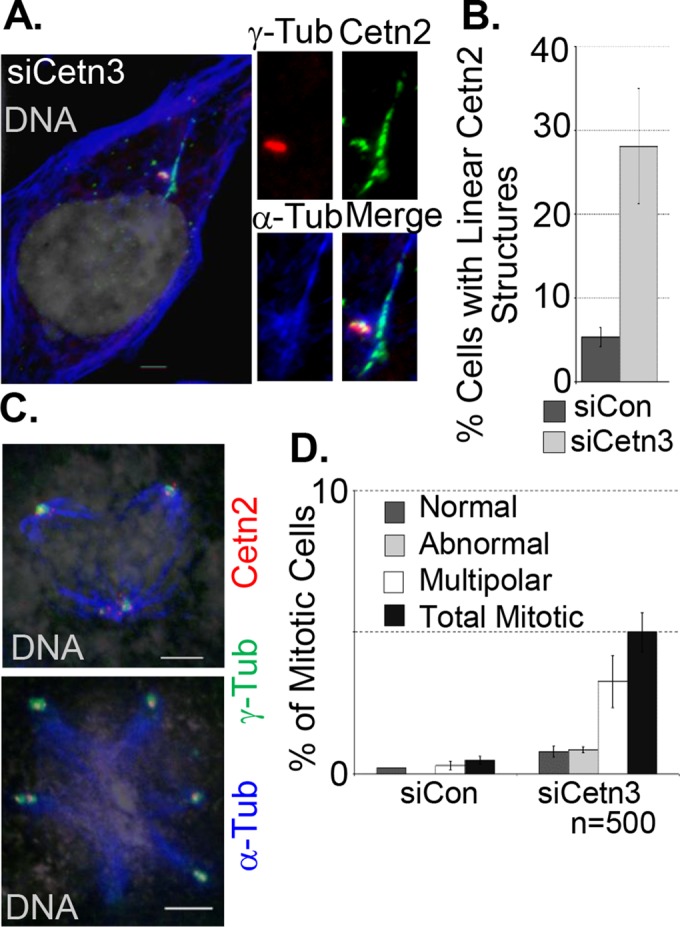
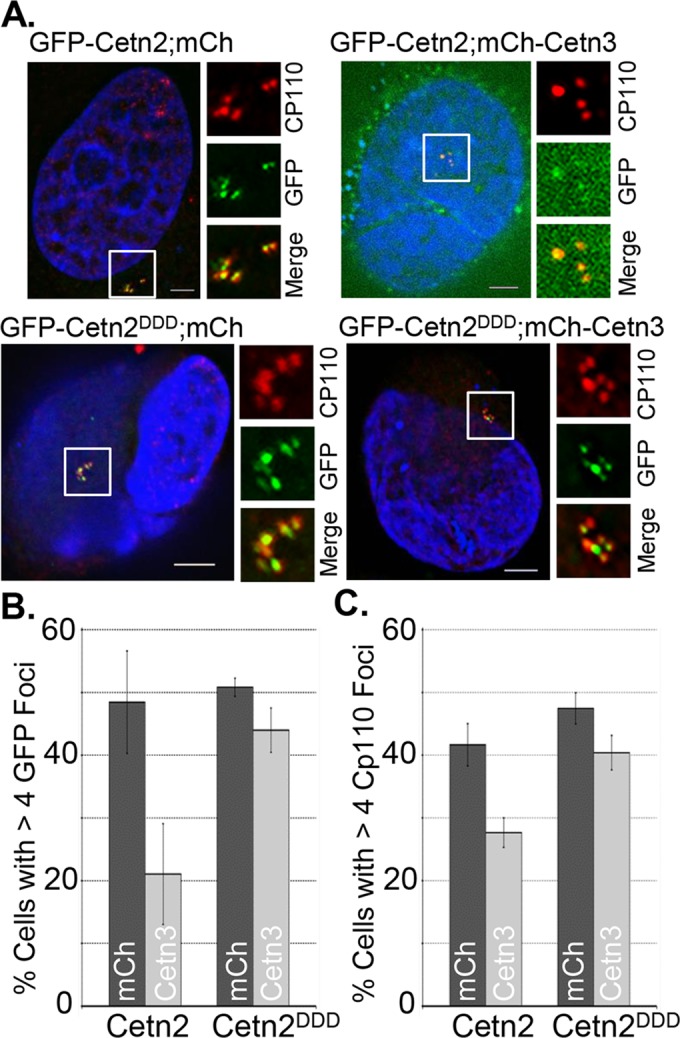
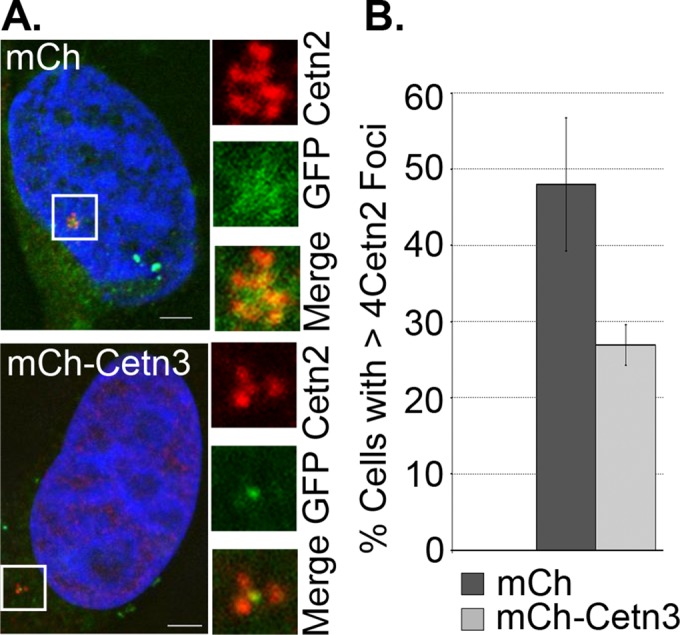
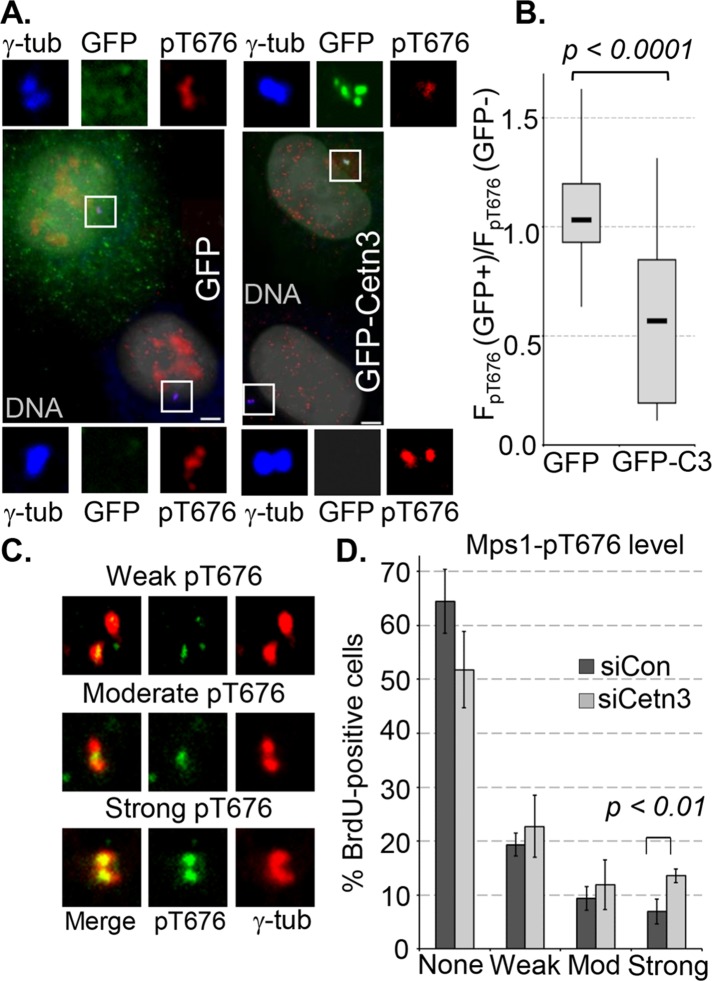
Centrins are a family of small, calcium-binding proteins with diverse cellular functions that play an important role in centrosome biology. We previously identified centrin 2 and centrin 3 (Cetn2 and Cetn3) as substrates of the protein kinase Mps1. However, although Mps1 phosphorylation sites control the function of Cetn2 in centriole assembly and promote centriole overproduction, Cetn2 and Cetn3 are not functionally interchangeable, and we show here that Cetn3 is both a biochemical inhibitor of Mps1 catalytic activity and a biological inhibitor of centrosome duplication. In vitro, Cetn3 inhibits Mps1 autophosphorylation at Thr-676, a known site of T-loop autoactivation, and interferes with Mps1-dependent phosphorylation of Cetn2. The cellular overexpression of Cetn3 attenuates the incorporation of Cetn2 into centrioles and centrosome reduplication, whereas depletion of Cetn3 generates extra centrioles. Finally, overexpression of Cetn3 reduces Mps1 Thr-676 phosphorylation at centrosomes, and mimicking Mps1-dependent phosphorylation of Cetn2 bypasses the inhibitory effect of Cetn3, suggesting that the biological effects of Cetn3 are due to the inhibition of Mps1 function at centrosomes.


Figures

FIGURE 1:
FIGURE 1:
Cetn3 is an inhibitor of Mps1 catalytic activity. Recombinant GST-Mps1 (M) was used for in vitro kinase assays. (A) Mps1 was incubated alone (M) or with His-Cetn2 (C2) or His-Cetn3 (C3) for 60 min, and kinase assays were analyzed by autoradiography after SDS–PAGE. Cetn2 (red arrowhead) is phosphorylated to a greater extent than Cetn3 (green arrowhead), but only Cetn3 markedly reduces Mps1 autophosphorylation (black caret). (B) GST-Mps1 (M) was either incubated alone for 60 min (–) or preincubated with decreasing amounts of C3 (1.0, 0.5, or 0.1 μg) for 30 min before the addition of 1 μg of GST-tagged kinase-dead Mps1 kinase domain (MKDD) for an additional 30 min. Assays were analyzed as described. Coomassie staining (showing equal loading of MKDD) and a 30-min autoradiographic exposure (High) are shown. Cetn3 (green arrowhead) reduces transphosphorylation of MKDD (black arrowhead) by full-length Mps1 (black caret) over a wide concentration range. Bottom, a lower exposure of Mps1 autophosphorylation (Low). (C, D) Kinase assays were performed as in B but in the absence of radiolabeled ATP and analyzed by immunoblotting with phosphospecific antibodies recognizing pT676, pT675, or pT686. (C) Ponceau-S (Pon)–stained membranes (confirming equal loading of MKDD) and immunoblots showing the effect of Cetn3 on staining of MKDD with the indicated antibodies. (D) Effect of Cetn3 on staining of full-length GST-Mps1 with pT676 . Cetn3 decreased the phosphorylation of GST-Mps1 and MKDD at T676. The numbers on the right of the gels represent the molecular weight in kilodaltons.
FIGURE 2:
FIGURE 2:
Cetn3 inhibits the phosphorylation of Cetn2. Recombinant GST-Mps1, His-Cetn2 (C2, red arrowhead), and His-Cetn3 (C3, green arrowhead) were used for in vitro kinase assays. Kinase assays were incubated for a total of 60 min. Proteins indicated above the line (0 min) were added at the initiation of the reaction and were present for the entire reaction, whereas proteins indicated below the line (30 min) were added to the reaction after 30 min. The red triangle above lanes 6–9 indicates decreasing amounts of C3 (1, 0.5, 0.2, and 0.05 μg) incubated with Mps1 for 30 min before addition of C2 for the remaining 30 min. After 60 min, kinase assays were analyzed by SDS–PAGE and autoradiography. Coomassie staining showing loading of C2 and C3 and 30-min autoradiograph exposure of the gel. The greatest reduction in Cetn2 phosphorylation is observed when Cetn3 is preincubated with Mps1 before the addition of Cetn2, and Cetn3 reduces phosphorylation of Cetn2 over a wide concentration range. The numbers on the right of the gels represent the molecular weight in kilodaltons.
FIGURE 3:
FIGURE 3:
Cetn3 does not prevent the binding of Cetn2 to Mps1. (A–C) His-Cetn3 (C3) or His-Cetn2 (C2) were incubated for 60 min with GST (G) or GST-Mps1 (M) immobilized on glutathione Sepharose beads in the presence (+) or absence (–) of ATP, MgCl2, or CaCl2 as indicated. Bead-bound material was isolated by centrifugation, washed, and analyzed by SDS–PAGE and immunoblotting with antibodies recognizing C2 or C3 as indicated. (A) C3 binds to Mps1, and the binding does not require ATP; the input (In) lane was separated by a blank lane, which has been cropped out as indicated by the line. (B) The binding of Cetn3 to Mps1 is enhanced by MgCl2 ([2.59 ± 0.91]-fold; input shows 1% of lysate used for pull down); Pc, preclearing beads (e.g., binding to beads alone). (C) C2 binds to Mps1, and the binding is not affected by CaCl2. (D) The binding of C2 and C3 to Mps1 does not require catalytic activity. C2 or C3 was incubated with GST (G), GST-Mps1 (M), or GST-Mps1KD (MKD). (E) Cetn3 does not prevent the binding of Cetn2 to Mps1. C2 (red) and C3 (green) were incubated with bead-bound GST (G), GST-Mps1 (M), or GST-Mps1KD (MKD) as follows: 1) C2 was incubated with G, M, or MKD alone (C2); 2) C3 was incubated with G, M, or MKD alone (C3); 3) C2 and C3 were coincubated with G, M, or MKD (co); 4) C3 was preincubated with G, M, or MKD for 30 min, followed by the addition of C2 for an additional 30 min (pre). C2 (red) and C3 (green) were imaged simultaneously using the LI-COR Odyssey scanner. The input (In) for Cetn2 was run on the gel with GST, whereas that for Cetn3 was run on the gel with GST-Mps1 and GST-Mps1KD. The numbers on the right of the gels represent the molecular weight in kilodaltons.
FIGURE 4:
FIGURE 4:
Cetn3 and Cetn2 bind to Mps1 in human cells. (A) Cetn3 binds equally well to wild-type and kinase-dead Mps1 in cells. Lysates from S phase–arrested HEK 293 cells expressing GFP-biotin (G), GFP-biotin-Mps1 (M), and GFP-biotin-Mps1KD (MKD) were incubated with streptavidin-conjugated magnetic beads. The streptavidin pull downs were then analyzed by SDS–PAGE and immunoblotting. The open arrow indicates the position of GFP, the bent, closed arrow indicates the position of MKD, and the bracket indicates full-length Mps1. (B–D) Lysates from S phase–arrested HeLa cells were incubated with rabbit antibodies against Mps1 (αMps1), Cetn2 (αC2), or Cetn3 (αC3), precipitated with protein G beads, and then analyzed by SDS–PAGE and immunoblotting with mouse antibodies against Mps1 or Cetn3 (C3) or rabbit antibody against Cetn2 (C3) as indicated. (B) Endogenous Mps1 and Cetn3 demonstrated reciprocal co-IP; top, Mps1 coimmunoprecipitates (coIPs) with rabbit anti-Cetn3 (αC3); bottom, Cetn3 (C3) coIPs with rabbit αMps1 (αMps1). (C) Cetn2 (C2) coIPs with endogenous Mps1; bottom, uppermost band represents protein G used in the immunoprecipitation (which leached from the magnetic beads). (D) Reciprocal coimmunoprecipitation is observed between endogenous Cetn2 and Cetn3; precipitated material was normalized for equal loading of Cetn3. In, input, 0.5% or 1% of the lysate; Pc, preclearing beads (e.g., binding to beads alone). The numbers on the right of the gels represent the molecular weight in kilodaltons.
FIGURE 5:
FIGURE 5:
Overexpression of Cetn3 inhibits incorporation of Cetn2 into centrioles in asynchronously growing cells. (A, B) Overexpression of Cetn3 reduces the percentage of S phase cells that have incorporated GFP-Cetn2 into new centrioles. HeLa GFP-Cetn2 cells were transfected with mCherry (mCh) or mCh-Cetn3, incubated with BrdU for 4 h, and then fixed and processed for IIF either after the BrdU pulse or after a 4-h chase in the absence of BrdU. (A) Representative images of BrdU-positive HeLa GFP-Cetn2 cells showing mCh or mCh-Cetn3 (red), GFP-Cetn2 (GFP, green), and Cep135 (purple). Bar, 5 μm. In all images, insets show digitally magnified centrosomes indicated by boxes. (B) Bar graph showing percentage of BrdU-positive cells with four GFP-Cetn2 foci. (C–E) Overexpression of Cetn3 inhibits the incorporation of endogenous Cetn2 into centrioles but does not affect the incorporation of CP110 or HsSAS-6. HeLa cells were transfected with mCh or mCh-Cetn3, or GFP or GFP-Cetn3, and then incubated with EdU for 4 h and fixed and processed for IIF with various antibodies either after the EdU pulse or after a 4-h chase in the absence of EdU. (C) Representative images of centrosomes from EdU-positive mCh- and mCh-Cetn3–transfected HeLa cells stained with either Cetn2 or CP110 (green) and γ-tubulin (red). Bar, 1 μm. (D) Representative images of centrosomes from EdU-positive GFP- and GFP-Cetn3–transfected HeLa cells stained with HsSAS-6 (green) and γ-tubulin (red). (E) Percentage of EdU-positive cells with four foci for Cetn2 or CP110 and two foci for HsSAS-6, Cep135, and γ-tubulin. Values in B and E represent the mean ± SD for triplicate samples for which at least 75 cells were counted per replicate.
FIGURE 6:
FIGURE 6:
Cetn3 depletion leads to centriole reduplication in S phase–arrested cells. HeLa cells were transfected with control (siCon) or Cetn3-specific (siCetn3) siRNAs and then arrested in S phase for 48 h with HU as described in Materials and Methods. (A) Immunoblot comparing whole-cell levels of Cetn3, Mps1, and Cetn2 in siCetn3 and siCon lysates, with α-tubulin (α-Tub) as a loading control. siCetn3 caused an 80–90% reduction in Cetn3 protein levels, with no change in whole-cell protein levels of Mps1 and Cetn2. (B) Percentage of S phase–arrested cells with more than four Cetn2 foci or more than two γ-tubulin foci. (C) Representative images of S phase–arrested, siRNA-transfected HeLa cells showing DNA (blue), Cetn2 (green), and γ-tubulin (red). (D) Representative electron micrographs of serial sections from a HeLa cell transfected with siCetn3, showing extra centrioles (six individual centrioles are labeled a–f; n = 8, two of which had excess centrioles, compared with 0 of 7 control cells). Bar, 500 nm.
FIGURE 7:
FIGURE 7:
Cetn3 depletion leads to formation of long, linear Cetn2 structures and mitotic abnormalities in S phase–arrested cells. (A–D) HeLa cells were prepared as described in Figure 6. (A) Representative image of long, linear Cetn2 structures in Cetn3-depleted HeLa cells; Cetn2 (green), γ-tubulin (red), α-tubulin (blue), DNA (gray). The Cetn2 linear structure is positive for α-tubulin and is adjacent to the centrosome. (B) Percentage of S phase–arrested cells with long, linear Cetn2 structures. Values represent mean ± SD of triplicate samples for which at least 75 cells were counted per replicate. (C) Representative images of Cetn3-depleted HeLa cells with abnormal mitotic spindles stained with α-tubulin, γ-tubulin, and Cetn2; left, DNA (gray), α-tubulin (blue), γ-tubulin (green), and Cetn2 (red). (D) Bar graph shows percentage of S phase–arrested cells that had the indicated mitotic structures. Values represent mean ± SD of triplicate samples, where n = 500 for each replicate. Bar, 5 μm.
FIGURE 8.
FIGURE 8.
Cetn3 overexpression blocks Cetn2-dependent centrosome reduplication in S phase–arrested cells. HeLa cells were doubly transfected with the indicated combinations of mCh or mCh-Cetn3 (Cetn3) and GFP-Cetn2 (Cetn2) or GFP-Cetn2DDD (Cetn2DDD), arrested in S phase for 48 h as described in Materials and Methods, and stained with antibodies against CP110. (A) Representative images of HeLa cells doubly transfected as indicated; DNA (blue), GFP-Cetn2 constructs (green), and CP110 (red; mCh signal not shown). Bar, 5 μm. (B, C) Bar graphs showing the percentage of S phase–arrested HeLa cells with more than four foci for (B) GFP or (C) CP110 for each double transfection. Values in B and C represent mean ± SD of triplicate samples for which at least 75 cells were counted per replicate. Mimicking phosphorylation at all three Mps1 phosphorylation sites (T45, T47, T118) bypasses the inhibitory effect of Cetn3 on both excess centriole production and incorporation of Cetn2 and CP110 into centrioles.
FIGURE 9:
FIGURE 9:
Overexpression of Cetn3 inhibits Mps1∆12/13-dependent formation of excess Cetn2 foci in S phase–arrested cells. HeLa GFP-Mps1∆12/13 cells were transfected with mCh or mCh-Cetn3, arrested in S phase for 48 h, and then stained with Cetn2 (red). (A) Representative images of mCh-positive HeLa GFP-Mps1∆12/13 cells (mCh signal not shown) showing GFP-Mps1∆12/13 (GFP, green) and Cetn2 (red). DNA is blue. Bar, 5 μm. (B) Percentage of cells with more than four Cetn2 foci. Values represent mean ± SD of triplicate samples for which at least 75 cells were counted per replicate. Overexpression of Cetn3 leads to a reduction in the number of HeLa GFP-Mps1∆12/13 cells with excess Cetn2 foci.
FIGURE 10:
FIGURE 10:
Cetn3 inhibits Mps1 activity in human cells. (A, B) HeLa cells were transfected with GFP or GFP-Cetn3, arrested in S phase by a 24-h HU treatment, and analyzed by quantitative IIF using antibodies against T676-phosphorylated Mps1 (pT676) and γ-tubulin (γ-tub). (A) Fields containing representative pairs of GFP-positive and adjacent untransfected (GFP–) cells used for the analysis in B, showing GFP (green), pT676 (red), γ-tubulin (blue), and DNA (gray). Bar, 5 μm. (B) The normalized level of pT676 at centrosomes, FpT676, was determined as described in Materials and Methods for both a GFP-positive (GFP+) cell and an adjacent untransfected (GFP–) cell that were imaged at the same time. The ratio FpT676(GFP+)/FpT676(GFP–) was calculated for 25 such cell pairs, and the data are presented in a box and whisker diagram. Here and in all other cases, boxes indicate lower and upper quartiles, a the marker in the box (–) indicates the median, and the whiskers represent minimum and maximum values for each series; p value was determined by unpaired t test. (C, D) Asynchronously growing HeLa cells were transfected with either control (siCon) or Cetn3-specific siRNA (siCetn3) for 68 h and then labeled with BrdU for 4 h and analyzed by IIF with Mps1 pT676 and an antibody against γ-tubulin. (C) Representative images of BrdU-positive (blue) HeLa cells with weak, moderate, and strong pT676 staining (green) at centrosomes (γ-tub, red). Bar, 5 μm. (D) Bar graph showing the percentages of BrdU-positive HeLa cells with the indicated level of centrosomal Mps1 pT676–staining bars. Values represent mean ± SD for three independent experiments, for which at least 75 cells were counted per replicate.

Similar articles

Cited by

References

    1. Araki Y, Gombos L, Migueleti SPS, Sivashanmugam L, Antony C, Schiebel E. N-terminal regions of Mps1 kinase determine functional bifurcation. J Cell Biol. 2010;189:41–56. - PMC - PubMed
    1. Araki M, Masutani C, Takemura M, Uchida A, Sugasawa K, Kondoh J, Ohkuma Y, Hanaoka F. Centrosome protein centrin 2/caltractin 1 is part of the xeroderma pigmentosum group C complex that initiates global genome nucleotide excision repair. J Biol Chem. 2001;276:18665–18672. - PubMed
    1. Azimzadeh J, Marshall WF. Building the centriole. Curr Biol. 2010;20:R816–R825. - PMC - PubMed
    1. Baron AT, Greenwood TM, Bazinet CW, Salisbury JL. Centrin is a component of the pericentriolar lattice. Biol Cell. 1992;76:383–388. - PubMed
    1. Baum P, Furlong C, Byers B. Yeast gene required for spindle pole body duplication: homology of its product with Ca2+-binding proteins. Proc Natl Acad Sci USA. 1986;83:5512–5516. - PMC - PubMed

Publication types

MeSH terms

LinkOut - more resources