. 2015 Oct 30;290(44):26597-609.
doi: 10.1074/jbc.M115.673301. Epub 2015 Sep 9.

Rapid deamination of cyclobutane pyrimidine dimer photoproducts at TCG sites in a translationally and rotationally positioned nucleosome in vivo

Affiliations

Rapid deamination of cyclobutane pyrimidine dimer photoproducts at TCG sites in a translationally and rotationally positioned nucleosome in vivo

Vincent J Cannistraro et al. J Biol Chem. .

Abstract

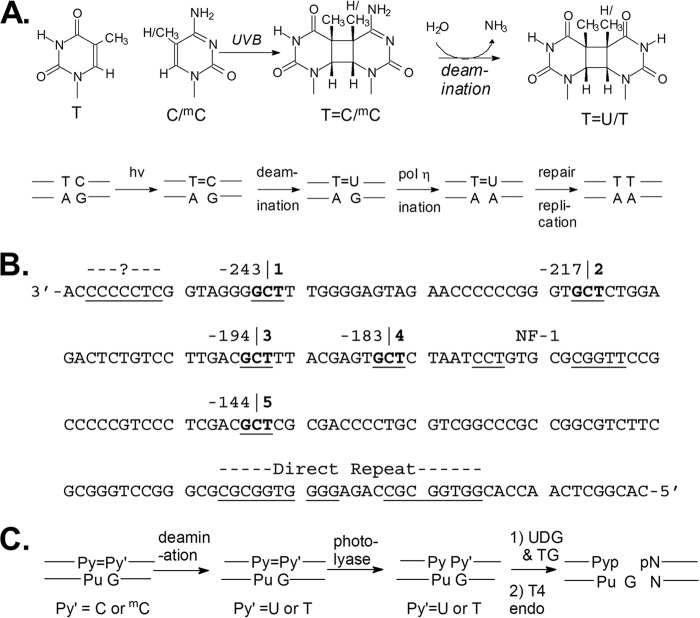
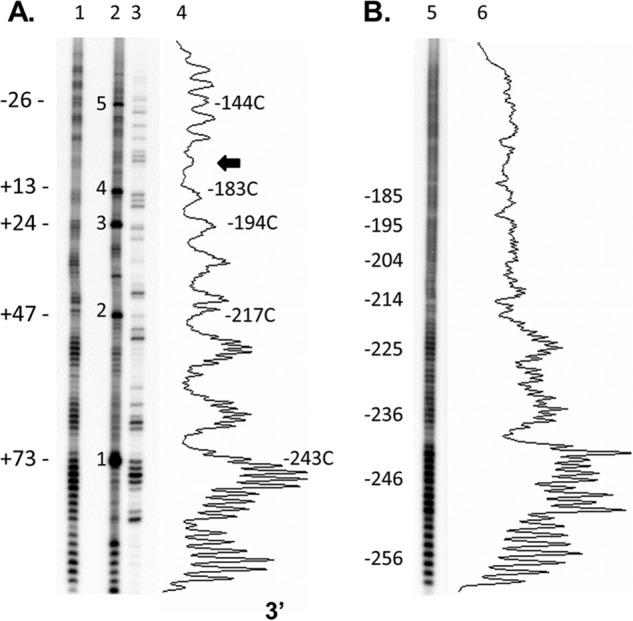
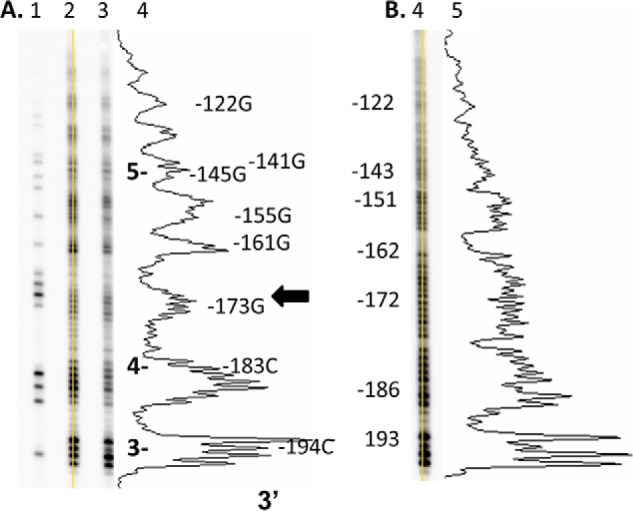
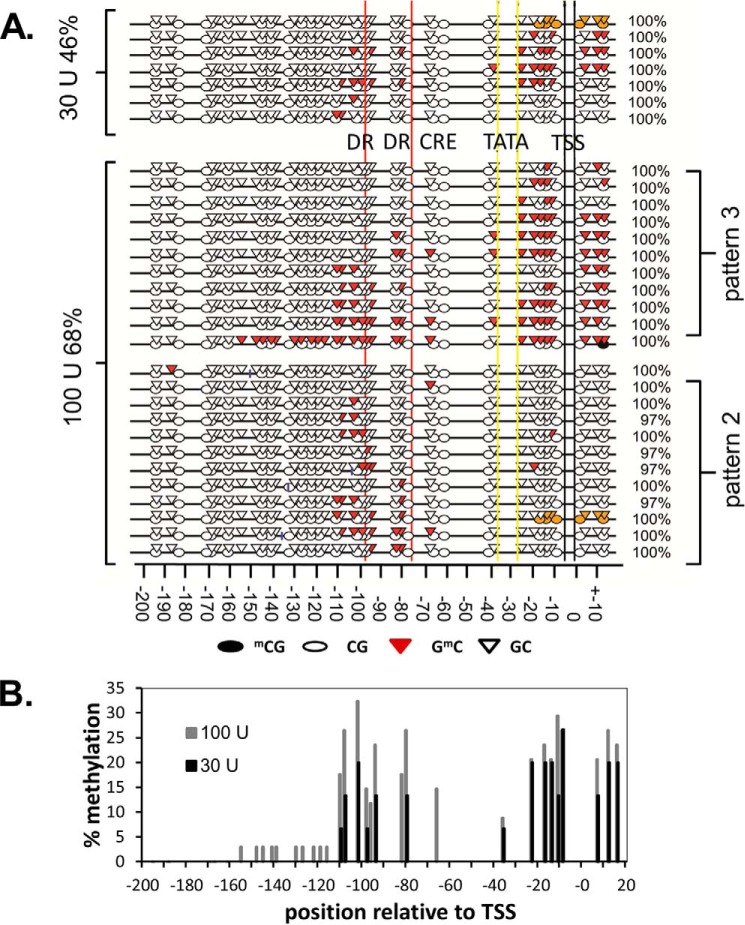
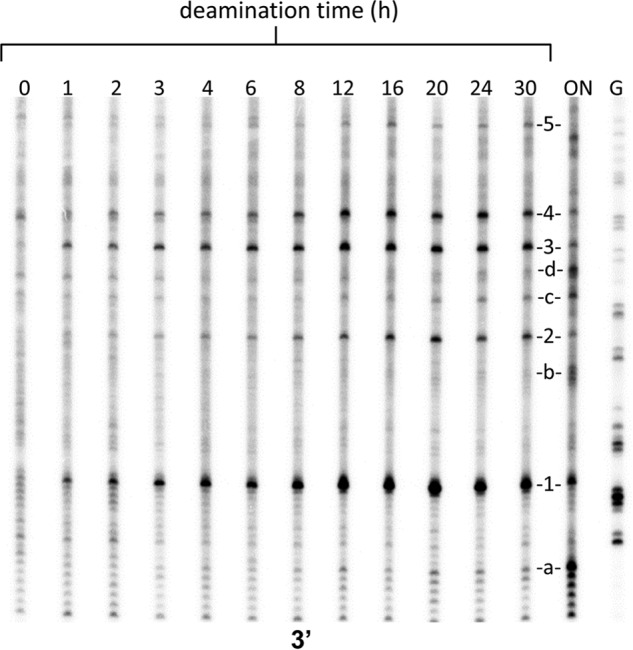
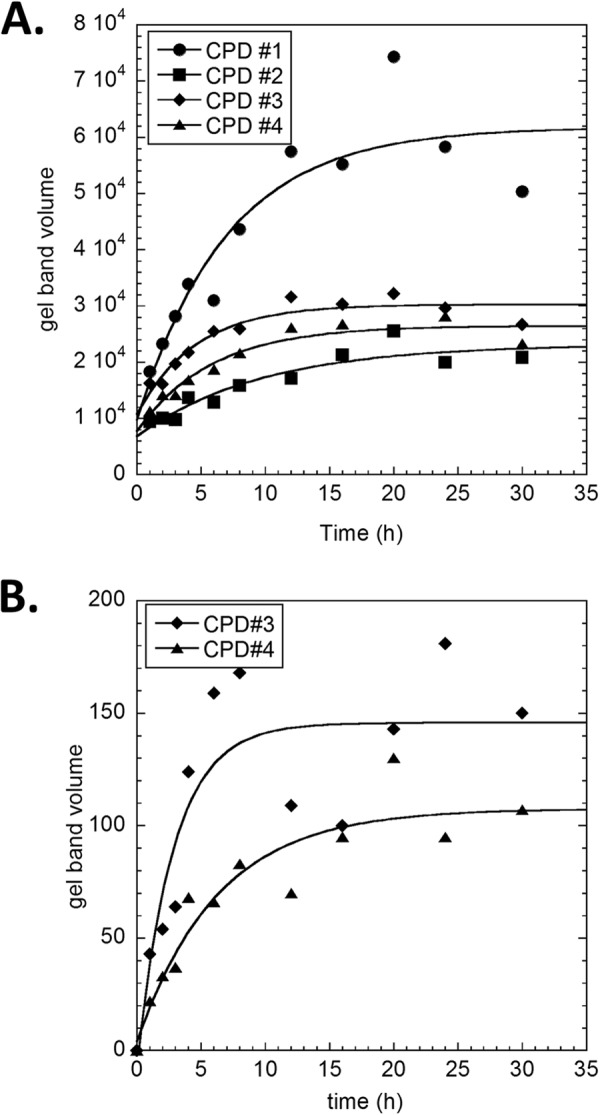
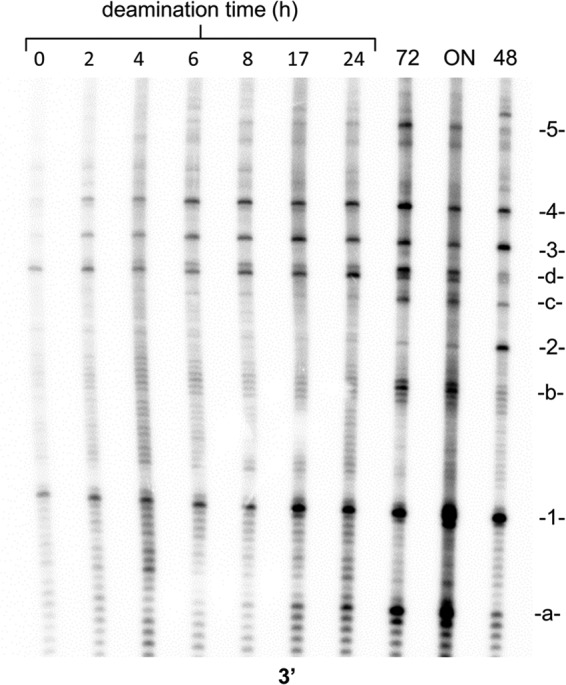
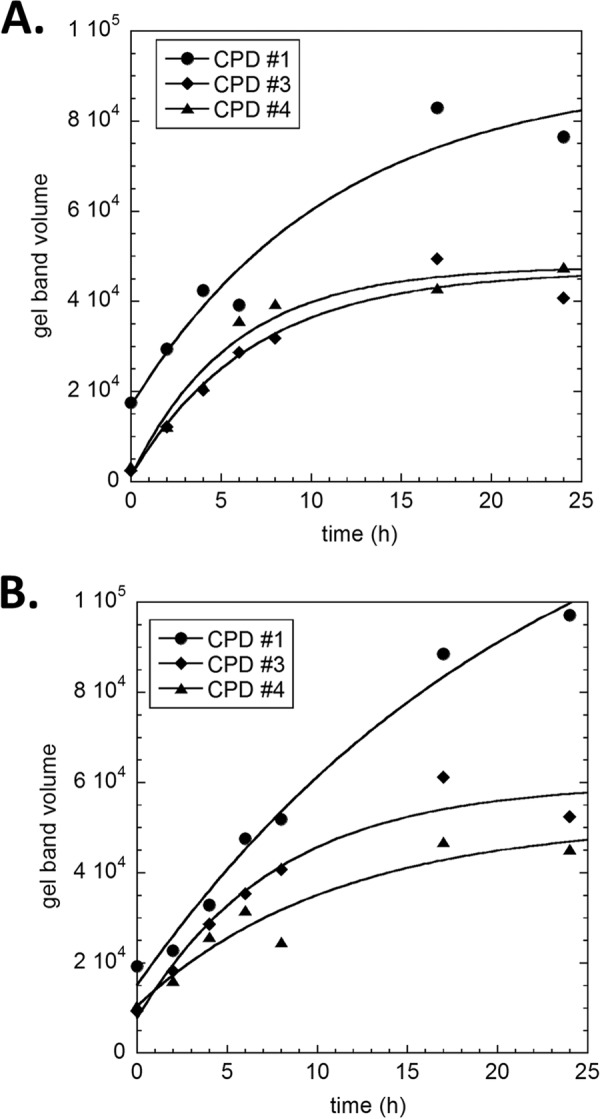
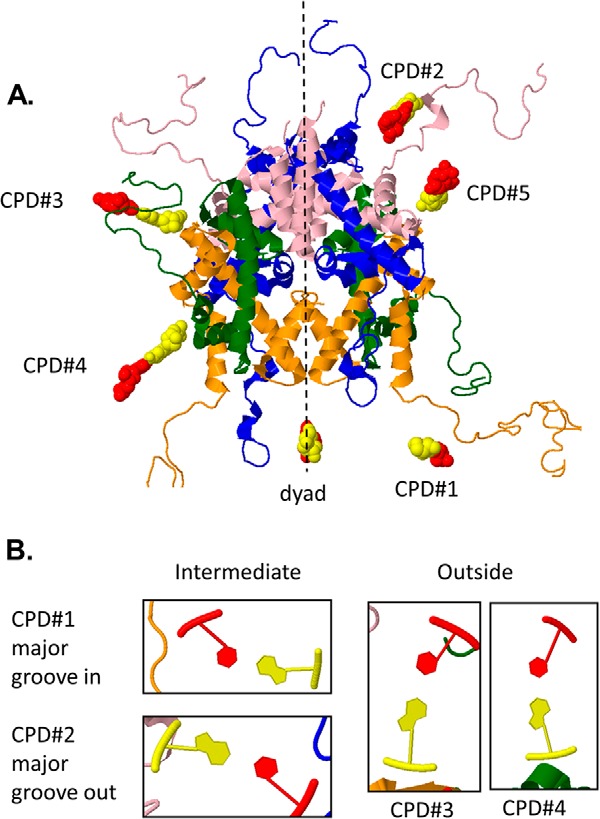
Sunlight-induced C to T mutation hot spots in skin cancers occur primarily at methylated CpG sites that coincide with sites of UV-induced cyclobutane pyrimidine dimer (CPD) formation. The C and 5-methyl-C in CPDs are not stable and deaminate to U and T, respectively, which leads to the insertion of A by the DNA damage bypass polymerase η, thereby defining a probable mechanism for the origin of UV-induced C to T mutations. Deamination rates for T(m)CG CPDs have been found to vary 12-fold with rotational position in a nucleosome in vitro. To determine the influence of nucleosome structure on deamination rates in vivo, we determined the deamination rates of CPDs at TCG sites in a stably positioned nucleosome within the FOS promoter in HeLa cells. A procedure for in vivo hydroxyl radical footprinting with Fe-EDTA was developed, and, together with results from a cytosine methylation protection assay, we determined the translational and rotational positions of the TCG sites. Consistent with the in vitro observations, deamination was slower for one CPD located at an intermediate rotational position compared with two other sites located at outside positions, and all were much faster than for CPDs at non-TCG sites. Photoproduct formation was also highly suppressed at one site, possibly due to its interaction with a histone tail. Thus, it was shown that CPDs of TCG sites deaminate the fastest in vivo and that nucleosomes can modulate both their formation and deamination, which could contribute to the UV mutation hot spots and cold spots.

Keywords: 5-methylcytosine; DNA damage; chromatin structure; histone; mutagenesis mechanism; nucleosome; photobiology.


Figures

FIGURE 1.
FIGURE 1.
Photobiology of TC CPDs and their detection in FOS DNA. A, formation and deamination of methylated and unmethylated TC CPDs that result in C to T mutations. B, the bottom strand of the FOS promoter with the five TCG sites underlined in boldface type and their position given relative to the transcription start site. Various known and unknown protein binding sites are also underlined. C, enzymatic steps used in the LMPCR assay to determine the deamination rates of TC CPDs.
FIGURE 2.
FIGURE 2.
In vivo and in vitro hydroxyl radical footprints downstream of −253 in the FOS promoter. A, in vivo. Lane 1, hydroxyl radical footprint with the numbers to the left referring to proposed positions of the TCG CPDs relative to the nucleosome dyad; lane 2, 48-h deamination reaction with the numbers to the left referring to the TCG CPD sites numbered according to Fig. 1; lane 3, Maxam-Gilbert G reaction; lane 4, densitometry trace of lane 1, with numbers to the right indicating the position of a peak relative to the transcription start site. The arrow indicates the proposed location of the dyad axis. B, in vitro. Lane 5, hydroxyl radical footprint; lane 6, densitometry trace of lane 5.
FIGURE 3.
FIGURE 3.
In vivo and in vitro hydroxyl radical footprints upstream of −190 of the FOS promoter. A, lane 1, Maxam-Gilbert G reaction conducted on genomic DNA in vitro; lanes 2 and 3, hydroxyl radical footprinting reactions carried out at two different reagent concentrations in vivo; lane 4, densitometry trace of lane 2, with numbers to the right indicating the position of a peak relative to the transcription start site and the arrow indicating the proposed location of the dyad axis. B, lane 5, hydroxyl radical footprint carried out on genomic DNA in vitro; lane 6, densitometry trace of lane 5.
FIGURE 4.
FIGURE 4.
Methylation protection mapping of the FOS promoter. A, sequences of cloned DNA using the indicated amount of methyl transferase. Open oval, unmethylated CpG; filled oval, methylated CpG. Open triangle, unmethylated GpC; red triangle, methylated GpC. Orange, inability to properly align the local sequence. Percentages on the left, percentages of the sequences with at least one GpC methylation event. Percentages on the right, percentage deamination of the non-CpG or GpC sites. DR, direct repeat; CRE, cAMP-response element-binding site; TATA, TATA site. Numbers below are relative to the TSS. B, histogram of the percentage methylation at GpC sites of the FOS promoter for different amounts of methylase plotted relative to the TSS.
FIGURE 5.
FIGURE 5.
Time course of the in vitro deamination of CPDs from in vitro irradiated DNA. LMPCR assay for deaminated C-containing CPDs for the indicated deamination times in hours. ON, overnight in vitro deamination of in vitro irradiated DNA at 60 °C, pH 6.2. G, Maxam Gilbert G reaction lane.
FIGURE 6.
FIGURE 6.
Curve fit plots of the in vitro deamination of TCG CPDs from in vitro irradiated DNA as a function of deamination time. A, raw band volumes from the phosphor image shown in Fig. 5 are plotted against deamination time and fit to a first order process as described under “Experimental Procedures.” B, repeat of the experiment using primers beginning at −194.
FIGURE 7.
FIGURE 7.
Time course of in vivo deamination of CPDs from in vivo irradiated DNA. LMPCR assay for deamination of cytosines in CPDs for the indicated deamination times in hours. Lane 72, 72-h in vitro deamination of in vivo irradiated DNA at 37 °C, pH 6.2. ON, overnight in vitro deamination of in vivo irradiated DNA at 60 °C, pH 6.2. 48, 48-h deamination of in vitro irradiated DNA at 37 °C, pH 7.1.
FIGURE 8.
FIGURE 8.
Curve fit plots of the in vivo deamination of the TCG CPDs from in vivo irradiated DNA as a function of deamination time. A, raw band volumes from the phosphor image shown in Fig. 7 are plotted against deamination time and fit to a first order process as described under “Experimental Procedures.” B, repeat of the experiment.
FIGURE 9.
FIGURE 9.
Translational and rotational positions of the cytosines of CPDs 1–5. The DNA sequence of the 1kx5.pdb structure was mutated to that of FOS, assuming that the dyad is at −170, to assign the translational positions of the cytosines of the TCG CPDs (shown in red) (A) and the rotational orientation of the C relative to the nucleosome surface (bottom of each panel) (B). The rotational orientation of CPD 5 is similar to that of CPD 2.

References

    1. Pfeifer G. P., You Y. H., and Besaratinia A. (2005) Mutations induced by ultraviolet light. Mutat. Res. 571, 19–31 - PubMed
    1. Vu B., Cannistraro V. J., Sun L., and Taylor J. S. (2006) DNA synthesis past a 5-methylC-containing cis-syn-cyclobutane pyrimidine dimer by yeast pol η is highly nonmutagenic. Biochemistry 45, 9327–9335 - PubMed
    1. Yoon J. H., Prakash L., and Prakash S. (2009) Highly error-free role of DNA polymerase η in the replicative bypass of UV-induced pyrimidine dimers in mouse and human cells. Proc. Natl. Acad. Sci. U.S.A. 106, 18219–18224 - PMC - PubMed
    1. Ikehata H., and Ono T. (2011) The mechanisms of UV mutagenesis. J. Radiat. Res. 52, 115–125 - PubMed
    1. Song Q., Sherrer S. M., Suo Z., and Taylor J. S. (2012) Preparation of site-specific T=mCG cis-syn cyclobutane dimer-containing template and its error-free bypass by yeast and human polymerase η. J. Biol. Chem. 287, 8021–8028 - PMC - PubMed

Publication types

MeSH terms

Associated data

LinkOut - more resources