Meta-Analysis
. 2015 Nov;102(5):1266-78.
doi: 10.3945/ajcn.114.101238. Epub 2015 Sep 9.

Consumption of meat is associated with higher fasting glucose and insulin concentrations regardless of glucose and insulin genetic risk scores: a meta-analysis of 50,345 Caucasians

Affiliations
Meta-Analysis

Consumption of meat is associated with higher fasting glucose and insulin concentrations regardless of glucose and insulin genetic risk scores: a meta-analysis of 50,345 Caucasians

Amanda M Fretts et al. Am J Clin Nutr. 2015 Nov.

Abstract

Background: Recent studies suggest that meat intake is associated with diabetes-related phenotypes. However, whether the associations of meat intake and glucose and insulin homeostasis are modified by genes related to glucose and insulin is unknown.

Objective: We investigated the associations of meat intake and the interaction of meat with genotype on fasting glucose and insulin concentrations in Caucasians free of diabetes mellitus.

Design: Fourteen studies that are part of the Cohorts for Heart and Aging Research in Genomic Epidemiology consortium participated in the analysis. Data were provided for up to 50,345 participants. Using linear regression within studies and a fixed-effects meta-analysis across studies, we examined 1) the associations of processed meat and unprocessed red meat intake with fasting glucose and insulin concentrations; and 2) the interactions of processed meat and unprocessed red meat with genetic risk score related to fasting glucose or insulin resistance on fasting glucose and insulin concentrations.

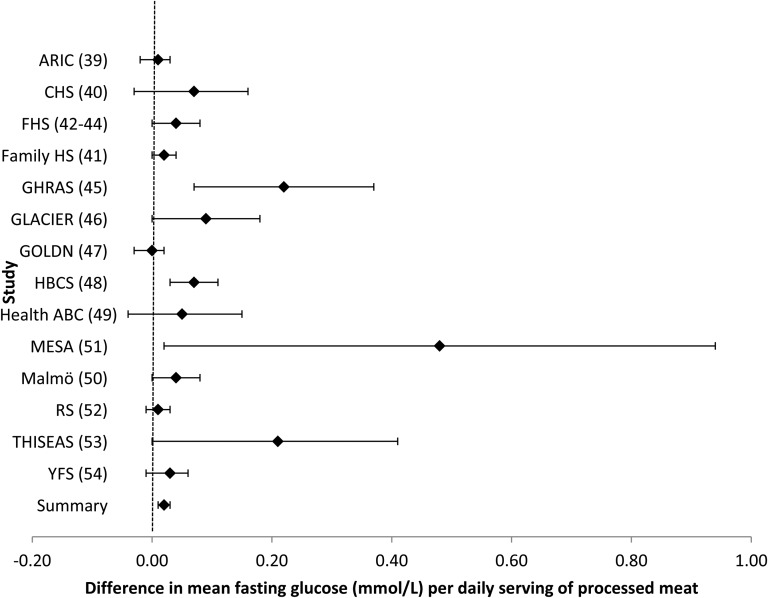
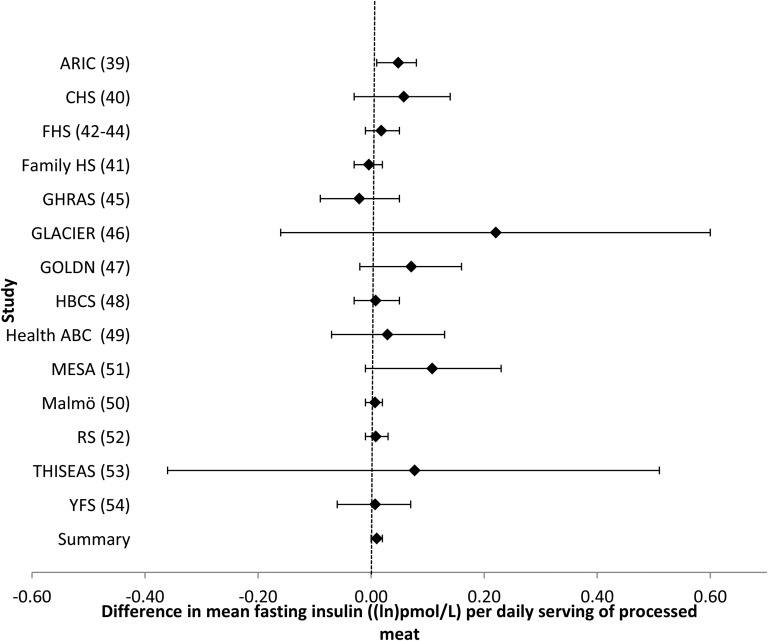
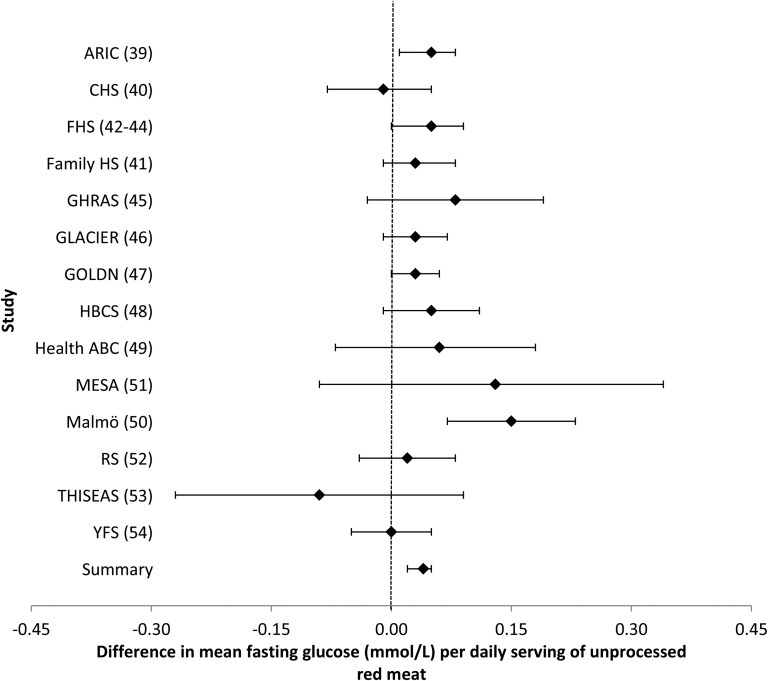
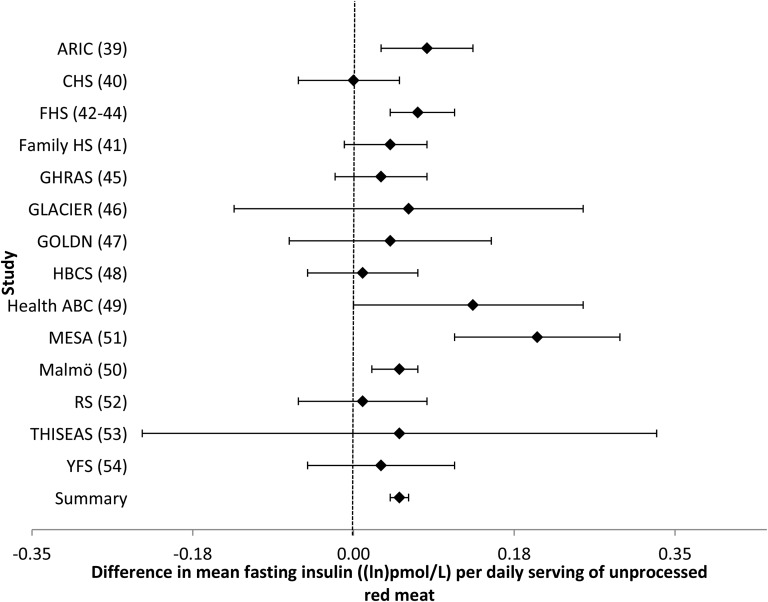
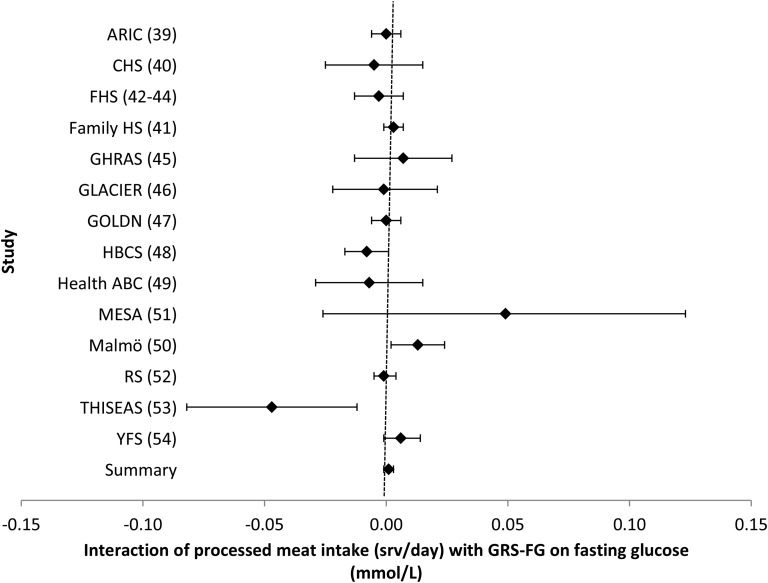
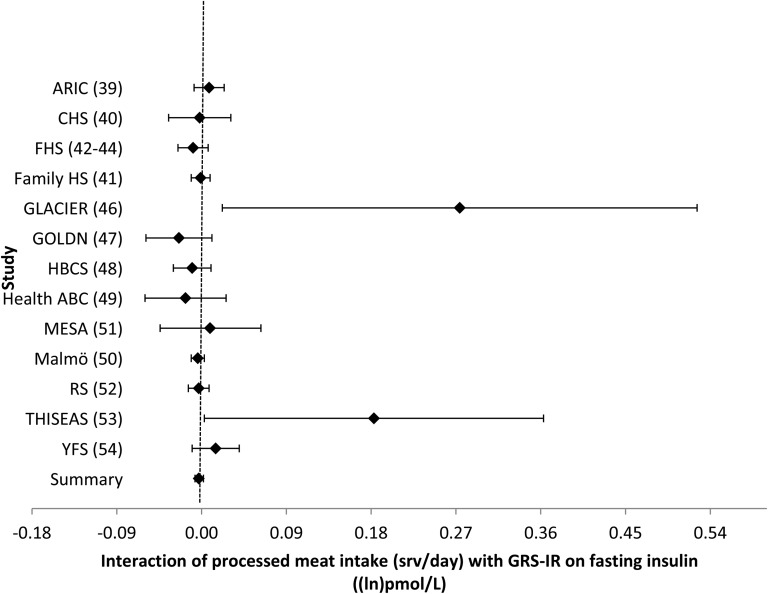
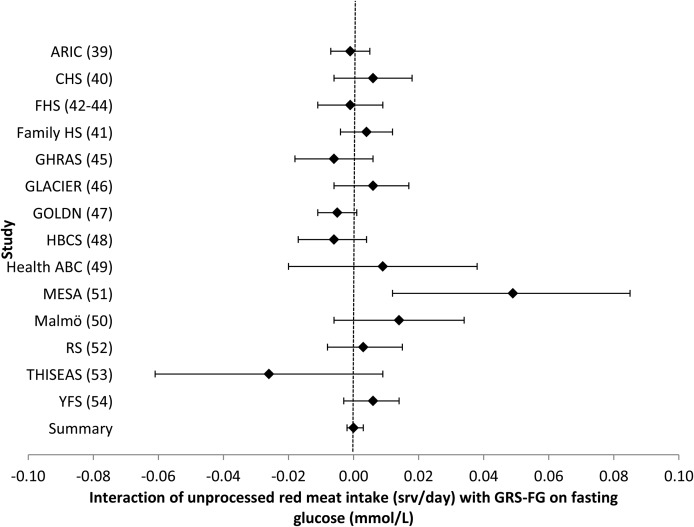
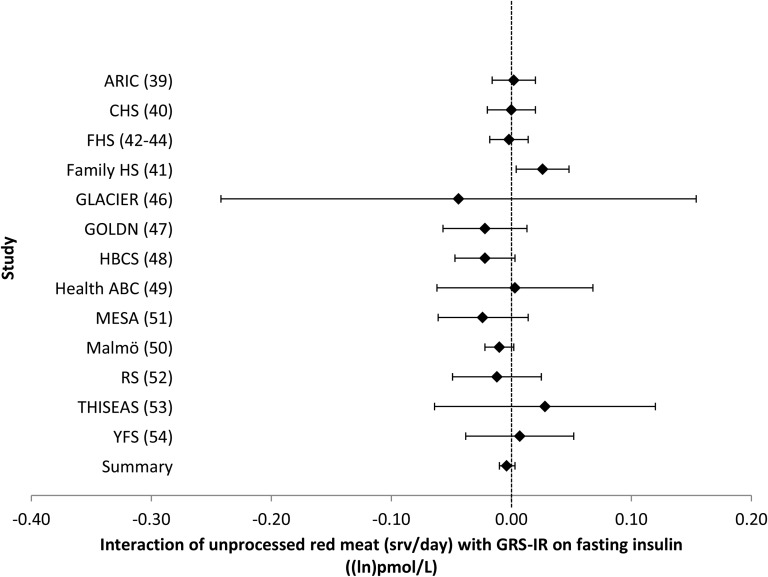
Results: Processed meat was associated with higher fasting glucose, and unprocessed red meat was associated with both higher fasting glucose and fasting insulin concentrations after adjustment for potential confounders [not including body mass index (BMI)]. For every additional 50-g serving of processed meat per day, fasting glucose was 0.021 mmol/L (95% CI: 0.011, 0.030 mmol/L) higher. Every additional 100-g serving of unprocessed red meat per day was associated with a 0.037-mmol/L (95% CI: 0.023, 0.051-mmol/L) higher fasting glucose concentration and a 0.049-ln-pmol/L (95% CI: 0.035, 0.063-ln-pmol/L) higher fasting insulin concentration. After additional adjustment for BMI, observed associations were attenuated and no longer statistically significant. The association of processed meat and fasting insulin did not reach statistical significance after correction for multiple comparisons. Observed associations were not modified by genetic loci known to influence fasting glucose or insulin resistance.

Conclusion: The association of higher fasting glucose and insulin concentrations with meat consumption was not modified by an index of glucose- and insulin-related single-nucleotide polymorphisms. Six of the participating studies are registered at clinicaltrials.gov as NCT0000513 (Atherosclerosis Risk in Communities), NCT00149435 (Cardiovascular Health Study), NCT00005136 (Family Heart Study), NCT00005121 (Framingham Heart Study), NCT00083369 (Genetics of Lipid Lowering Drugs and Diet Network), and NCT00005487 (Multi-Ethnic Study of Atherosclerosis).

Trial registration: ClinicalTrials.gov NCT00000513 NCT00005121 NCT00005136 NCT00005487 NCT00083369 NCT00149435 NCT00000513 NCT00005487 NCT00149435 NCT00005136 NCT00083369 NCT00005121.

Keywords: diet; gene–diet interaction; glucose; insulin; meat intake; meta-analysis.


Figures

FIGURE 1
FIGURE 1
Forest plot of association of processed meat intake and fasting glucose. For each cohort, linear regression was used to examine the association of processed meat and fasting glucose. Meta-analyses were performed with the use of inverse-variance–weighted fixed-effects models. Regression coefficients and 95% CIs are represented by a filled diamond and horizontal line for each cohort and overall (summary). Regression coefficients and 95% CIs represent the difference in mean fasting glucose per one daily serving of processed meat in a model adjusted for model 2 covariates, including age, sex, energy intake (kilocalories per day), field center/population substructure, education, smoking, alcohol use, physical activity, and unprocessed red meat, fish, fruit, vegetable, whole grain, sugar-sweetened beverage, nut, and saturated fat (grams per day) intake. Summary regression coefficient (95% CI): 0.021 (0.011, 0.030). The GOLDN did not adjust for sugar-sweetened beverage intake because these data were not available. The GHRAS did not adjust for saturated fat intake because these data were not available. ARIC, Atherosclerosis Risk in Communities; CHS, Cardiovascular Health Study; Family HS, Family Heart Study; FHS, Framingham Heart Study; GHRAS, Greek Health Randomized Aging Study; GLACIER, Gene–Lifestyle Interactions and Complex Traits Involved in Elevated Disease Risk; GOLDN, Genetics of Lipid Lowering Drugs and Diet Network; HBCS, Helsinki Birth Cohort Study; Health ABC, Health, Aging, and Body Composition; Malmӧ, Malmӧ Diet and Cancer Study; MESA, Multi-Ethnic Study of Atherosclerosis; RS, Rotterdam Study; THISEAS, Hellenic Study of Interactions between SNPs and Eating in Atherosclerosis Susceptibility; YFS, Young Finns Study.
FIGURE 2
FIGURE 2
Forest plot of association of processed meat intake with fasting insulin. For each cohort, linear regression was used to examine the associations of processed meat with fasting insulin. Meta-analyses were performed with the use of inverse-variance–weighted fixed-effects models. Regression coefficients and 95% CIs are represented by a filled diamond and horizontal line for each cohort and overall (summary). Regression coefficients and 95% CIs represent the difference in mean fasting insulin per one daily serving of processed meat in a model adjusted for model 2 covariates, including age, sex, energy intake (kilocalories per day), field center/population substructure, education, smoking, alcohol use, physical activity, and unprocessed red meat, fish, fruit, vegetable, whole grain, sugar-sweetened beverage, nut, and saturated fat (grams per day) intake. Summary regression coefficient (95% CI): 0.011 (0.002, 0.019). The GOLDN did not adjust for sugar-sweetened beverage intake because these data were not available. The GHRAS did not adjust for saturated fat intake because these data were not available. ARIC, Atherosclerosis Risk in Communities; CHS, Cardiovascular Health Study; Family HS, Family Heart Study; FHS, Framingham Heart Study; GHRAS, Greek Health Randomized Aging Study; GLACIER, Gene–Lifestyle Interactions and Complex Traits Involved in Elevated Disease Risk; GOLDN, Genetics of Lipid Lowering Drugs and Diet Network; HBCS, Helsinki Birth Cohort Study; Health ABC, Health, Aging, and Body Composition; Malmӧ, Malmӧ Diet and Cancer Study; MESA, Multi-Ethnic Study of Atherosclerosis; RS, Rotterdam Study; THISEAS, Hellenic Study of Interactions between SNPs and Eating in Atherosclerosis Susceptibility; YFS, Young Finns Study.
FIGURE 3
FIGURE 3
Forest plot of association of unprocessed red meat intake and fasting glucose. For each cohort, linear regression was used to examine the associations of unprocessed red meat with fasting glucose. Meta-analyses were performed with the use of inverse-variance–weighted fixed-effects models. Regression coefficients and 95% CIs are represented by a filled diamond and horizontal line for each cohort and overall (summary). Regression coefficients and 95% CIs represent the difference in mean fasting glucose per one daily serving of unprocessed red meat in a model adjusted for model 2 covariates, including age, sex, energy intake (kilocalories per day), field center/population substructure, education, smoking, alcohol use, physical activity, and processed meat, fish, fruit, vegetable, whole grain, sugar-sweetened beverage, nut, and saturated fat (grams per day) intake. Summary regression coefficient (95% CI): 0.037 (0.023, 0.051). The GOLDN did not adjust for sugar-sweetened beverage intake because these data were not available. The GHRAS did not adjust for saturated fat intake because these data were not available. ARIC, Atherosclerosis Risk in Communities; CHS, Cardiovascular Health Study; Family HS, Family Heart Study; FHS, Framingham Heart Study; GHRAS, Greek Health Randomized Aging Study; GLACIER, Gene–Lifestyle Interactions and Complex Traits Involved in Elevated Disease Risk; GOLDN, Genetics of Lipid Lowering Drugs and Diet Network; HBCS, Helsinki Birth Cohort Study; Health ABC, Health, Aging, and Body Composition; Malmӧ, Malmӧ Diet and Cancer Study; MESA, Multi-Ethnic Study of Atherosclerosis; RS, Rotterdam Study; THISEAS, Hellenic Study of Interactions between SNPs and Eating in Atherosclerosis Susceptibility; YFS, Young Finns Study.
FIGURE 4
FIGURE 4
Forest plot of association between unprocessed red meat intake and fasting insulin. For each cohort, linear regression was used to examine the associations between unprocessed red meat and fasting insulin. Meta-analyses were performed with the use of inverse-variance–weighted fixed-effects models. Regression coefficients and 95% CIs are represented by a filled diamond and horizontal line for each cohort and overall (summary). Regression coefficients and 95% CIs represent the difference in mean fasting insulin per one daily serving of unprocessed red meat in a model adjusted for model 2 covariates, including age, sex, energy intake (kilocalories per day), field center/population substructure, education, smoking, alcohol use, physical activity, and processed meat, fish, fruit, vegetable, whole grain, sugar-sweetened beverage, nut, and saturated fat (grams per day) intake. Summary regression coefficient (95% CI): 0.049 (0.035, 0.063). The GOLDN did not adjust for sugar-sweetened beverage intake because these data were not available. The GHRAS did not adjust for saturated fat intake because these data were not available. ARIC, Atherosclerosis Risk in Communities; CHS, Cardiovascular Health Study; Family HS, Family Heart Study; FHS, Framingham Heart Study; GHRAS, Greek Health Randomized Aging Study; GLACIER, Gene–Lifestyle Interactions and Complex Traits Involved in Elevated Disease Risk; GOLDN, Genetics of Lipid Lowering Drugs and Diet Network; HBCS, Helsinki Birth Cohort Study; Health ABC, Health, Aging, and Body Composition; Malmӧ, Malmӧ Diet and Cancer Study; MESA, Multi-Ethnic Study of Atherosclerosis; RS, Rotterdam Study; THISEAS, Hellenic Study of Interactions between SNPs and Eating in Atherosclerosis Susceptibility; YFS, Young Finns Study.
FIGURE 5
FIGURE 5
Forest plot of interaction of processed meat intake with the GRS-FG on fasting glucose. For each cohort, linear regression was used to examine the interaction of processed meat intake with the GRS-FG on fasting glucose. Meta-analyses were performed with the use of inverse-variance–weighted fixed-effects models. Regression coefficients and 95% CIs are represented by a filled diamond and horizontal line for each cohort and overall (summary). Regression coefficients (95% CIs) are adjusted for age, sex, energy intake, and field center/population substructure. Summary regression coefficient (95% CI): 0.001 (−0.001, 0.003). ARIC, Atherosclerosis Risk in Communities; CHS, Cardiovascular Health Study; Family HS, Family Heart Study; FHS, Framingham Heart Study; GHRAS, Greek Health Randomized Aging Study; GLACIER, Gene–Lifestyle Interactions and Complex Traits Involved in Elevated Disease Risk; GOLDN, Genetics of Lipid Lowering Drugs and Diet Network; GRS-FG, β cell liability genetic risk score; HBCS, Helsinki Birth Cohort Study; Health ABC, Health, Aging, and Body Composition; Malmӧ, Malmӧ Diet and Cancer Study; MESA, Multi-Ethnic Study of Atherosclerosis; RS, Rotterdam Study; srv, servings; THISEAS, Hellenic Study of Interactions between SNPs and Eating in Atherosclerosis Susceptibility; YFS, Young Finns Study.
FIGURE 6
FIGURE 6
Forest plot of interaction of processed meat intake with the GRS-IR on fasting insulin. For each cohort, linear regression was used to examine the interaction of processed meat intake with the GRS-IR on fasting insulin. Meta-analyses were performed with the use of inverse-variance–weighted fixed-effects models. Regression coefficients and 95% CIs are represented by a filled diamond and horizontal line for each cohort and overall (summary). Regression coefficients (95% CIs) are adjusted for age, sex, energy intake, and field center/population substructure. Summary regression coefficient (95% CI): −0.003 (−0.007, 0.002). ARIC, Atherosclerosis Risk in Communities; CHS, Cardiovascular Health Study; Family HS, Family Heart Study; FHS, Framingham Heart Study; GLACIER, Gene–Lifestyle Interactions and Complex Traits Involved in Elevated Disease Risk; GOLDN, Genetics of Lipid Lowering Drugs and Diet Network; HBCS, Helsinki Birth Cohort Study; GRS-IR, insulin-resistance genetic risk score; Health ABC, Health, Aging, and Body Composition; Malmӧ, Malmӧ Diet and Cancer Study; MESA, Multi-Ethnic Study of Atherosclerosis; RS, Rotterdam Study; srv, servings; THISEAS, Hellenic Study of Interactions between SNPs and Eating in Atherosclerosis Susceptibility; YFS, Young Finns Study.
FIGURE 7
FIGURE 7
Forest plot of interaction of unprocessed red meat intake with the GRS-FG on fasting glucose. For each cohort, linear regression was used to examine the interaction of unprocessed red meat intake with the GRS-FG on fasting glucose. Meta-analyses were performed with the use of inverse-variance–weighted fixed-effects models. Regression coefficients and 95% CIs are represented by a filled diamond and horizontal line for each cohort and overall (summary). Regression coefficients (95% CIs) are adjusted for age, sex, energy intake, and field center/population substructure. Summary regression coefficient (95% CI): 0.000 (−0.002, 0.003). ARIC, Atherosclerosis Risk in Communities; CHS, Cardiovascular Health Study; Family HS, Family Heart Study; FHS, Framingham Heart Study; GHRAS, Greek Health Randomized Aging Study; GLACIER, Gene–Lifestyle Interactions and Complex Traits Involved in Elevated Disease Risk; GOLDN, Genetics of Lipid Lowering Drugs and Diet Network; GRS-FG, β cell liability genetic risk score; HBCS, Helsinki Birth Cohort Study; Health ABC, Health, Aging, and Body Composition; Malmӧ, Malmӧ Diet and Cancer Study; MESA, Multi-Ethnic Study of Atherosclerosis; RS, Rotterdam Study; srv, servings; THISEAS, Hellenic Study of Interactions between SNPs and Eating in Atherosclerosis Susceptibility; YFS, Young Finns Study.
FIGURE 8
FIGURE 8
Forest plot of interaction of unprocessed red meat intake with the GRS-IR on fasting insulin. For each cohort, linear regression was used to examine the interaction of unprocessed red meat intake with the GRS-IR on fasting insulin. Meta-analyses were performed with the use of inverse-variance–weighted fixed-effects models. Regression coefficients and 95% CIs are represented by a filled diamond and horizontal line for each cohort and overall (summary). Regression coefficients (95% CIs) are adjusted for age, sex, energy intake, and field center/population substructure. Summary regression coefficient (95% CI): −0.004 (−0.010, 0.003). ARIC, Atherosclerosis Risk in Communities; CHS, Cardiovascular Health Study; Family HS, Family Heart Study; FHS, Framingham Heart Study; GLACIER, Gene–Lifestyle Interactions and Complex Traits Involved in Elevated Disease Risk; GOLDN, Genetics of Lipid Lowering Drugs and Diet Network; GRS-IR, insulin-resistance genetic risk score; HBCS, Helsinki Birth Cohort Study; Health ABC, Health, Aging, and Body Composition; Malmӧ, Malmӧ Diet and Cancer Study; MESA, Multi-Ethnic Study of Atherosclerosis; RS, Rotterdam Study; srv, servings; THISEAS, Hellenic Study of Interactions between SNPs and Eating in Atherosclerosis Susceptibility; YFS, Young Finns Study.

References

    1. Danaei G, Finucane MM, Lu Y, Singh GM, Cowan MJ, Paciorek CJ, Lin JK, Farzadfar F, Khang YH, Stevens GA, et al. . National, regional, and global trends in fasting plasma glucose and diabetes prevalence since 1980: systematic analysis of health examination surveys and epidemiological studies with 370 country-years and 2.7 million participants. Lancet 2011;378:31–40. - PubMed
    1. Li C, Ford ES, McGuire LC, Mokdad AH, Little RR, Reaven GM. Trends in hyperinsulinemia among nondiabetic adults in the US. Diabetes Care 2006;29:2396–402. - PubMed
    1. Van Dam RM, Willett W, Rimm E, Stampfer M, Hu F. Dietary fat and meat intake in relation to risk of type 2 diabetes in men. Diabetes Care 2002;25:417–24. - PubMed
    1. Song Y, Manson JE, Buring JE, Liu S. A prospective study of red meat consumption and type 2 diabetes in middle-aged and elderly women: the women's health study. Diabetes Care 2004;27(9):2108–15. - PubMed
    1. Micha R, Wallace SK, Mozaffarian D. Red and processed meat consumption and risk of incident coronary heart disease, stroke, and diabetes mellitus: a systematic review and meta-analysis. Circulation 2010;121(21):2271–83. - PMC - PubMed

Publication types

MeSH terms

Associated data