. 2015 Nov;25(11):1656-65.
doi: 10.1101/gr.196485.115. Epub 2015 Sep 9.

Linked selection and recombination rate variation drive the evolution of the genomic landscape of differentiation across the speciation continuum of Ficedula flycatchers

Affiliations

Linked selection and recombination rate variation drive the evolution of the genomic landscape of differentiation across the speciation continuum of Ficedula flycatchers

Reto Burri et al. Genome Res. 2015 Nov.

Abstract

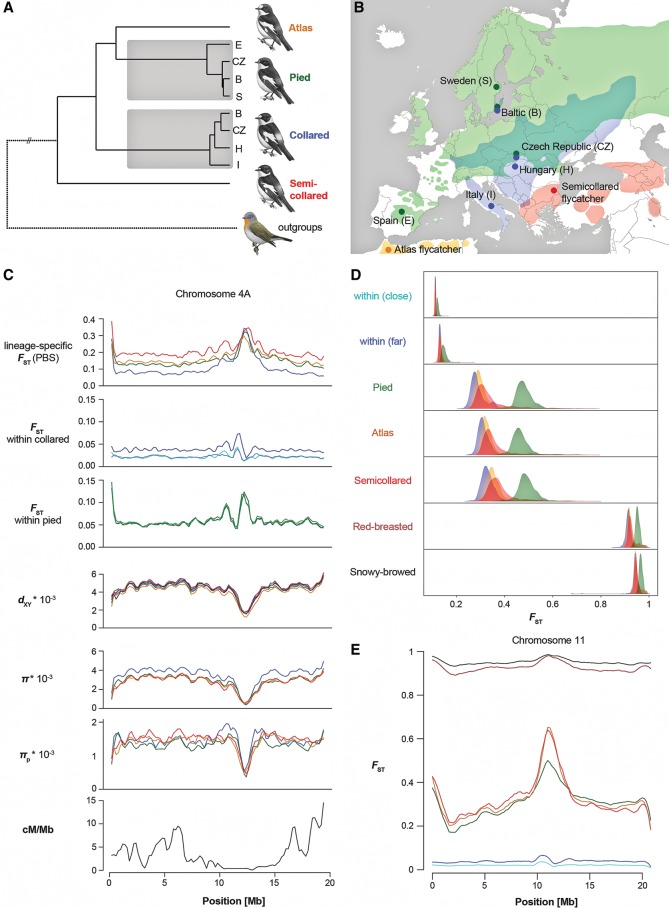
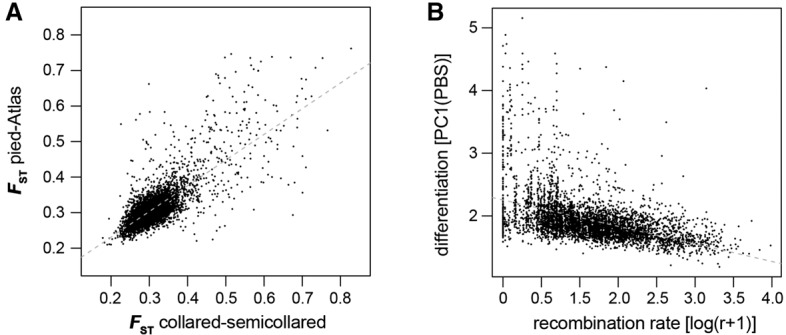
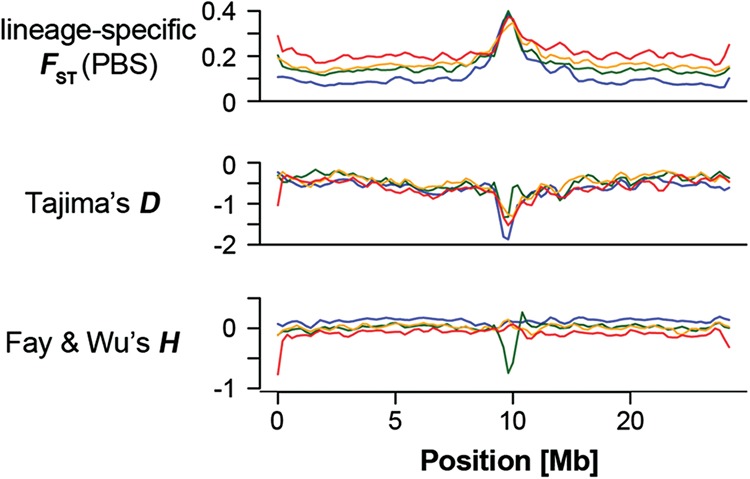
Speciation is a continuous process during which genetic changes gradually accumulate in the genomes of diverging species. Recent studies have documented highly heterogeneous differentiation landscapes, with distinct regions of elevated differentiation ("differentiation islands") widespread across genomes. However, it remains unclear which processes drive the evolution of differentiation islands; how the differentiation landscape evolves as speciation advances; and ultimately, how differentiation islands are related to speciation. Here, we addressed these questions based on population genetic analyses of 200 resequenced genomes from 10 populations of four Ficedula flycatcher sister species. We show that a heterogeneous differentiation landscape starts emerging among populations within species, and differentiation islands evolve recurrently in the very same genomic regions among independent lineages. Contrary to expectations from models that interpret differentiation islands as genomic regions involved in reproductive isolation that are shielded from gene flow, patterns of sequence divergence (d(xy) and relative node depth) do not support a major role of gene flow in the evolution of the differentiation landscape in these species. Instead, as predicted by models of linked selection, genome-wide variation in diversity and differentiation can be explained by variation in recombination rate and the density of targets for selection. We thus conclude that the heterogeneous landscape of differentiation in Ficedula flycatchers evolves mainly as the result of background selection and selective sweeps in genomic regions of low recombination. Our results emphasize the necessity of incorporating linked selection as a null model to identify genome regions involved in adaptation and speciation.


Figures

Figure 1.
Figure 1.
A recurrently evolving genomic landscape of differentiation across the speciation continuum in Ficedula flycatchers. (A) Species’ neighbor-joining tree based on mean genome-wide net sequence divergence (dA). The same species tree topology was inferred with 100% bootstrap support from the distribution of gene trees under the multispecies coalescent (Supplemental Fig. S1). (B) Map showing the locations of population sampling and approximate species ranges. (C) Population genomic parameters along an example chromosome (Chromosome 4A) (see Supplemental Figs. S2, S4 for all chromosomes). Color codes for specific–specific parameters: (blue) collared; (green) pied; (orange) Atlas; (red) semicollared. Color codes for dxy: (green) collared-pied; (light blue) collared-Atlas; (blue) collared-semicollared; (orange) pied-Atlas; (red) pied-semicollared; (black) Atlas-semicollared. For differentiation within species, comparisons with the Italian (collared) and Spanish (pied) populations are shown. Color codes for FST within collared flycatchers: (cyan) Italy–Hungary; (light blue) Italy–Czech Republic; (dark blue) Italy–Baltic. Color codes for FST within pied flycatchers: (light green) Spain–Sweden; (green) Spain–Czech Republic; (dark green) Spain–Baltic. (D) Distributions of differentiation (FST) from collared flycatcher along the speciation continuum. Distributions are given separately for three autosomal recombination percentiles (33%; 33%–66%; 66%–100%) corresponding to high (>3.4 cM/Mb, blue), intermediate (1.3–3.4 cM/Mb, orange), and low recombination rate (0–1.3 cM/Mb, red), and the Z Chromosome (green). Geographically close within-species comparison: Italy–Hungary. Comparisons within species include the geographically close Italian and Hungarian populations (within [close]), and the geographically distant Italian and Baltic populations (within [far]). Geographically far within-species comparison: Italy–Baltic. (E) Differentiation from collared flycatcher along an example chromosome (Chromosome 11) (see Supplemental Fig. S3 for all chromosomes). Color codes for between-species comparisons: (green) pied; (orange) Atlas; (red) semicollared; (dark red) red-breasted; (black) snowy-browed flycatcher. Color codes for within-species comparisons: (cyan) Italy–Hungary; (blue) Italy–Baltic. Flycatcher artwork in panel A courtesy of Dan Zetterström.
Figure 2.
Figure 2.
Differentiation in independent lineages and its correlation with recombination rate. (A) Correlation of FST in 200-kb windows among two phylogenetically independent comparisons (Pearson's correlation: R = 0.804, t = 96.6, P < 10−15). (B) Relationship between differentiation and recombination rate (r, cM/Mb). Differentiation is expressed as the first axis (PC1) from a PCA on lineage-specific FST (PBS; linear regression, t = −40.7, P < 10−15, R2 = 0.266).
Figure 3.
Figure 3.
Site-frequency spectrum statistics across an example chromosome (Chromosome 10). Color codes: (blue) collared; (green) pied; (orange) Atlas; (red) semicollared flycatcher. A signal of selection as indicated by negative Tajima's D is seen in the centrally located island in all species, while evidence for positive selection as indicated by negative Fay and Wu's H, i.e., an excess of high-frequency derived variants, is seen in only one species (pied flycatcher). See Supplemental Figure S2 for all chromosomes.

Similar articles

Cited by

References

    1. Alatalo RV, Eriksson D, Gustafsson L, Lundberg A. 1990. Hybridization between pied and collared flycatchers—sexual selection and speciation theory. J Evol Biol 3: 375–389.
    1. Altschul SF, Gish W, Miller W, Myers EW, Lipman DJ. 1990. Basic local alignment search tool. J Mol Biol 215: 403–410. - PubMed
    1. Andrew RL, Rieseberg LH. 2013. Divergence is focused on few genomic regions early in speciation: incipient speciation in sunflower ecotypes. Evolution 67: 2468–2482. - PubMed
    1. Backström N, Forstmeier W, Schielzeth H, Mellenius H, Nam K, Bolund E, Webster MT, Öst T, Schneider M, Kempenaers B, et al. 2010. The recombination landscape of the zebra finch Taeniopygia guttata genome. Genome Res 20: 485–495. - PMC - PubMed
    1. Backström N, Sætre GP, Ellegren H. 2013. Inferring the demographic history of European Ficedula flycatcher populations. BMC Evol Biol 13: 2. - PMC - PubMed

Publication types

Associated data