

Solid-state NMR investigations of cellulose structure and interactions with matrix polysaccharides in plant primary cell walls
- PMID: 26355148
- PMCID: PMC6280985
- DOI: 10.1093/jxb/erv416
Solid-state NMR investigations of cellulose structure and interactions with matrix polysaccharides in plant primary cell walls
Abstract
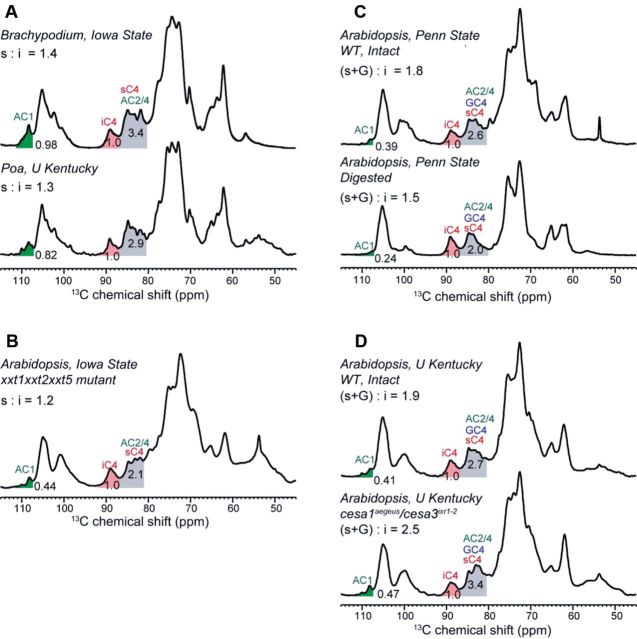
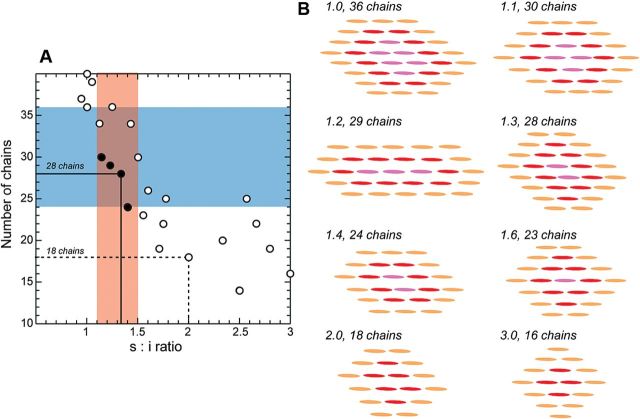
Until recently, the 3D architecture of plant cell walls was poorly understood due to the lack of high-resolution techniques for characterizing the molecular structure, dynamics, and intermolecular interactions of the wall polysaccharides in these insoluble biomolecular mixtures. We introduced multidimensional solid-state NMR (SSNMR) spectroscopy, coupled with (13)C labelling of whole plants, to determine the spatial arrangements of macromolecules in near-native plant cell walls. Here we review key evidence from 2D and 3D correlation NMR spectra that show relatively few cellulose-hemicellulose cross peaks but many cellulose-pectin cross peaks, indicating that cellulose microfibrils are not extensively coated by hemicellulose and all three major polysaccharides exist in a single network rather than two separate networks as previously proposed. The number of glucan chains in the primary-wall cellulose microfibrils has been under active debate recently. We show detailed analysis of quantitative (13)C SSNMR spectra of cellulose in various wild-type (WT) and mutant Arabidopsis and Brachypodium primary cell walls, which consistently indicate that primary-wall cellulose microfibrils contain at least 24 glucan chains.
Keywords: Arabidopsis; Brachypodium; cellulose microfibrils; dynamics; intermolecular contact; multidimensional correlation NMR..
© The Author 2015. Published by Oxford University Press on behalf of the Society for Experimental Biology. All rights reserved. For permissions, please email: journals.permissions@oup.com.
Figures
Similar articles
-
Structure and dynamics of Brachypodium primary cell wall polysaccharides from two-dimensional (13)C solid-state nuclear magnetic resonance spectroscopy.Biochemistry. 2014 May 6;53(17):2840-54. doi: 10.1021/bi500231b. Epub 2014 Apr 22. Biochemistry. 2014. PMID: 24720372
-
Multidimensional solid-state NMR studies of the structure and dynamics of pectic polysaccharides in uniformly 13C-labeled Arabidopsis primary cell walls.Magn Reson Chem. 2012 Aug;50(8):539-50. doi: 10.1002/mrc.3836. Epub 2012 Jul 8. Magn Reson Chem. 2012. PMID: 22777793
-
Cellulose-Pectin Spatial Contacts Are Inherent to Never-Dried Arabidopsis Primary Cell Walls: Evidence from Solid-State Nuclear Magnetic Resonance.Plant Physiol. 2015 Jul;168(3):871-84. doi: 10.1104/pp.15.00665. Epub 2015 Jun 2. Plant Physiol. 2015. PMID: 26036615 Free PMC article.
-
Multidimensional solid-state NMR spectroscopy of plant cell walls.Solid State Nucl Magn Reson. 2016 Sep;78:56-63. doi: 10.1016/j.ssnmr.2016.08.001. Epub 2016 Aug 13. Solid State Nucl Magn Reson. 2016. PMID: 27552739 Free PMC article. Review.
-
Composition of plant cell walls.Z Lebensm Unters Forsch. 1995;200(1):24-31. doi: 10.1007/BF01192903. Z Lebensm Unters Forsch. 1995. PMID: 7732730 Review.
Cited by
-
Saccharide analysis of onion outer epidermal walls.Biotechnol Biofuels. 2021 Mar 15;14(1):66. doi: 10.1186/s13068-021-01923-z. Biotechnol Biofuels. 2021. PMID: 33722273 Free PMC article.
-
Solid-State NMR Investigations of Extracellular Matrixes and Cell Walls of Algae, Bacteria, Fungi, and Plants.Chem Rev. 2022 May 25;122(10):10036-10086. doi: 10.1021/acs.chemrev.1c00669. Epub 2021 Dec 8. Chem Rev. 2022. PMID: 34878762 Free PMC article. Review.
-
Sugar release and growth of biofuel crops are improved by downregulation of pectin biosynthesis.Nat Biotechnol. 2018 Mar;36(3):249-257. doi: 10.1038/nbt.4067. Epub 2018 Feb 12. Nat Biotechnol. 2018. PMID: 29431741
-
Mucilicious methods: Navigating the tools developed to Arabidopsis Seed Coat Mucilage analysis.Cell Surf. 2024 Dec 11;13:100134. doi: 10.1016/j.tcsw.2024.100134. eCollection 2025 Jun. Cell Surf. 2024. PMID: 39758276 Free PMC article. Review.
-
Cellulose synthase complex organization and cellulose microfibril structure.Philos Trans A Math Phys Eng Sci. 2018 Feb 13;376(2112):20170048. doi: 10.1098/rsta.2017.0048. Philos Trans A Math Phys Eng Sci. 2018. PMID: 29277745 Free PMC article. Review.
References
-
- Atalla RH, VanderHart DL. 1984. Native cellulose: a composite of two distinct crystalline forms. Science 223, 283–285. - PubMed
-
- Atalla RH, VanderHart DL. 1999. The role of solid state 13C NMR spectroscopy in studies of the nature of native celluloses. Solid State Nuclear Magnetic Resonance 15, 1–19. - PubMed
-
- Bardet M, Emsley L, Vincendon M. 1997. Two-dimensional spin-exchange solid-state NMR studies of 13 C-enriched wood. Solid State Nuclear Magnetic Resonance 8, 25–32. - PubMed
-
- Bax A, Freeman R, Kempsell SP. 1980. Natural abundance 13C-13C coupling observed via double-quantum coherence. Journal of the Amercian Chemical Society 102, 4849–4851.
-
- Bootten TJ, Harris PJ, Melton LD, Newman RH. 2004. Solid-state 13C-NMR spectroscopy shows that the xyloglucans in the primary cell walls of mung bean (Vigna radiata L.) occur in different domains: a new model for xyloglucan-cellulose interactions in the cell wall. Journal of Experimental Botany 55, 571–583. - PubMed
Publication types
MeSH terms
Substances
Grants and funding
LinkOut - more resources
Full Text Sources
Other Literature Sources
