

Different Oceanographic Regimes in the Vicinity of the Antarctic Peninsula Reflected in Benthic Nematode Communities
- PMID: 26355457
- PMCID: PMC4565677
- DOI: 10.1371/journal.pone.0137527
Different Oceanographic Regimes in the Vicinity of the Antarctic Peninsula Reflected in Benthic Nematode Communities
Abstract
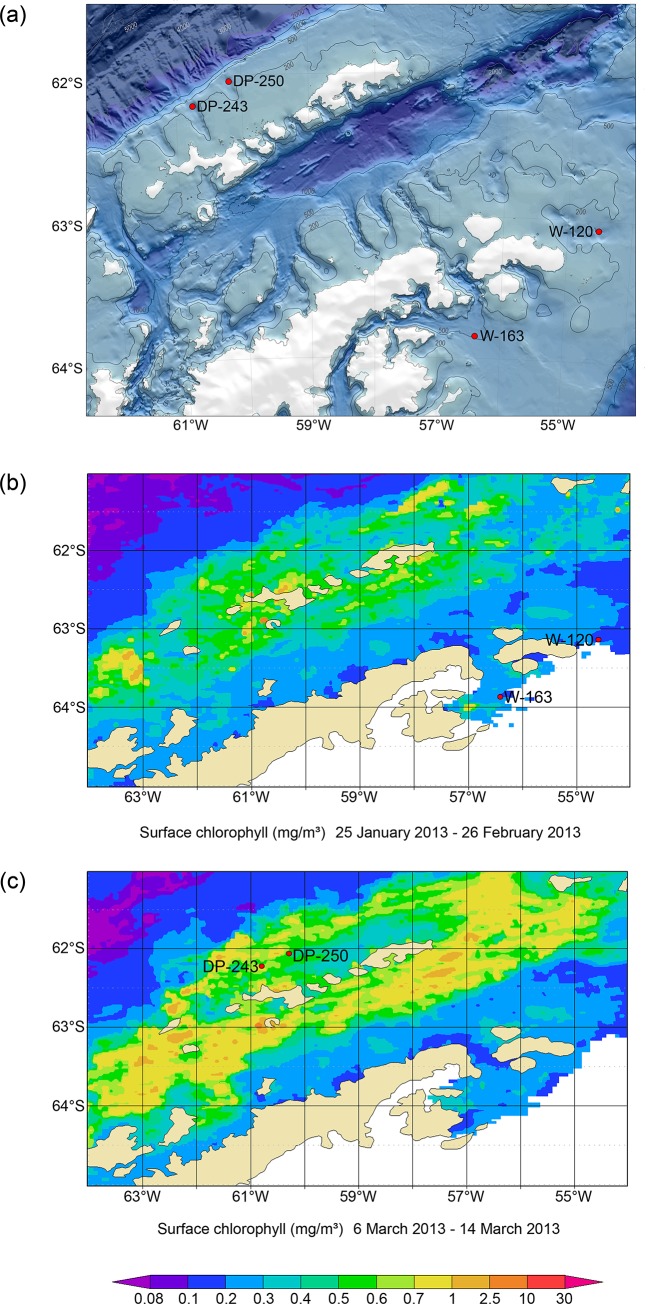
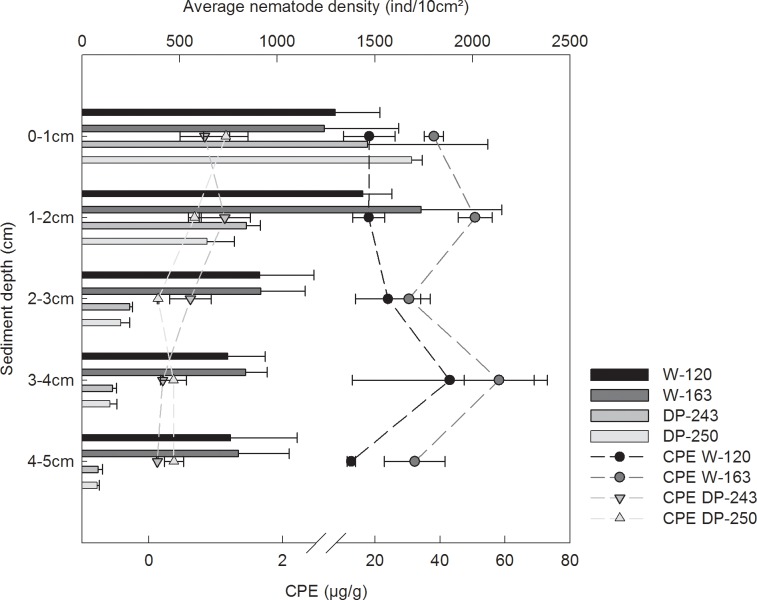
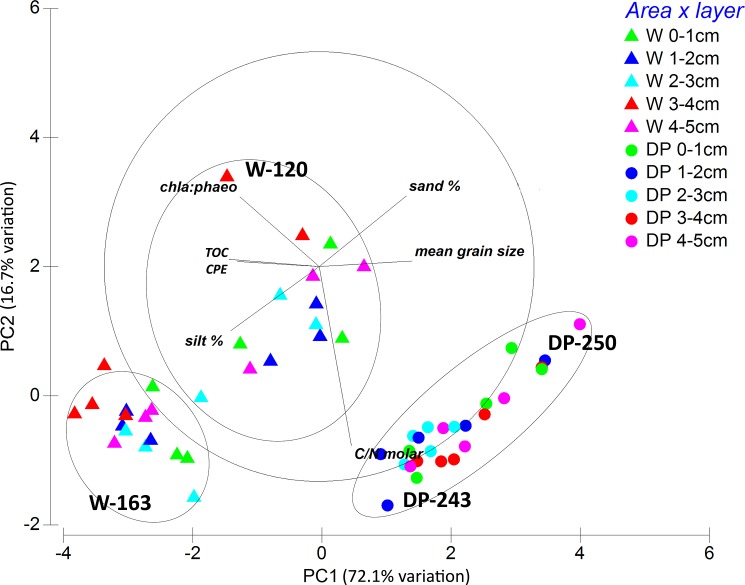
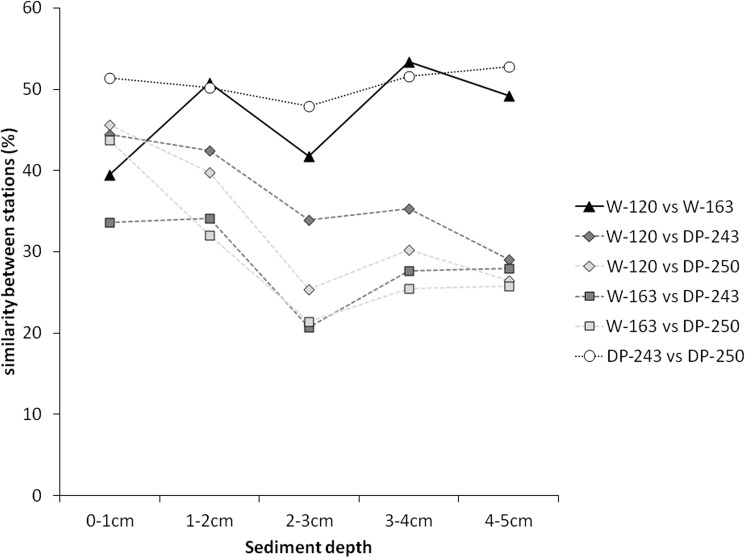
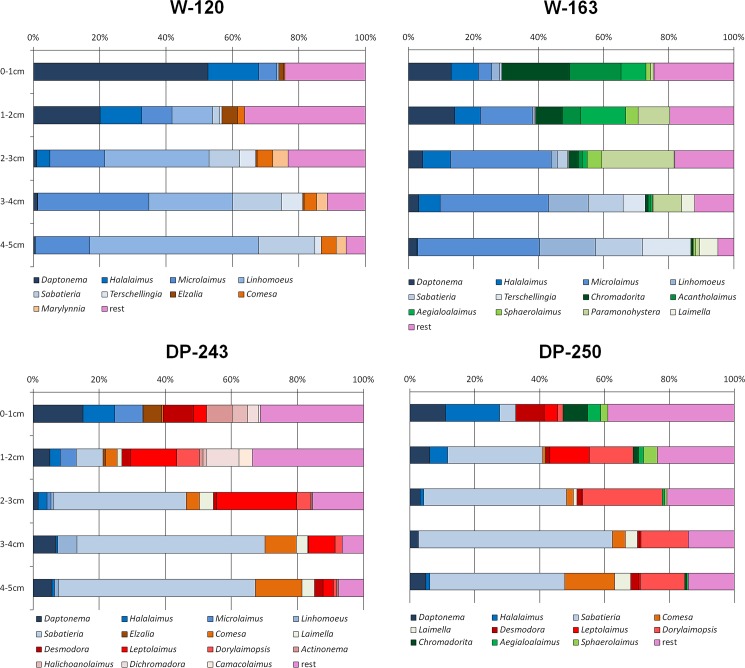
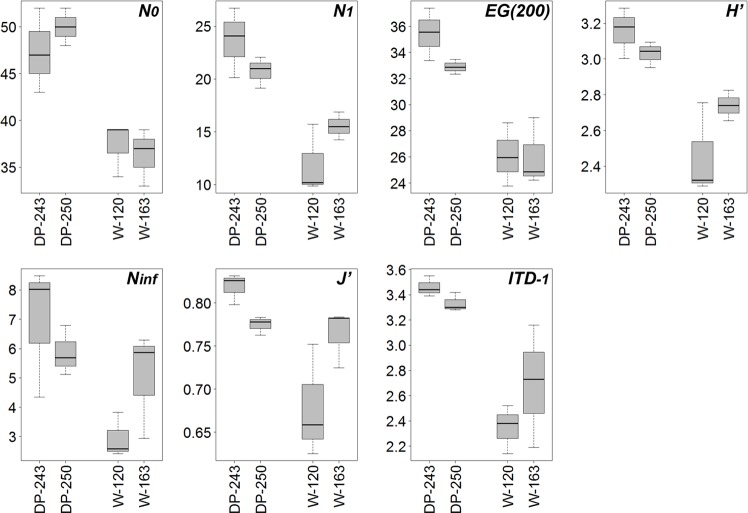
Marine free-living nematode communities were studied at similar depths (~500 m) at two sides of the Antarctic Peninsula, characterised by different environmental and oceanographic conditions. At the Weddell Sea side, benthic communities are influenced by cold deep-water formation and seasonal sea-ice conditions, whereas the Drake Passage side experiences milder oceanic conditions and strong dynamics of the Antarctic Circumpolar Current. This resulted in different surface primary productivity, which contrasted with observed benthic pigment patterns and varied according to the area studied: chlorophyll a concentrations (as a proxy for primary production) were high in the Weddell Sea sediments, but low in the surface waters above; this pattern was reversed in the Drake Passage. Differences between areas were largely mirrored by the nematode communities: nematode densities peaked in Weddell stations and showed deeper vertical occurrence in the sediment, associated with deeper penetration of chlorophyll a and indicative of a strong bentho-pelagic coupling. Generic composition showed some similarities across both areas, though differences in the relative contribution of certain genera were noted, together with distinct community shifts with depth in the sediment at all locations.
Conflict of interest statement
Figures
Similar articles
-
Distinct genetic differentiation and species diversification within two marine nematodes with different habitat preference in Antarctic sediments.BMC Evol Biol. 2017 May 30;17(1):120. doi: 10.1186/s12862-017-0968-1. BMC Evol Biol. 2017. PMID: 28558672 Free PMC article.
-
Characterisation of the nematode community of a low-activity cold seep in the recently ice-shelf free Larsen B area, Eastern Antarctic Peninsula.PLoS One. 2011;6(7):e22240. doi: 10.1371/journal.pone.0022240. Epub 2011 Jul 20. PLoS One. 2011. PMID: 21799799 Free PMC article.
-
Effects of hydrographic variability on the spatial, seasonal and diel diving patterns of southern elephant seals in the eastern Weddell Sea.PLoS One. 2010 Nov 3;5(11):e13816. doi: 10.1371/journal.pone.0013816. PLoS One. 2010. PMID: 21072199 Free PMC article.
-
Climate change and the marine ecosystem of the western Antarctic Peninsula.Philos Trans R Soc Lond B Biol Sci. 2007 Jan 29;362(1477):149-66. doi: 10.1098/rstb.2006.1958. Philos Trans R Soc Lond B Biol Sci. 2007. PMID: 17405211 Free PMC article. Review.
-
Effects of shallow-water hydrothermal venting on biological communities of coastal marine ecosystems of the western Pacific.Adv Mar Biol. 2006;50:267-421. doi: 10.1016/S0065-2881(05)50004-X. Adv Mar Biol. 2006. PMID: 16782453 Review.
Cited by
-
Spatial and temporal dynamics of Antarctic shallow soft-bottom benthic communities: ecological drivers under climate change.BMC Ecol. 2019 Jul 1;19(1):27. doi: 10.1186/s12898-019-0244-x. BMC Ecol. 2019. PMID: 31262299 Free PMC article.
-
Revealing higher than expected meiofaunal diversity in Antarctic sediments: a metabarcoding approach.Sci Rep. 2017 Jul 21;7(1):6094. doi: 10.1038/s41598-017-06687-x. Sci Rep. 2017. PMID: 28733608 Free PMC article.
-
Distinct genetic differentiation and species diversification within two marine nematodes with different habitat preference in Antarctic sediments.BMC Evol Biol. 2017 May 30;17(1):120. doi: 10.1186/s12862-017-0968-1. BMC Evol Biol. 2017. PMID: 28558672 Free PMC article.
References
-
- Lawver LA, Gahagan L (2003) Evolution of Cenozoic seaways in the circum-Antarctic region. Palaeogeography, Palaeoclimatology, Palaeoecology 198: 11–37.
-
- Thomson MRA (2004) Geological and palaeoenvironmental history of the Scotia Sea region as a basis for biological interpretation. Deep-Sea Research II 51: 1467–1487.
-
- Barker PF, Thomas E (2004) Origin, signature and palaeoclimatic influence of the Antarctic Circumpolar Current. Earth-Science Reviews 66: 143–162.
-
- Barker PF (2001) Scotia Sea regional tectonic evolution: implications for mantle flow and palaeocirculation. Earth-Science Reviews 55: 1–39.
-
- Damereau M, Matschiner M, Salzburger W, Hanel R (2012) Comparative population genetics of seven notothenioid fish species reveals high levels of gene flow along ocean currents in the southern Scotia Arc, Antarctica. Polar Biology 35: 1073–1086.
Publication types
MeSH terms
Substances
LinkOut - more resources
Full Text Sources
Other Literature Sources
