. 2014 Jan-Feb;11(1):128-41.
doi: 10.1109/TCBB.2013.152.

CAMS-RS: Clustering Algorithm for Large-Scale Mass Spectrometry Data Using Restricted Search Space and Intelligent Random Sampling

CAMS-RS: Clustering Algorithm for Large-Scale Mass Spectrometry Data Using Restricted Search Space and Intelligent Random Sampling

Fahad Saeed et al. IEEE/ACM Trans Comput Biol Bioinform. 2014 Jan-Feb.

Abstract

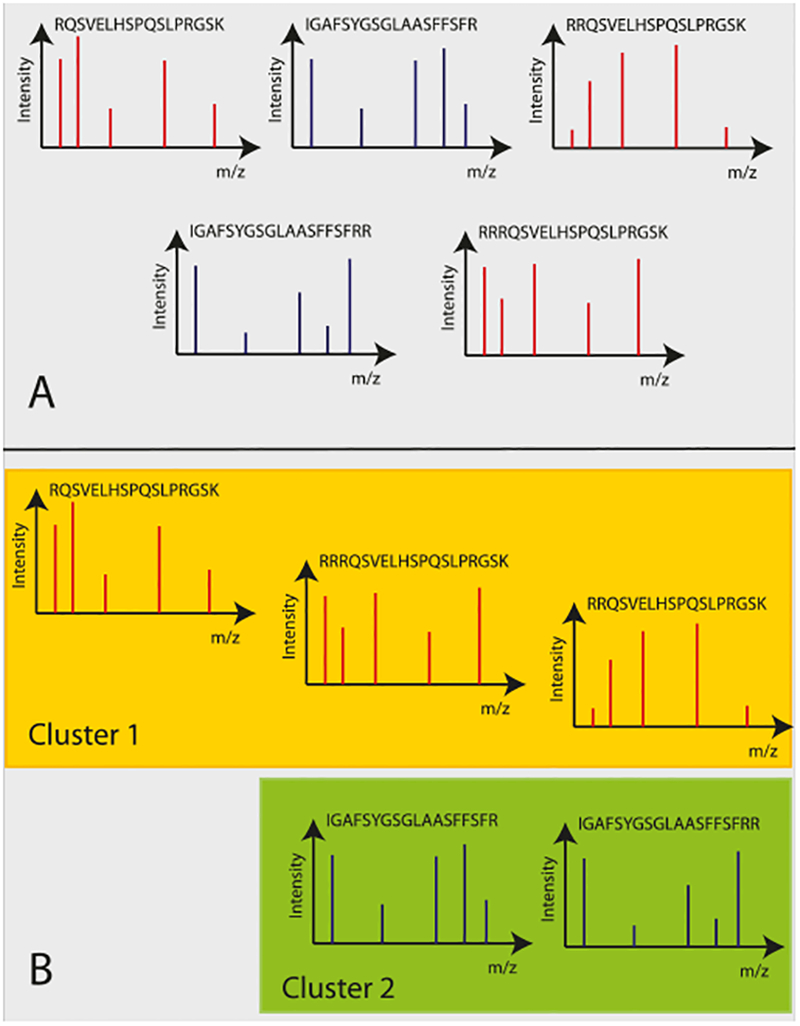
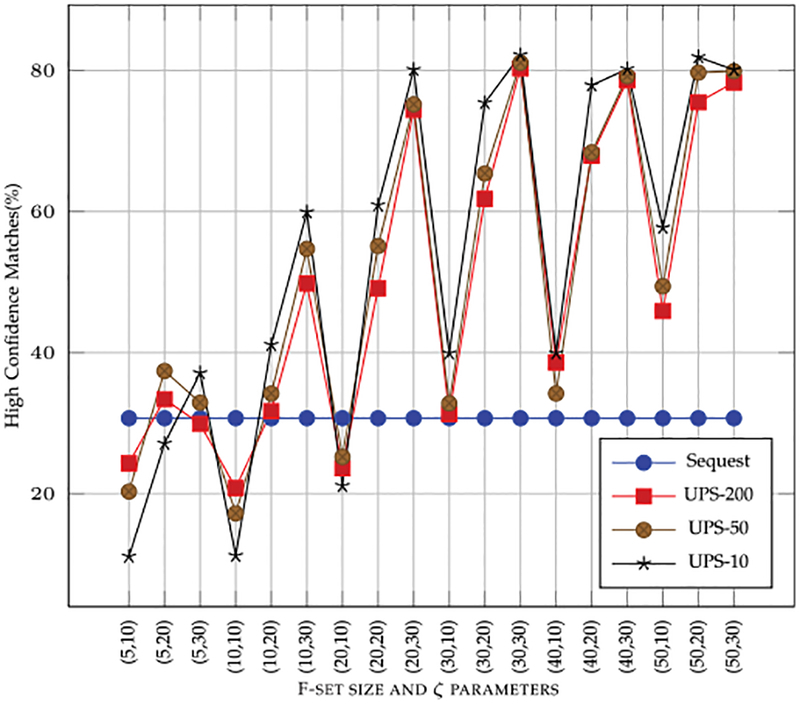
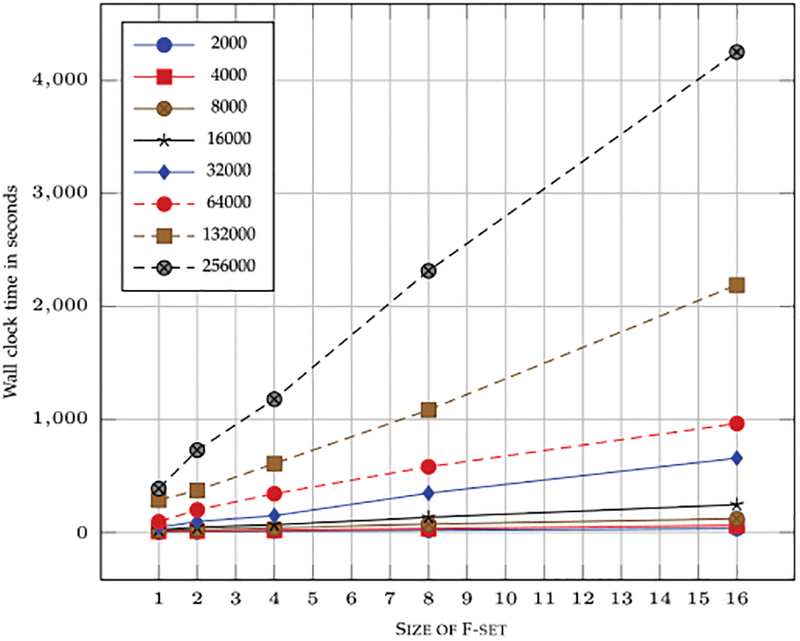
High-throughput mass spectrometers can produce massive amounts of redundant data at an astonishing rate with many of them having poor signal-to-noise (S/N) ratio. These low S/N ratio spectra may not get interpreted using conventional spectra-to-database matching techniques. In this paper, we present an efficient algorithm, CAMS-RS (Clustering Algorithm for Mass Spectra using Restricted Space and Sampling) for clustering of raw mass spectrometry data. CAMS-RS utilizes a novel metric (called F-set) that exploits the temporal and spatial patterns to accurately assess similarity between two given spectra. The F-set similarity metric is independent of the retention time and allows clustering of mass spectrometry data from independent LC-MS/MS runs. A novel restricted search space strategy is devised to limit the comparisons of the number of spectra. An intelligent sampling method is executed on individual bins that allow merging of the results to make the final clusters. Our experiments, using experimentally generated data sets, show that the proposed algorithm is able to cluster spectra with high accuracy and is helpful in interpreting low S/N ratio spectra. The CAMS-RS algorithm is highly scalable with increasing number of spectra and our implementation allows clustering of up to a million spectra within minutes.


Figures

Fig. 1.
Fig. 1.
An example of spectral clustering. As shown in Section A of the figure, there are multiple spectra and each spectrum corresponds to a single peptide. Section B shows the clustered spectra. Note that, spectra that have been clustered together (shown with same color) correspond either to the same peptide (Cluster 2) or highly similar peptides with missed cleavages (Cluster 1).
Fig. 2.
Fig. 2.
Summary of CAMS-RS search space restriction and sampling.
Fig. 3.
Fig. 3.
Three spectra are shown in the figure. The first two spectra shown in A, D and B, E map to the same peptides whereas the third spectra shown in C, F belong to a different peptide. As can be seen in the figures A B and C that even though third spectra (C) is not similar to the first two spectra (A and B), there is a significant overlap between the spectra. However, if we make F-sets (of size 3 in this example) of the same peaks and spectra, it is clear that the sets formed do not have much in common for that spectra that is not related. The F-sets produced are: B → (b, d, f)(d, f, h)(f, h, l)(h, l, n), D →(b, d, f)(d, f, h)(f, h, j)(h, j, n) and F → (b, d, g)(d, g, l)(g, l, m)(l, m, n). It can be seen that after making F-sets, F do not have anything in common when compared to D and E, which have altogether different F-sets.
Fig. 4.
Fig. 4.
Vertical and horizontal search space restriction is depicted for CAMS-RS. The x-axis represents the mass of the spectra and the vertical axis represents F-sets that have been generated. The highlighted part is the space that is searched for establishing the similarity of two given spectra.
Fig. 5.
Fig. 5.
Observed wall clock time for non-balanced and load-balanced bins with increasing number of spectra.
Fig. 6.
Fig. 6.
The flowchart of quality assessment procedure followed to assess the accuracy and effectiveness of the clustering algorithm.
Fig. 7.
Fig. 7.
The average weighted accuracy is shown with increasing F-set size for CID as well as HCD data sets. ζ is constant at 30. The results are shown only for AQP2 peptides known to be in the sample. The key of the graph are: A = AQP2-H-(S256/S261)-HCD, B = AQP2-H-(S256/S261)-CID, C = AQP2-L-(S256/S261)-HCD, D = AQP2-L-(S256/S261)-CID. All data sets A, B, C, D are produced in independent experimental runs. The data is combined post-experiment to illustrate the usefulness of the algorithm for a combination of independently generated data sets.
Fig. 8.
Fig. 8.
Quality of clustering with varying F-set size and threshold ζ. The graph shows the average weighted accuracy for different F-set size and ζ shown as x-axis parameters (F-set size, ζ). Note that the accuracy is calculated by comparing with Sequest search results. All data sets UPS-200, UPS-50 and UPS-10 are produced in independent experimental runs. The data is combined post-experiment to illustrate the usefulness of the algorithm for a combination of independently generated data sets.
Fig. 9.
Fig. 9.
The variation in sensitivity of the clustering results with varying F-set size and threshold ζ. The graph shows the sensitivity (percent) for different F-set size and z shown as x-axis parameters (F-set size, ζ).
Fig. 10.
Fig. 10.
The effect of clustering with varying F-set size and threshold ζ on the number of high confidence matches for a said data. The high confidence matches using Sequest, without clustering, is also shown as a reference. The x-axis parameters are (F-set size, ζ).
Fig. 11.
Fig. 11.
The effect of clustering with varying F-set size and threshold ζ on the number of non-high (medium + low) confidence matches for a said data. The high confidence matches using Sequest, without clustering, is also shown as a reference. The x-axis parameters are (F-set size, ζ).
Fig. 12.
Fig. 12.
The effect of clustering with varying F-set size and threshold ζ on the number of number of peptides that are not part of the UPS2 protein family. The peptide matches to UPS2 proteins using Sequest, without clustering, is also shown as a reference. With increasing clustering accuracy, the number of peptides that are not part UPS2 decreases, i.e., more percentage of peptides get identified in UPS2 group. The x-axis parameters are (F-set size, ζ).
Fig. 13.
Fig. 13.
Wall clock time with increasing size of the F-set and number of spectra.
Fig. 14.
Fig. 14.
Wall clock time with increasing size of the data set with constant F-set size of 7.

References

    1. Beer I, Barnea E, Ziv T, and Admon A, “Improving Large-Scale Proteomics by Clustering of Mass Spectrometry Data,” Proteomics, vol. 4, no. 4, pp. 950–960, 2004. - PubMed
    1. Bensmail H, Golek J, Moody M, Semmes J, and Haoudi A, “A Novel Approach for Clustering Proteomics Data Using Bayesian Fast Fourier Transform,” Bioinformatics, vol. 21, no. 10, pp. 2210–2224, 2005. - PubMed
    1. De Souza D, Saunders E, McConville M, and Likić V, “Progressive Peak Clustering in Gc-Ms Metabolomic Experiments Applied to Leishmania Parasites,” Bioinformatics, vol. 22, no. 11, pp. 1391–1396, 2006. - PubMed
    1. Du X, Yang F, Manes NP, Stenoien DL, Monroe ME, Adkins JN, States DJ, Purvine SO, Camp DG II, and Smith RD, “Linear Discriminant Analysis-Based Estimation of the False Discovery Rate for Phosphopeptide Identifications,” J. Proteome Research, vol. 7, no. 6, pp. 2195–2203, 2008. - PMC - PubMed
    1. Dutta D and Chen T, “Speeding up Tandem Mass Spectrometry Database Search: Metric Embeddings and Fast Near Neighbor Search,” Bioinformatics, vol. 23, no. 5, pp. 612–618, 2007. - PubMed

Publication types