

Inhibitory Effects of Cytosolic Ca(2+) Concentration by Ginsenoside Ro Are Dependent on Phosphorylation of IP3RI and Dephosphorylation of ERK in Human Platelets
- PMID: 26355658
- PMCID: PMC4556879
- DOI: 10.1155/2015/764906
Inhibitory Effects of Cytosolic Ca(2+) Concentration by Ginsenoside Ro Are Dependent on Phosphorylation of IP3RI and Dephosphorylation of ERK in Human Platelets
Abstract
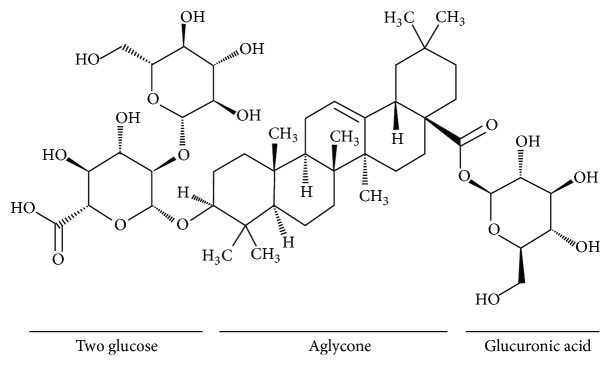
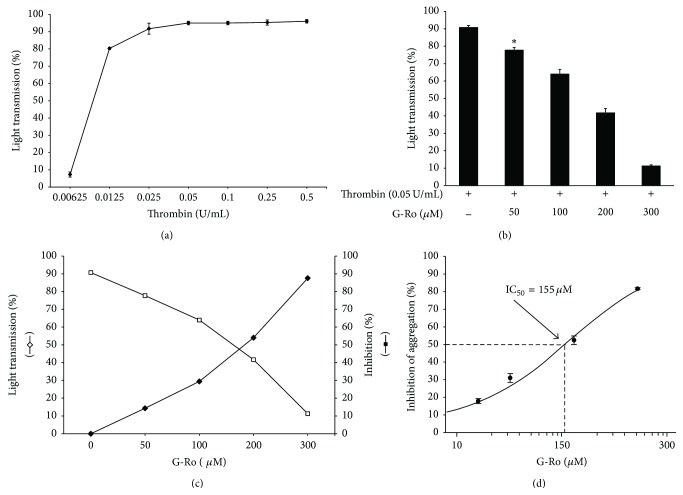
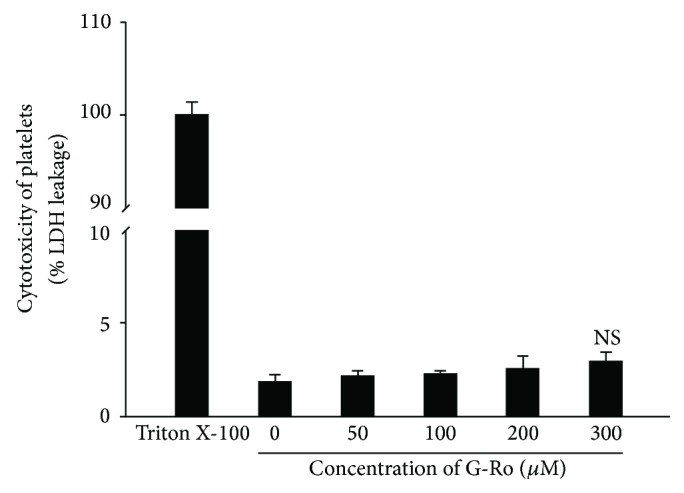
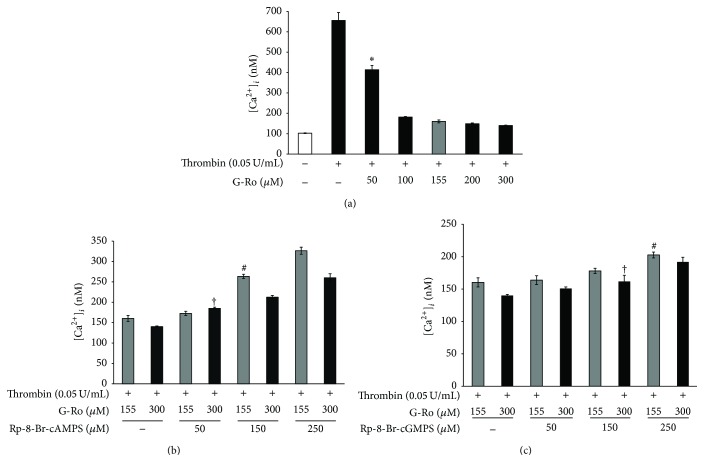
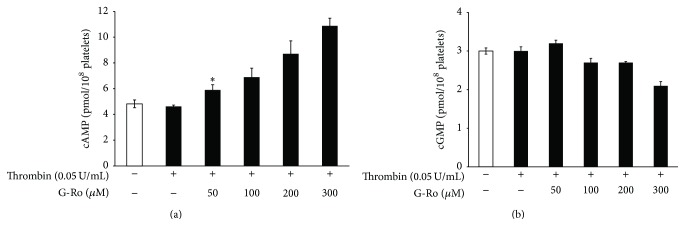
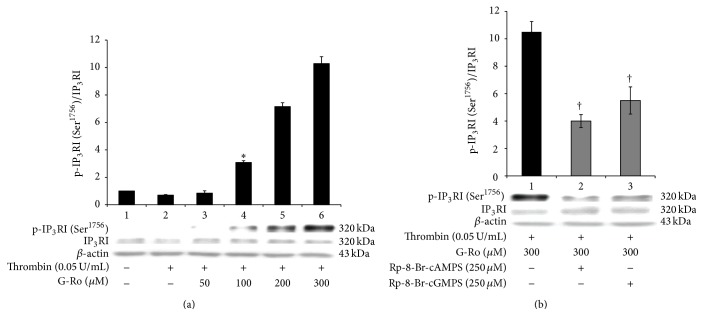
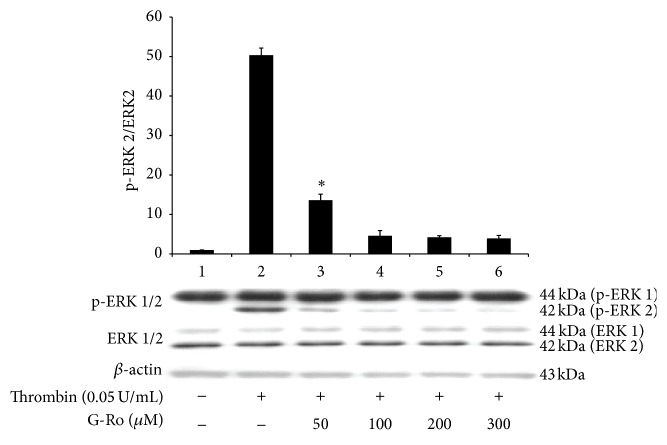
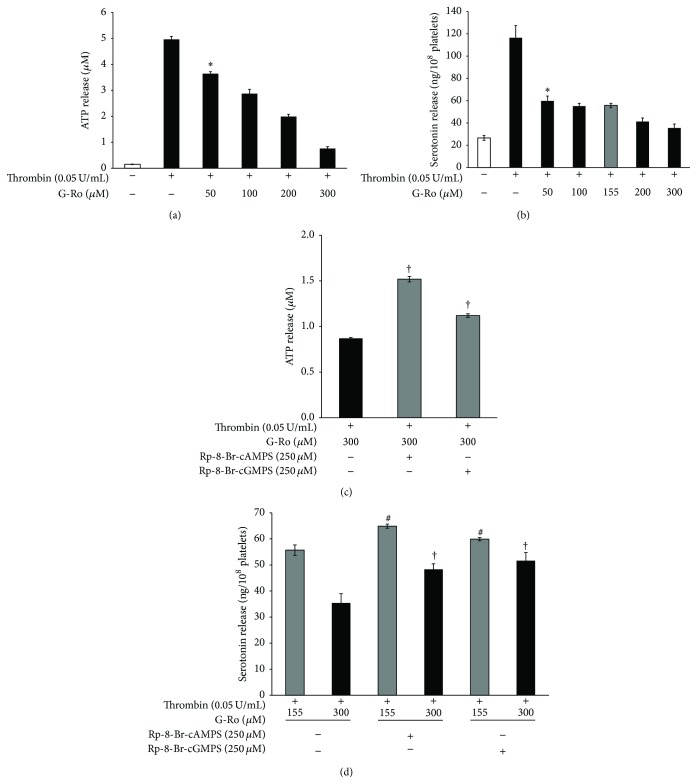
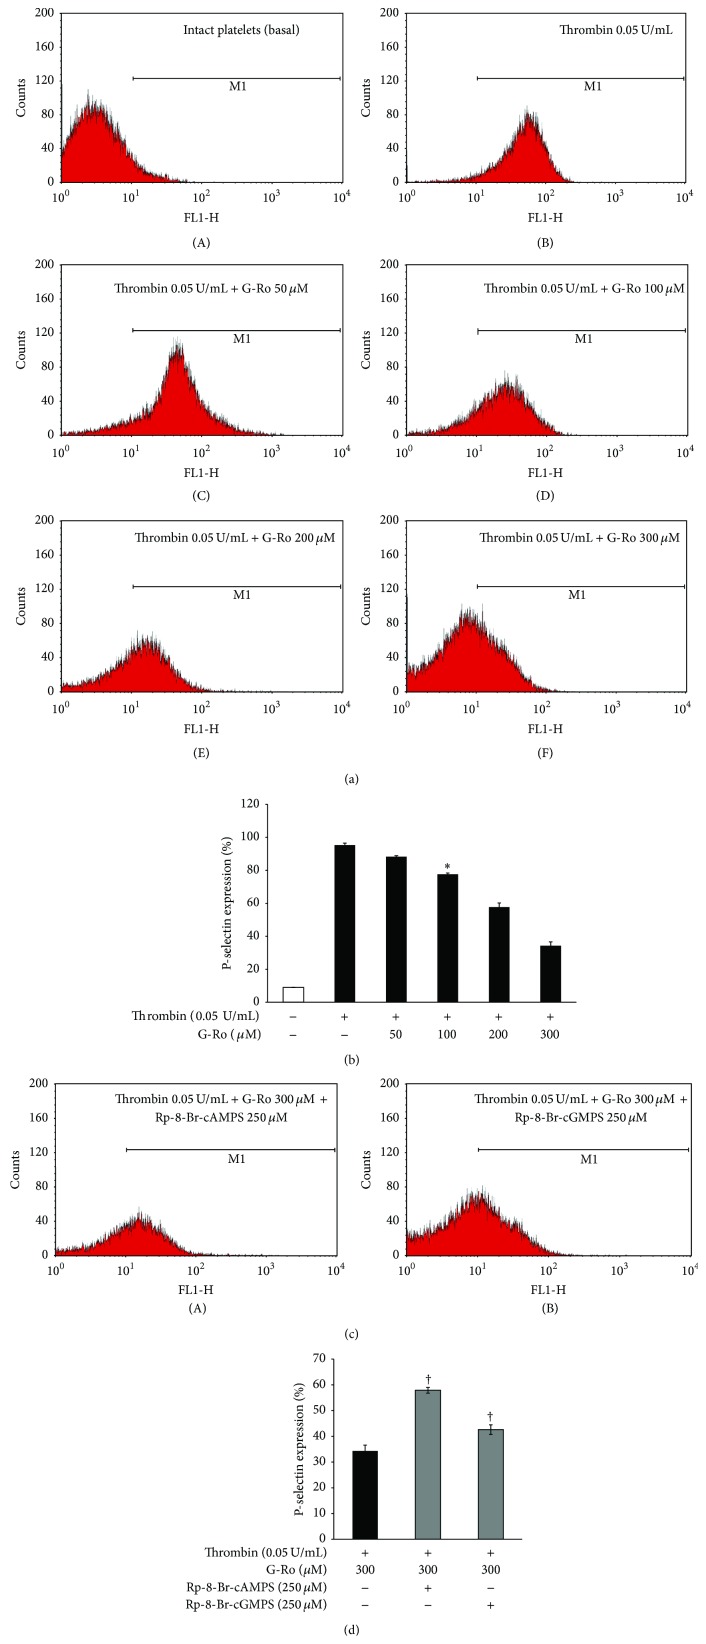
Intracellular Ca(2+) ([Ca(2+)] i ) is platelet aggregation-inducing molecule and is involved in activation of aggregation associated molecules. This study was carried out to understand the Ca(2+)-antagonistic effect of ginsenoside Ro (G-Ro), an oleanane-type saponin in Panax ginseng. G-Ro, without affecting leakage of lactate dehydrogenase, dose-dependently inhibited thrombin-induced platelet aggregation, and the half maximal inhibitory concentration was approximately 155 μM. G-Ro inhibited strongly thrombin-elevated [Ca(2+)] i , which was strongly increased by A-kinase inhibitor Rp-8-Br-cAMPS compared to G-kinase inhibitor Rp-8-Br-cGMPS. G-Ro increased the level of cAMP and subsequently elevated the phosphorylation of inositol 1, 4, 5-triphosphate receptor I (IP3RI) (Ser(1756)) to inhibit [Ca(2+)] i mobilization in thrombin-induced platelet aggregation. Phosphorylation of IP3RI (Ser(1756)) by G-Ro was decreased by PKA inhibitor Rp-8-Br-cAMPS. In addition, G-Ro inhibited thrombin-induced phosphorylation of ERK 2 (42 kDa), indicating inhibition of Ca(2+) influx across plasma membrane. We demonstrate that G-Ro upregulates cAMP-dependent IP3RI (Ser(1756)) phosphorylation and downregulates phosphorylation of ERK 2 (42 kDa) to decrease thrombin-elevated [Ca(2+)] i , which contributes to inhibition of ATP and serotonin release, and p-selectin expression. These results indicate that G-Ro in Panax ginseng is a beneficial novel Ca(2+)-antagonistic compound and may prevent platelet aggregation-mediated thrombotic disease.
Figures
Similar articles
-
Inhibitory Effect of 20(S)-Ginsenoside Rg3 on Human Platelet Aggregation and Intracellular Ca2+ Levels via Cyclic Adenosine Monophosphate Dependent Manner.Prev Nutr Food Sci. 2018 Dec;23(4):317-325. doi: 10.3746/pnf.2018.23.4.317. Epub 2018 Dec 31. Prev Nutr Food Sci. 2018. PMID: 30675461 Free PMC article.
-
Inhibitory effects of total saponin from Korean Red Ginseng on [Ca(2+)]i mobilization through phosphorylation of cyclic adenosine monophosphate-dependent protein kinase catalytic subunit and inositol 1,4,5-trisphosphate receptor type I in human platelets.J Ginseng Res. 2015 Oct;39(4):354-64. doi: 10.1016/j.jgr.2015.03.006. Epub 2015 Mar 28. J Ginseng Res. 2015. PMID: 26869828 Free PMC article.
-
Antiplatelet effects of caffeic acid due to Ca(2+) mobilizationinhibition via cAMP-dependent inositol-1, 4, 5-trisphosphate receptor phosphorylation.J Atheroscler Thromb. 2014;21(1):23-37. doi: 10.5551/jat.18994. Epub 2013 Oct 2. J Atheroscler Thromb. 2014. PMID: 24088646
-
Inhibitory effects of total saponin from Korean red ginseng via vasodilator-stimulated phosphoprotein-Ser(157) phosphorylation on thrombin-induced platelet aggregation.J Ginseng Res. 2013 Apr;37(2):176-86. doi: 10.5142/jgr.2013.37.176. J Ginseng Res. 2013. PMID: 23717170 Free PMC article.
-
Total saponin from Korean Red Ginseng inhibits binding of adhesive proteins to glycoprotein IIb/IIIa via phosphorylation of VASP (Ser(157)) and dephosphorylation of PI3K and Akt.J Ginseng Res. 2016 Jan;40(1):76-85. doi: 10.1016/j.jgr.2015.05.004. Epub 2015 May 21. J Ginseng Res. 2016. PMID: 26843825 Free PMC article.
Cited by
-
Structural Characters and Pharmacological Activity of Protopanaxadiol-Type Saponins and Protopanaxatriol-Type Saponins from Ginseng.Adv Pharmacol Pharm Sci. 2024 Jun 24;2024:9096774. doi: 10.1155/2024/9096774. eCollection 2024. Adv Pharmacol Pharm Sci. 2024. PMID: 38957183 Free PMC article. Review.
-
Inhibitory Effects of Ginsenoside Ro on Clot Retraction through Suppressing PI3K/Akt Signaling Pathway in Human Platelets.Prev Nutr Food Sci. 2019 Mar;24(1):56-63. doi: 10.3746/pnf.2019.24.1.56. Epub 2019 Mar 31. Prev Nutr Food Sci. 2019. PMID: 31008097 Free PMC article.
-
Transcriptome-Wide Identification and Integrated Analysis of a UGT Gene Involved in Ginsenoside Ro Biosynthesis in Panax ginseng.Plants (Basel). 2024 Feb 23;13(5):604. doi: 10.3390/plants13050604. Plants (Basel). 2024. PMID: 38475452 Free PMC article.
-
Short-Term E-Cigarette Exposure Increases the Risk of Thrombogenesis and Enhances Platelet Function in Mice.J Am Heart Assoc. 2018 Jul 18;7(15):e009264. doi: 10.1161/JAHA.118.009264. J Am Heart Assoc. 2018. PMID: 30021806 Free PMC article.
-
Inhibitory Effect of 20(S)-Ginsenoside Rg3 on Human Platelet Aggregation and Intracellular Ca2+ Levels via Cyclic Adenosine Monophosphate Dependent Manner.Prev Nutr Food Sci. 2018 Dec;23(4):317-325. doi: 10.3746/pnf.2018.23.4.317. Epub 2018 Dec 31. Prev Nutr Food Sci. 2018. PMID: 30675461 Free PMC article.
References
LinkOut - more resources
Full Text Sources
Other Literature Sources
Research Materials
Miscellaneous
