Mitigation of impedance changes due to electroporation therapy using bursts of high-frequency bipolar pulses
- PMID: 26355870
- PMCID: PMC4565149
- DOI: 10.1186/1475-925X-14-S3-S3
Mitigation of impedance changes due to electroporation therapy using bursts of high-frequency bipolar pulses
Abstract
Background: For electroporation-based therapies, accurate modeling of the electric field distribution within the target tissue is important for predicting the treatment volume. In response to conventional, unipolar pulses, the electrical impedance of a tissue varies as a function of the local electric field, leading to a redistribution of the field. These dynamic impedance changes, which depend on the tissue type and the applied electric field, need to be quantified a priori, making mathematical modeling complicated. Here, it is shown that the impedance changes during high-frequency, bipolar electroporation therapy are reduced, and the electric field distribution can be approximated using the analytical solution to Laplace's equation that is valid for a homogeneous medium of constant conductivity.
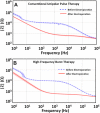
Methods: Two methods were used to examine the agreement between the analytical solution to Laplace's equation and the electric fields generated by 100 µs unipolar pulses and bursts of 1 µs bipolar pulses. First, pulses were applied to potato tuber tissue while an infrared camera was used to monitor the temperature distribution in real-time as a corollary to the electric field distribution. The analytical solution was overlaid on the thermal images for a qualitative assessment of the electric fields. Second, potato ablations were performed and the lesion size was measured along the x- and y-axes. These values were compared to the analytical solution to quantify its ability to predict treatment outcomes. To analyze the dynamic impedance changes due to electroporation at different frequencies, electrical impedance measurements (1 Hz to 1 MHz) were made before and after the treatment of potato tissue.
Results: For high-frequency bipolar burst treatment, the thermal images closely mirrored the constant electric field contours. The potato tissue lesions differed from the analytical solution by 39.7 ± 1.3 % (x-axis) and 6.87 ± 6.26 % (y-axis) for conventional unipolar pulses, and 15.46 ± 1.37 % (x-axis) and 3.63 ± 5.9 % (y-axis) for high- frequency bipolar pulses.
Conclusions: The electric field distributions due to high-frequency, bipolar electroporation pulses can be closely approximated with the homogeneous analytical solution. This paves way for modeling fields without prior characterization of non-linear tissue properties, and thereby simplifying electroporation procedures.
Figures


Similar articles
-
Modeling of electric field distribution in tissues during electroporation.Biomed Eng Online. 2013 Feb 21;12:16. doi: 10.1186/1475-925X-12-16. Biomed Eng Online. 2013. PMID: 23433433 Free PMC article.
-
Characterization of Nonlinearity and Dispersion in Tissue Impedance During High-Frequency Electroporation.IEEE Trans Biomed Eng. 2018 Oct;65(10):2190-2201. doi: 10.1109/TBME.2017.2787038. Epub 2017 Dec 25. IEEE Trans Biomed Eng. 2018. PMID: 29989955
-
The role of additional pulses in electropermeabilization protocols.PLoS One. 2014 Dec 1;9(12):e113413. doi: 10.1371/journal.pone.0113413. eCollection 2014. PLoS One. 2014. PMID: 25437512 Free PMC article.
-
Microsecond and nanosecond electric pulses in cancer treatments.Bioelectromagnetics. 2012 Feb;33(2):106-23. doi: 10.1002/bem.20692. Epub 2011 Aug 3. Bioelectromagnetics. 2012. PMID: 21812011 Review.
-
Therapeutic perspectives of high pulse repetition rate electroporation.Bioelectrochemistry. 2024 Apr;156:108629. doi: 10.1016/j.bioelechem.2023.108629. Epub 2023 Dec 21. Bioelectrochemistry. 2024. PMID: 38159429 Review.
Cited by
-
Characterization of Ablation Thresholds for 3D-Cultured Patient-Derived Glioma Stem Cells in Response to High-Frequency Irreversible Electroporation.Research (Wash D C). 2019 Apr 28;2019:8081315. doi: 10.34133/2019/8081315. eCollection 2019. Research (Wash D C). 2019. PMID: 31549086 Free PMC article.
-
Ablation outcome of irreversible electroporation on potato monitored by impedance spectrum under multi-electrode system.Biomed Eng Online. 2018 Sep 20;17(1):126. doi: 10.1186/s12938-018-0562-9. Biomed Eng Online. 2018. PMID: 30236121 Free PMC article.
-
Computer modelling and vegetable bench test of a bipolar electrode array intended for use in high frequency irreversible electroporation treatment of skin cancer.Biomed Eng Lett. 2024 Sep 12;15(1):69-79. doi: 10.1007/s13534-024-00421-z. eCollection 2025 Jan. Biomed Eng Lett. 2024. PMID: 39781046 Free PMC article.
-
Pulsed field ablation in medicine: irreversible electroporation and electropermeabilization theory and applications.Radiol Oncol. 2025 Feb 27;59(1):1-22. doi: 10.2478/raon-2025-0011. eCollection 2025 Mar 1. Radiol Oncol. 2025. PMID: 40014783 Free PMC article. Review.
-
Does the shape of the electric pulse matter in electroporation?Front Oncol. 2022 Sep 14;12:958128. doi: 10.3389/fonc.2022.958128. eCollection 2022. Front Oncol. 2022. PMID: 36185267 Free PMC article. Review.
References
-
- Neumann E, Rosenheck K. Permeability changes induced by electric impulses in vesicular membranes. The Journal of membrane biology. 1972;10(3):279–290. - PubMed
-
- Weaver JC. Electroporation theory. Concepts and mechanisms. Methods in molecular biology. 1995;55:3–28. - PubMed
-
- Mir LM, Glass LF, Sersa G, Teissie J, Domenge C, Miklavcic D, Jaroszeski MJ, Orlowski S, Reintgen DS, Rudolf Z. et al.Effective treatment of cutaneous and subcutaneous malignant tumours by electrochemotherapy. British journal of cancer. 1998;77(12):2336–2342. doi: 10.1038/bjc.1998.388. - DOI - PMC - PubMed
Publication types
MeSH terms
LinkOut - more resources
Full Text Sources
Other Literature Sources

