. 2015 Sep 10;10(9):e0137168.
doi: 10.1371/journal.pone.0137168. eCollection 2015.

Dynamic Analysis of Gene Expression in Rice Superior and Inferior Grains by RNA-Seq

Affiliations

Dynamic Analysis of Gene Expression in Rice Superior and Inferior Grains by RNA-Seq

Hongzheng Sun et al. PLoS One. .

Abstract

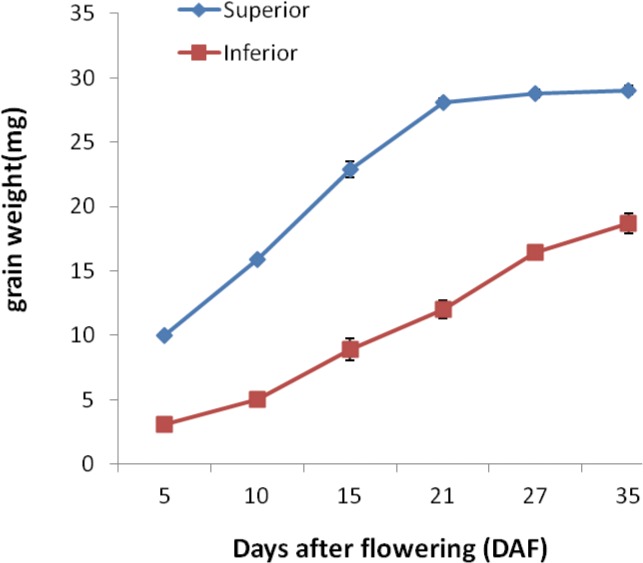
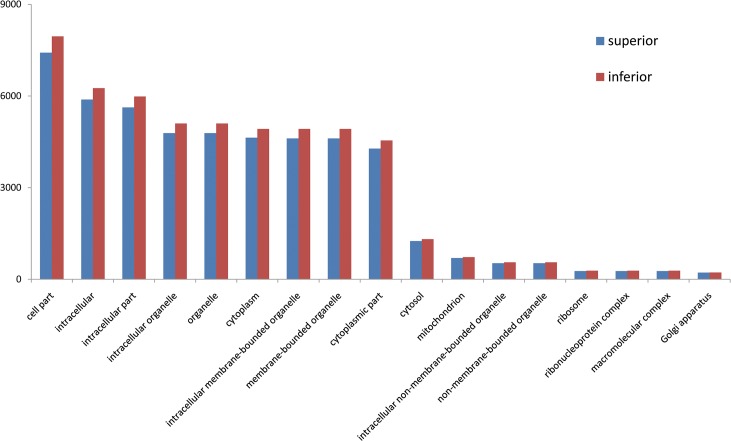
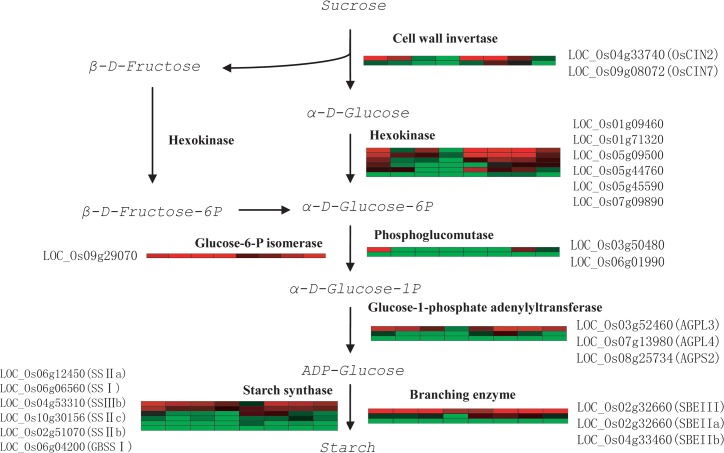
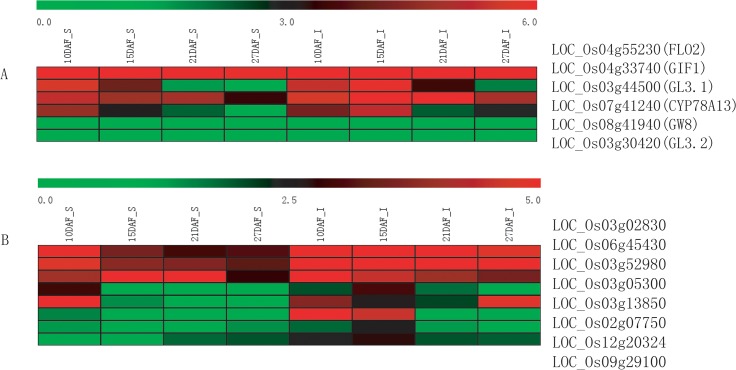
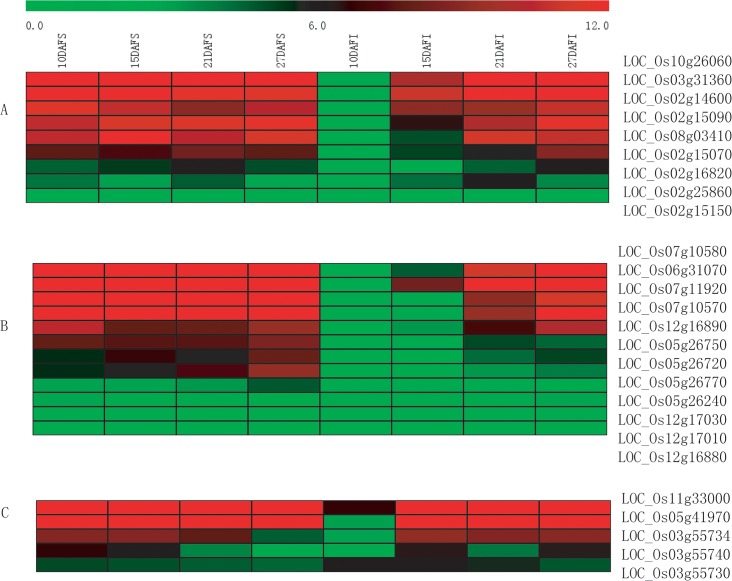
Poor grain filling of inferior grains located on lower secondary panicle branch causes great drop in rice yield and quality. Dynamic gene expression patterns between superior and inferior grains were examined from the view of the whole transcriptome by using RNA-Seq method. In total, 19,442 genes were detected during rice grain development. Genes involved in starch synthesis, grain storage and grain development were interrogated in particular in superior and inferior grains. Of the genes involved in sucrose to starch transformation process, most were expressed at lower level in inferior grains at early filling stage compared to that of superior grains. But at late filling stage, the expression of those genes was higher in inferior grains and lower in superior grains. The same trends were observed in the expression of grain storage protein genes. While, evidence that genes involved in cell cycle showed higher expression in inferior grains during whole period of grain filling indicated that cell proliferation was active till the late filling stage. In conclusion, delayed expression of most starch synthesis genes in inferior grains and low capacity of sink organ might be two important factors causing low filling rate of inferior grain at early filling stage, and shortage of carbohydrate supply was a limiting factor at late filling stage.


Conflict of interest statement

Competing Interests: The authors have declared that no competing interests exist.

Figures

Fig 1
Fig 1. Grain weight of superior and inferior grains on the rice panicle.
Grains were sampled at 5, 10, 15,21,27,35 days after fertilization, and the average dry weight of grains was measured.
Fig 2
Fig 2. Gene Ontology (GO) enrichment analysis.
The genes expressed in superior grains were taken as input list, and genes expressed in inferior grains were background list. All categories were classified according to their biological process, cellular component and molecular function. The blue bar indicates percentage of genes obtained in this study in each GO category, and the green bar indicates percentage of all annotated rice genes in each GO category.
Fig 3
Fig 3. Schematic illustration of sucrose to starch synthesis pathway.
Flow of substrates and products is indicated by arrows and enzymes catalyze the reaction are labeled beside arrows. Heat maps of the genes encoding the enzymes are placed beside the enzymes. Each grid indicates a sampled period. The first four grids indicate superior grains of 10DAF, 15DAF, 21DAF, 27DAF, and the last four grids indicate inferior grains of 10DAF, 15DAF, 21DAF, 27DAF. Expression of genes (in TPM) was subjected to log2 conversion. With those zero expression genes, zero was converted with 0.01(in TPM).
Fig 4
Fig 4. Heat map representation of grain size controlling and cell cycle related genes.
“A” indicates grain size controlling genes expression. “B” indicates cell cycle related genes expression. “DAF” indicates day after flowering. “S” indicates superior grains, and “I” indicates inferior grains. Expression of genes (in TPM) was subjected to log2 conversion. With those zero expression genes, zero was converted with 0.01(in TPM).
Fig 5
Fig 5. Heat map representation of seed storage protein genes expression.
“A” indicates glutelin genes, “B” indicates prolamin genes, and “C” indicates albumin genes. “DAF” indicates day after flowering. “S” indicates superior grains, and “I” indicates inferior grains. Expression of genes (in TPM) was subjected to log2 conversion. With those zero expression genes, zero was converted with 0.01(in TPM).

Similar articles

Cited by

References

    1. Wang E, Wang J, Zhu X, Hao W, Wang L, Li Q, et al. (2008) Control of rice grain-filling and yield by a gene with a potential signature of domestication. Nat Genet 40: 1370–1374. 10.1038/ng.220 - DOI - PubMed
    1. Ishimaru T, Hirose T, Matsuda T, Goto A, Takahashi K, Sasaki H, et al. (2005) Expression patterns of genes encoding carbohydrate-metabolizing enzymes and their relationship to grain filling in rice (Oryza sativa L.): comparison of caryopses located at different positions in a panicle. Plant Cell Physiol 46: 620–628. - PubMed
    1. Yang J, Zhang J, Wang Z, Liu K, Wang P (2006) Post-anthesis development of inferior and superior spikelets in rice in relation to abscisic acid and ethylene. J Exp Bot 57: 149–160. - PubMed
    1. Ishimaru T, Matsuda T, Ohsugi R, Yamagishi T (2003) Morphological development of rice caryopses located at the different positions in a panicle from early to middle stage of grain filling. Functional Plant Biology 30: 1139–1149. - PubMed
    1. Peng T, Lv Q, Zhang J, Li J, Du Y, Zhao Q (2011) Differential expression of the microRNAs in superior and inferior spikelets in rice (Oryza sativa). J Exp Bot 62: 4943–4954. 10.1093/jxb/err205 - DOI - PubMed

Publication types

LinkOut - more resources