

Model-Based Quantification of the Systemic Interplay between Glucose and Fatty Acids in the Postprandial State
- PMID: 26356502
- PMCID: PMC4565650
- DOI: 10.1371/journal.pone.0135665
Model-Based Quantification of the Systemic Interplay between Glucose and Fatty Acids in the Postprandial State
Abstract
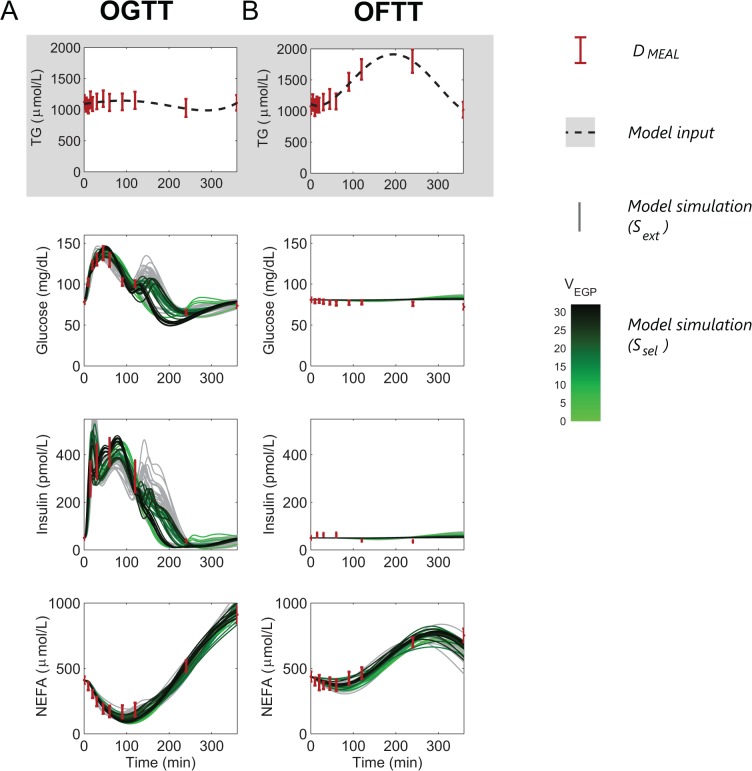
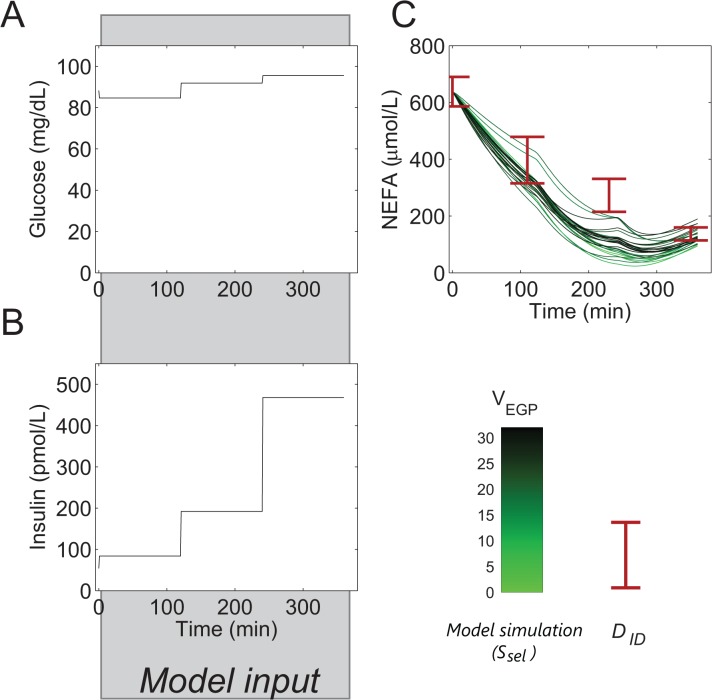
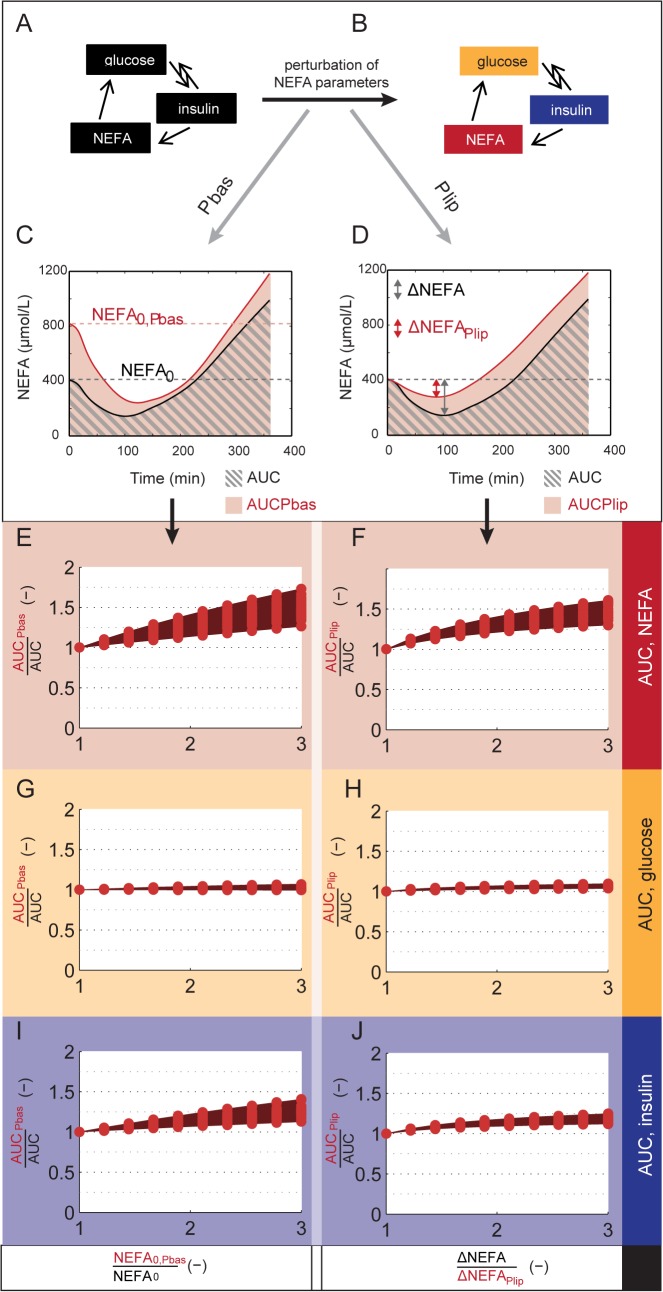
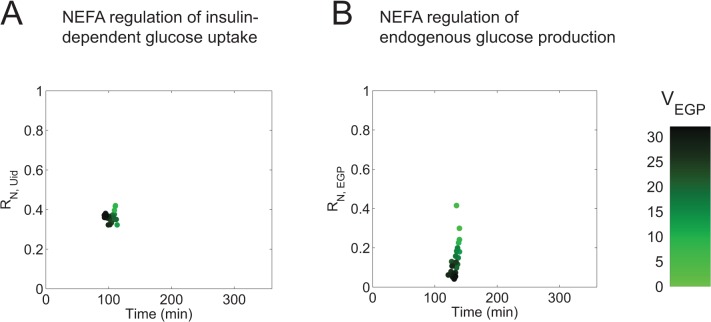
In metabolic diseases such as Type 2 Diabetes and Non-Alcoholic Fatty Liver Disease, the systemic regulation of postprandial metabolite concentrations is disturbed. To understand this dysregulation, a quantitative and temporal understanding of systemic postprandial metabolite handling is needed. Of particular interest is the intertwined regulation of glucose and non-esterified fatty acids (NEFA), due to the association between disturbed NEFA metabolism and insulin resistance. However, postprandial glucose metabolism is characterized by a dynamic interplay of simultaneously responding regulatory mechanisms, which have proven difficult to measure directly. Therefore, we propose a mathematical modelling approach to untangle the systemic interplay between glucose and NEFA in the postprandial period. The developed model integrates data of both the perturbation of glucose metabolism by NEFA as measured under clamp conditions, and postprandial time-series of glucose, insulin, and NEFA. The model can describe independent data not used for fitting, and perturbations of NEFA metabolism result in an increased insulin, but not glucose, response, demonstrating that glucose homeostasis is maintained. Finally, the model is used to show that NEFA may mediate up to 30-45% of the postprandial increase in insulin-dependent glucose uptake at two hours after a glucose meal. In conclusion, the presented model can quantify the systemic interactions of glucose and NEFA in the postprandial state, and may therefore provide a new method to evaluate the disturbance of this interplay in metabolic disease.
Conflict of interest statement
Figures
Similar articles
-
A computational model of postprandial adipose tissue lipid metabolism derived using human arteriovenous stable isotope tracer data.PLoS Comput Biol. 2019 Oct 3;15(10):e1007400. doi: 10.1371/journal.pcbi.1007400. eCollection 2019 Oct. PLoS Comput Biol. 2019. PMID: 31581241 Free PMC article.
-
A model of NEFA dynamics with focus on the postprandial state.Ann Biomed Eng. 2009 Sep;37(9):1897-909. doi: 10.1007/s10439-009-9738-6. Epub 2009 Jun 13. Ann Biomed Eng. 2009. PMID: 19526341
-
Normal postprandial nonesterified fatty acid uptake in muscles despite increased circulating fatty acids in type 2 diabetes.Diabetes. 2011 Feb;60(2):408-15. doi: 10.2337/db10-0997. Epub 2011 Jan 12. Diabetes. 2011. PMID: 21228312 Free PMC article.
-
Non-esterified fatty acid metabolism and postprandial lipaemia.Atherosclerosis. 1998 Dec;141 Suppl 1:S41-6. doi: 10.1016/s0021-9150(98)00216-0. Atherosclerosis. 1998. PMID: 9888641 Review.
-
Fatty acid metabolism in obesity and type 2 diabetes mellitus.Proc Nutr Soc. 2003 Aug;62(3):753-60. doi: 10.1079/PNS2003290. Proc Nutr Soc. 2003. PMID: 14692611 Review.
Cited by
-
An Updated Organ-Based Multi-Level Model for Glucose Homeostasis: Organ Distributions, Timing, and Impact of Blood Flow.Front Physiol. 2021 Jun 1;12:619254. doi: 10.3389/fphys.2021.619254. eCollection 2021. Front Physiol. 2021. PMID: 34140893 Free PMC article.
-
Mathematical modeling of white adipocyte exocytosis predicts adiponectin secretion and quantifies the rates of vesicle exo- and endocytosis.J Biol Chem. 2017 Dec 8;292(49):20032-20043. doi: 10.1074/jbc.M117.801225. Epub 2017 Sep 25. J Biol Chem. 2017. PMID: 28972187 Free PMC article.
-
A computational model of postprandial adipose tissue lipid metabolism derived using human arteriovenous stable isotope tracer data.PLoS Comput Biol. 2019 Oct 3;15(10):e1007400. doi: 10.1371/journal.pcbi.1007400. eCollection 2019 Oct. PLoS Comput Biol. 2019. PMID: 31581241 Free PMC article.
-
Model selection reveals selective regulation of blood amino acid and lipid metabolism by insulin in humans.iScience. 2024 May 16;27(6):109833. doi: 10.1016/j.isci.2024.109833. eCollection 2024 Jun 21. iScience. 2024. PMID: 39055606 Free PMC article.
-
Quantifying the contribution of triglycerides to metabolic resilience through the mixed meal model.iScience. 2022 Oct 3;25(11):105206. doi: 10.1016/j.isci.2022.105206. eCollection 2022 Nov 18. iScience. 2022. PMID: 36281448 Free PMC article.
References
-
- Johanson EH, Jansson P-A, Gustafson B, Lönn L, Smith U, Taskinen M-R, et al. Early alterations in the postprandial VLDL1 apoB-100 and apoB-48 metabolism in men with strong heredity for type 2 diabetes. J Intern Med. 2004;255: 273–279. - PubMed
-
- Cassader M, Gambino R, Musso G, Depetris N, Mecca F, Cavallo-Perin P, et al. Postprandial triglyceride-rich lipoprotein metabolism and insulin sensitivity in nonalcoholic steatohepatitis patients. Lipids. 2001;36: 1117–1124. - PubMed
-
- Kirkman MS, Shankar RR, Shankar S, Shen C, Brizendine E, Baron A, et al. Treating Postprandial Hyperglycemia Does Not Appear to Delay Progression of Early Type 2 Diabetes The Early Diabetes Intervention Program. Diabetes Care. 2006;29: 2095–2101. doi: 10.2337/dc06-0061 - DOI - PubMed
-
- Lefebvre P, Scheen A. The postprandial state and risk of cardiovascular disease. Diabet Med. 1998; S63–68. - PubMed
-
- Borén J, Taskinen M-R, Adiels M. Kinetic studies to investigate lipoprotein metabolism. J Intern Med. 2012;271: 166–173. doi: 10.1111/j.1365-2796.2011.02497.x - DOI - PubMed
Publication types
MeSH terms
Substances
LinkOut - more resources
Full Text Sources
Other Literature Sources
Molecular Biology Databases
