

Genome instability model of metastatic neuroblastoma tumorigenesis by a dictionary learning algorithm
- PMID: 26358114
- PMCID: PMC4566396
- DOI: 10.1186/s12920-015-0132-y
Genome instability model of metastatic neuroblastoma tumorigenesis by a dictionary learning algorithm
Abstract
Background: Metastatic neuroblastoma (NB) occurs in pediatric patients as stage 4S or stage 4 and it is characterized by heterogeneous clinical behavior associated with diverse genotypes. Tumors of stage 4 contain several structural copy number aberrations (CNAs) rarely found in stage 4S. To date, the NB tumorigenesis is not still elucidated, although it is evident that genomic instability plays a critical role in the genesis of the tumor. Here we propose a mathematical approach to decipher genomic data and we provide a new model of NB metastatic tumorigenesis.
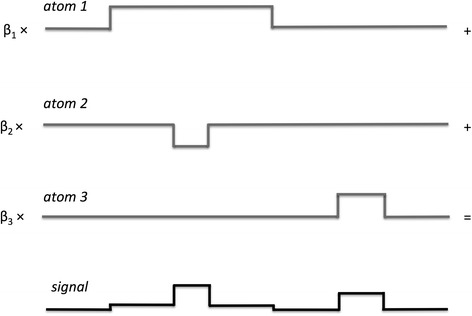
Method: We elucidate NB tumorigenesis using Enhanced Fused Lasso Latent Feature Model (E-FLLat) modeling the array comparative chromosome hybridization (aCGH) data of 190 metastatic NBs (63 stage 4S and 127 stage 4). This model for aCGH segmentation, based on the minimization of functional dictionary learning (DL), combines several penalties tailored to the specificities of aCGH data. In DL, the original signal is approximated by a linear weighted combination of atoms: the elements of the learned dictionary.
Results: The hierarchical structures for stage 4S shows at the first level of the oncogenetic tree several whole chromosome gains except to the unbalanced gains of 17q, 2p and 2q. Conversely, the high CNA complexity found in stage 4 tumors, requires two different trees. Both stage 4 oncogenetic trees are marked diverged, up to five sublevels and the 17q gain is the most common event at the first level (2/3 nodes). Moreover the 11q deletion, one of the major unfavorable marker of disease progression, occurs before 3p loss indicating that critical chromosome aberrations appear at early stages of tumorigenesis. Finally, we also observed a significant (p = 0.025) association between patient age and chromosome loss in stage 4 cases.
Conclusion: These results led us to propose a genome instability progressive model in which NB cells initiate with a DNA synthesis uncoupled from cell division, that leads to stage 4S tumors, primarily characterized by numerical aberrations, or stage 4 tumors with high levels of genome instability resulting in complex chromosome rearrangements associated with high tumor aggressiveness and rapid disease progression.
Figures


References
-
- Rubie H, De Bernardi B, Gerrard M, Canete A, Ladenstein R, Couturier J, Ambros P, Munzer C, Pearson AD, Garaventa A, et al. Excellent outcome with reduced treatment in infants with nonmetastatic and unresectable neuroblastoma without MYCN amplification: results of the prospective INES 99.1. J Clin Oncol. 2011;29:449–455. doi: 10.1200/JCO.2010.29.5196. - DOI - PubMed
-
- Haupt R, Garaventa A, Gambini C, Parodi S, Cangemi G, Casale F, Viscardi E, Bianchi M, Prete A, Jenkner A, et al. Improved survival of children with neuroblastoma between 1979 and 2005: a report of the Italian Neuroblastoma Registry. J Clin Oncol. 2010;28:2331–2338. doi: 10.1200/JCO.2009.24.8351. - DOI - PubMed
-
- Scaruffi P, Coco S, Cifuentes F, Albino D, Nair M, Defferrari R, Mazzocco K, Tonini GP. Identification and characterization of DNA imbalances in neuroblastoma by high-resolution oligonucleotide array comparative genomic hybridization. Cancer Genet Cytogenet. 2007;177:20–29. doi: 10.1016/j.cancergencyto.2007.05.002. - DOI - PubMed
-
- Oberthuer A, Berthold F, Warnat P, Hero B, Kahlert Y, Spitz R, Ernestus K, Konig R, Haas S, Eils R, et al. Customized oligonucleotide microarray gene expression-based classification of neuroblastoma patients outperforms current clinical risk stratification. J Clin Oncol. 2006;24:5070–5078. doi: 10.1200/JCO.2006.06.1879. - DOI - PubMed
-
- Schleiermacher G, Mosseri V, London WB, Maris JM, Brodeur GM, Attiyeh E, Haber M, Khan J, Nakagawara A, Speleman F, et al. Segmental chromosomal alterations have prognostic impact in neuroblastoma: a report from the INRG project. Br J Cancer. 2012;107:1418–1422. doi: 10.1038/bjc.2012.375. - DOI - PMC - PubMed
MeSH terms
LinkOut - more resources
Full Text Sources
Other Literature Sources
Medical
Research Materials
Miscellaneous
