. 2016 Jan;209(2):705-20.
doi: 10.1111/nph.13630. Epub 2015 Sep 11.

Cytokinin-induced promotion of root meristem size in the fern Azolla supports a shoot-like origin of euphyllophyte roots

Affiliations

Cytokinin-induced promotion of root meristem size in the fern Azolla supports a shoot-like origin of euphyllophyte roots

Jan de Vries et al. New Phytol. 2016 Jan.

Abstract

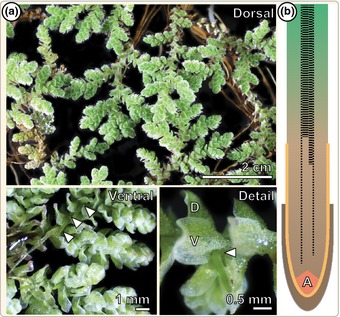
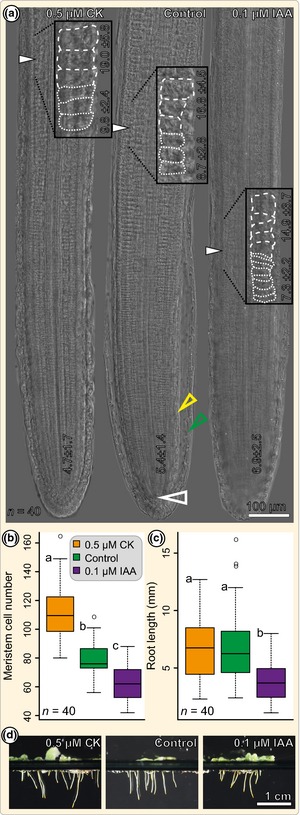
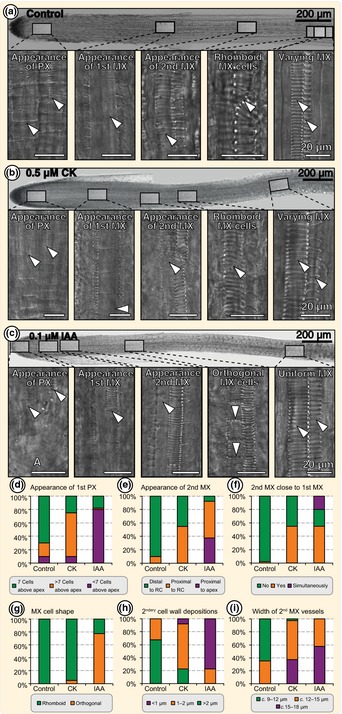
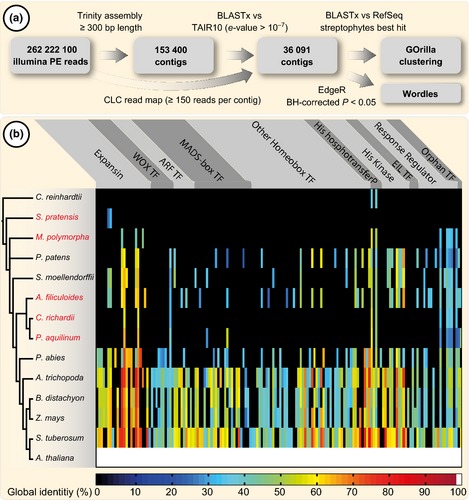
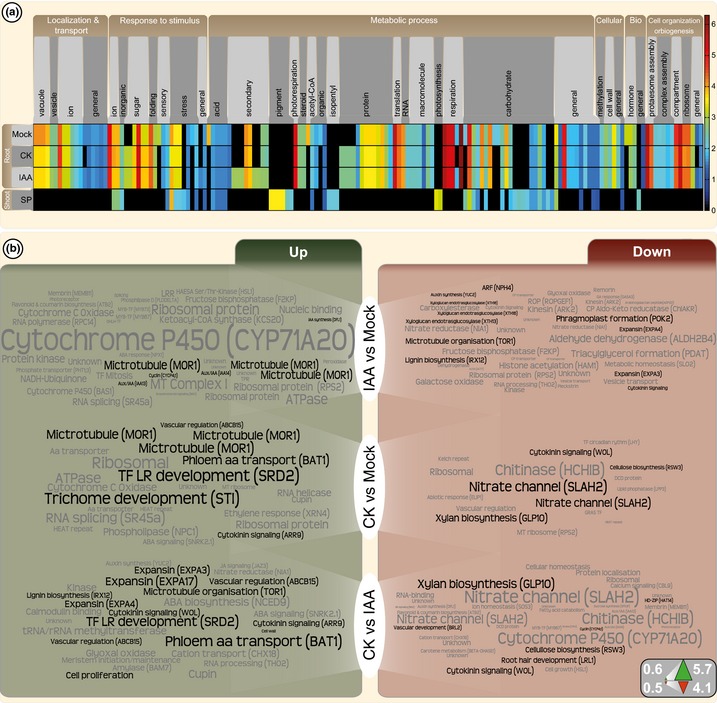
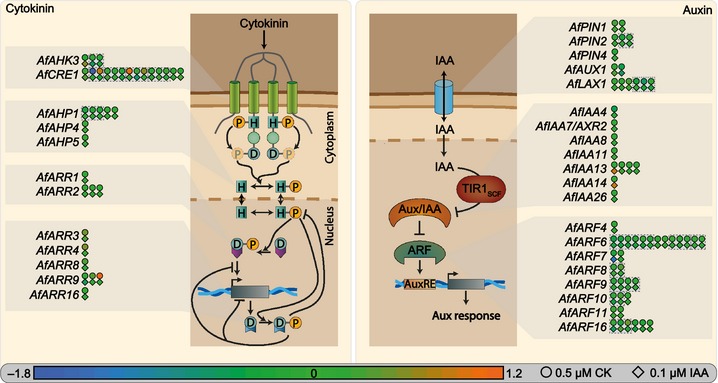
The phytohormones cytokinin and auxin orchestrate the root meristem development in angiosperms by determining embryonic bipolarity. Ferns, having the most basal euphyllophyte root, form neither bipolar embryos nor permanent embryonic primary roots but rather an adventitious root system. This raises the questions of how auxin and cytokinin govern fern root system architecture and whether this can tell us something about the origin of that root. Using Azolla filiculoides, we characterized the influence of IAA and zeatin on adventitious fern root meristems and vasculature by Nomarski microscopy. Simultaneously, RNAseq analyses, yielding 36,091 contigs, were used to uncover how the phytohormones affect root tip gene expression. We show that auxin restricts Azolla root meristem development, while cytokinin promotes it; it is the opposite effect of what is observed in Arabidopsis. Global gene expression profiling uncovered 145 genes significantly regulated by cytokinin or auxin, including cell wall modulators, cell division regulators and lateral root formation coordinators. Our data illuminate both evolution and development of fern roots. Promotion of meristem size through cytokinin supports the idea that root meristems of euphyllophytes evolved from shoot meristems. The foundation of these roots was laid in a postembryonically branching shoot system.

Keywords: RNAseq; apical development; auxin; cytokinin; fern; meristem regulation; root development; root evolution.


Figures

Figure 1
Figure 1
Emergence of shoot‐borne Azolla filiculoides roots. (a) Stereoscopic micrographs of Azolla filiculoides sporophytes in floating culture, showing a dorsal (upper panel), ventral (lower left panel) and detailed view (lower right panel). Arrows mark the shoot‐borne, adventitious emergence of roots. The detailed view shows the nodes containing a dorsal (D) and a ventral (V) leaf lobe. (b) Schematic drawing of the Azolla root that highlights the outer root cap (brown), the inner root cap (yellow), the apical cell (A), and differentiation of the xylem strands in dashed lines (outer thin lines represent protoxylem, and inner thick lines represent metaxylem).
Figure 2
Figure 2
Azolla root meristem cell number is elevated upon cytokinin and decreased upon auxin treatment. (a) Nomarski interference contrast micrographs of Azolla filiculoides roots treated with solvent (control), 0.5 μM trans‐zeatin (CK) and 0.1 μM IAA. Open arrows mark the root apical cell (RAC) and closed arrows mark the end of the outer cortex meristematic zone (MZ). Inserts show an enlarged view of the outer cortex transition zone (TZ), marking the end of the MZ and giving the average length of the last three cells of the MZ and the first three cells of the elongation zone (EZ) in µm (± SD; cells are retraced by dashed lines). Numbers at the apex give the average length of the first 10 outer cortex cells in μm (± SD). The green arrowhead marks the outer root cap, the yellow arrowhead marks the inner root cap. (b) Quantification of the outer cortex MZ cell number in mock (control)‐, 0.5 μM CK‐ and 0.1 μM IAA‐treated 3 d post‐cut (dpc) roots; significance groups a–c (< 0.001) were determined using Mann‐Whitney U‐statistics. (c) Quantification of the root length in mock (control)‐, 0.5 μM CK‐ and 0.1 μM IAA‐treated 3 dpc roots; significance groups a and b (< 0.001) were determined using Mann–Whitney U‐statistics. Box‐plots in (b) and (c) display the interquartile range (IQR; 50 ± 25%) of the data; horizontal lines in each box mark the median (50%), whiskers extend to the furthest data points within the 1.5 × IQR range, and circles mark outliers. (d) Photographs of 3 dpc A. filiculoides sporophytes in floating culture upon mock (control), 0.5 μM CK and 0.1 μM IAA treatment. All presented data points are derived from evaluation of at least 40 roots per treatment (n = 40).
Figure 3
Figure 3
Azolla root xylem development upon cytokinin and auxin treatments. (a–c) Nomarski interference contrast micrographs of Azolla filiculoides roots treated with solvent (control), 0.5 μM trans‐zeatin (CK) and 0.1 μM IAA; blow‐ups of marked positions along the root show details of the xylem phenotypes, marked with arrowheads. A, root apical cell; PX, protoxylem; MX, metaxylem. (d–i) Quantification of observed alterations in the xylem phenotype after control, 0.5 μM CK and 0.1 μM IAA treatment. Data points are derived from evaluation of at least 40 roots per experiment (n = 40). Root cap (RC).
Figure 4
Figure 4
RNAseq of Azolla root tips and identification of orthologues to known developmental regulators across 14 species of Chloroplastida. (a) Workflow of the RNAseq analysis of Azolla filiculoides root tips starting with the filtered reads obtained by illumina paired‐end (PE) sequencing followed by assembly using the Trinity pipeline, annotation and filtering via BLASTx and read mapping using the CLC workbench. For downstream analyses (protein clustering, expression wordles of significantly regulated genes or gene ontology (GO) term enrichment via GO rilla), only contigs that had their best BLASTx hit to streptophytes were used. (b) Protein data were extracted from nine genomes (black species names) and five RNAseq and expressed sequence tag (EST) libraries (red species names), and clustered; Chlamydomonas reinhardtii serves as an outgroup. Clusters were generated from all‐against‐all bidirectional best BLASTp hits. Those clusters were screened for 353 Arabidopsis thaliana proteins from 10 gene families (top row) and 161 clusters that contained at least one other species were extracted. The global identity of the identified homologues is displayed as a gradient colour. Note the high number of identified homologues in the A. filiculoides root tip transcriptome. The phylogeny on the left is based on the National Center for Biotechnology Information taxonomy database.
Figure 5
Figure 5
Gene expression changes in the Azolla root tip after auxin and cytokinin treatments. (a) Gene ontology (GO) enrichment analysis (< 10−3) based on the Arabidopsis annotation (e‐value < 10−7) of the top 2000 expressed genes in 3 d post‐cut (dpc) roots 6 h after treatment with solvent (mock), 0.1 μM IAA and 0.5 μM trans‐zeatin (CK) and in the shoots. The fold enrichment of the GO terms is depicted as a colour gradient and GO terms were manually sorted into umbrella categories (top). (b) Significantly differentially regulated (< 0.05) homologues (e‐value < 10−7) to Arabidopsis expressed in 0.3 mm of the root tip of Azolla filiculoides, represented as a word cloud. The bigger the word, the stronger the differential regulation comparing 0.1 μM IAA with mock (IAA vs mock), 0.5 μM CK with mock, and 0.5 μM CK with 0.1 μM IAA treatment. Words in black are of special interest with regard to the main text. Homologues are annotated based on A. thaliana; if applicable, the A. thaliana gene symbol is provided in brackets. Up‐regulated homologues are shown on the left, down‐regulated homologues on the right. Word sizes are based on log2(fold change); see the key in the right corner. For all individual values, see Supporting Information Table S6.
Figure 6
Figure 6
Comparison of Azolla filiculoides and Arabidopsis thaliana expansin expression patterns in relation to their relatedness. (a) Relative expression of the expansin gene family after trans‐zeatin (CK) vs mock treatment (left column) and IAA vs mock treatment (right column) in A. thaliana seedlings and A. filiculoides roots (in red letters) was clustered hierarchically using Euclidean distance measures and single linkage. Expansin expression is shown in red for up und blue for down and was calculated as log2(fold change). Both species‐specific and mixed clusters were obtained, but clusters rarely formed among evolutionarily related expansins. To confirm this relatedness of expansins to each other, a substitution rate per site, estimated with JTT + G + I with five discrete gamma categories (pairwise differences), was correlated to the absolute value of difference in expression between each two expansin genes (Δexpression). (b) No correlation between the pairwise differences and the absolute value of expression differences was observed in any tested phylogenetic category (purple and yellow, paralogues; blue, orthologues; red, co‐orthologues) under CK vs mock treatment. Under IAA vs mock treatment, only a negative correlation for orthologous expansin genes was observed, indicating that, sequence‐wise, highly similar orthologous genes are used differently in ferns and dicots.
Figure 7
Figure 7
Cytokinin and auxin trigger specific components of their signalling pathways in the Azolla root tip. The figure shows the number of detected Arabidopsis thaliana cytokinin (left) and auxin (right) signalling pathway components expressed in 0.3 mm root tips of A. filiculoides, based on homology (e‐value < 10−7). Differential expression of each contig is represented by a circle (response to 0.5 μM trans‐zeatin, CK) and a rectangle (response to 0.1 μM IAA) which are coloured in a gradient that labels log2(fold change) from orange (1.2) to green (0) to blue (−1.8). Although many homologues for the canonical auxin signalling pathway were detected, no homologue of the SCFTIR 1 complex could be identified. Grey boxes with dotted lines encase potential isoforms. For all individual values, see Supporting Information Table S6. Aux, auxin.

References

    1. Aida M, Beis D, Heidstra R, Willemsen V, Blilou I, Galinha C, Nussaume L, Noh Y‐S, Amasino R, Scheres B. 2004. The PLETHORA genes mediate patterning of the Arabidopsis root stem cell niche. Cell 119: 109–120. - PubMed
    1. Altschul SF, Madden TL, Schaffer AA, Zhang JH, Zhang Z, Miller W, Lipman DJ. 1997. Gapped BLAST and PSI‐BLAST: a new generation of protein database search programs. Nucleic Acids Research 25: 3389–3402. - PMC - PubMed
    1. Amborella Genome Project . 2013. The Amborella genome and the evolution of flowering plants. Science 342: 1241089. - PubMed
    1. Banks JA. 1999. Gametophyte development in ferns. Annual Review of Plant Physiology and Plant Molecular Biology 50: 163–186. - PubMed
    1. Banks JA, Nishiyama T, Hasebe M, Bowman JL, Girbskov M, de Pamphilis C, Albert VA, Aono N, Aoyaama T, Ambrose BA et al 2011. The Selaginella genome identifies genetic changes associated with the evolution of vascular plants. Science 332: 960–963. - PMC - PubMed

Publication types

MeSH terms

LinkOut - more resources