

Unchained melody: revisiting the estimation of SF-6D values
- PMID: 26359242
- PMCID: PMC4786460
- DOI: 10.1007/s10198-015-0727-4
Unchained melody: revisiting the estimation of SF-6D values
Abstract
Purpose: In the original SF-6D valuation study, the analytical design inherited conventions that detrimentally affected its ability to predict values on a quality-adjusted life year (QALY) scale. Our objective is to estimate UK values for SF-6D states using the original data and multi-attribute utility (MAU) regression after addressing its limitations and to compare the revised SF-6D and EQ-5D value predictions.
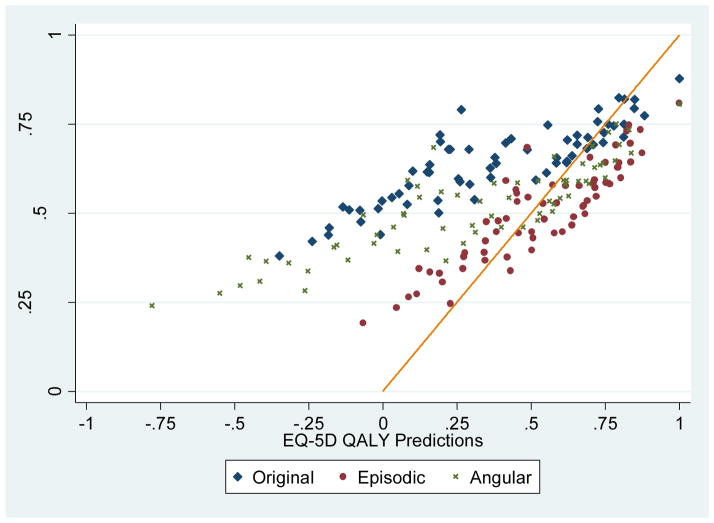
Methods: Using the unaltered data (611 respondents, 3503 SG responses), the parameters of the original MAU model were re-estimated under three alternative error specifications, known as the instant, episodic, and angular random utility models. Value predictions on a QALY scale were compared to EQ-5D3L predictions using the 1996 Health Survey for England.
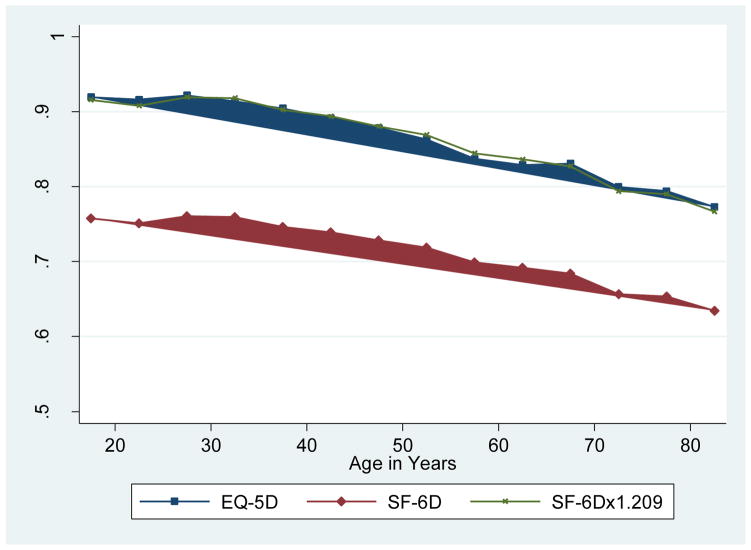
Results: Contrary to the original results, the revised SF-6D value predictions range below 0 QALYs (i.e., worse than death) and agree largely with EQ-5D predictions after adjusting for scale. Although a QALY is defined as a year in optimal health, the SF-6D sets a higher standard for optimal health than the EQ-5D-3L; therefore, it has larger units on a QALY scale by construction (20.9 % more).
Conclusions: Much of the debate in health valuation has focused on differences between preference elicitation tasks, sampling, and instruments. After correcting errant econometric practices and adjusting for differences in QALY scale between the EQ-5D and SF-6D values, the revised predictions demonstrate convergent validity, making them more suitable for UK economic evaluations compared to original estimates.
Keywords: EQ-5D; Quality of life; SF-6D; Time trade-off; UK.
Conflict of interest statement
The author has no potential conflicts of interest.
Figures
References
-
- Brazier J, Usherwood T, Harper R, KT Deriving a prference-based single index from the UK SF-36 health survey. Journal of Clinical Epidemiology. 1998;51:1115–1128. - PubMed
-
- EuroQol Group. [Accessed Oct 07 2014];EQ-5D products: EQ-5D-5L. http://www.euroqol.org/eq-5d/eq-5d-products.html.
-
- Torrance GW. Social Preferences for Health States: An Empirical Evaluation of Three Measurement Techniques. Socio-Economic Planning Sciences. 1976;10:129–136.
-
- Tsuchiya A, Ikeda S, Ikegami N, Nishimura S, Sakai I, Fukuda T, Hamashima C, Hisashige A, Tamura M. Estimating an EQ-5D population value set: the case of Japan. Health Econ. 2002;11(4):341–353. - PubMed
MeSH terms
Grants and funding
LinkOut - more resources
Full Text Sources
Other Literature Sources
