. 2015 Oct 30;290(44):26610-26.
doi: 10.1074/jbc.M115.657973. Epub 2015 Sep 10.

Structural insights into cargo recognition by the yeast PTS1 receptor

Affiliations

Structural insights into cargo recognition by the yeast PTS1 receptor

Stefanie Hagen et al. J Biol Chem. .

Abstract

The peroxisomal matrix protein import is facilitated by cycling import receptors that shuttle between the cytosol and the peroxisomal membrane. The import receptor Pex5p mediates the import of proteins harboring a peroxisomal targeting signal of type I (PTS1). Purified recombinant Pex5p forms a dimeric complex with the PTS1-protein Pcs60p in vitro with a KD of 0.19 μm. To analyze the structural basis for receptor-cargo recognition, the PTS1 and adjacent amino acids of Pcs60p were systematically scanned for Pex5p binding by an in vitro site-directed photo-cross-linking approach. The cross-linked binding regions of the receptor were subsequently identified by high resolution mass spectrometry. Most cross-links were found with TPR6, TPR7, as well as the 7C-loop of Pex5p. Surface plasmon resonance analysis revealed a bivalent interaction mode for Pex5p and Pcs60p. Interestingly, Pcs60p lacking its C-terminal tripeptide sequence was efficiently cross-linked to the same regions of Pex5p. The KD value of the interaction of truncated Pcs60p and Pex5p was in the range of 7.7 μm. Isothermal titration calorimetry and surface plasmon resonance measurements revealed a monovalent binding mode for the interaction of Pex5p and Pcs60p lacking the PTS1. Our data indicate that Pcs60p contains a second contact site for its receptor Pex5p, beyond the C-terminal tripeptide. The physiological relevance of the ancillary binding region was supported by in vivo import studies. The bivalent binding mode might be explained by a two-step concept as follows: first, cargo recognition and initial tethering by the PTS1-receptor Pex5p; second, lock-in of receptor and cargo.

Keywords: mass spectrometry (MS); peroxisome; protein cross-linking; protein targeting; protein translocation; protein-protein interaction; yeast.


Figures

FIGURE 1.
FIGURE 1.
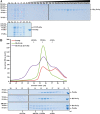
Formation of a recombinant His6-Pex5p·Pcs60p complex. A, profile of the purification of recombinant His6-Pex5p (upper panel) and GST-Pcs60p (lower panel) by affinity chromatography. The protein profiles shown are from equal portions of cells prior to induction (T0) and isopropyl 1-thio-β-d-galactopyranoside-induced (T4) cells. Samples of the homogenate (H), the sediment (P), and the supernatant (S) after differential centrifugation, wash fraction (W), and obtained fractions after elution of bound proteins from the nickel-NTA-agarose or GSH-agarose column with increasing imidazole concentrations (E1–E21 as for His6-Pex5p) or cleavage with thrombin (E for Pcs60p) were subjected to SDS-PAGE and stained with Coomassie Blue. In comparison with the starting material, loaded eluates of His6-Pex5p and Pcs60p were concentrated 70- or 50-fold, respectively. B, size exclusion chromatography of recombinant His6-Pex5p·Pcs60p complex. Shown are the absorption profiles obtained by the Unicorn software (GE Healthcare) and Coomassie-stained gels. As indicated, recombinant Pcs60p, His6-Pex5p, or pre-formed complex of both were subjected to size exclusion chromatography (Superose 6 10/300 GL). Fractions were collected and analyzed by SDS-PAGE and Coomassie staining. His6-Pex5p peaked at a size of ∼160 kDa and Pcs60p at 160 and 40 kDa, indicating that it forms an oligomer and a monomer. Combined and pre-incubated proteins form a complex that peaked at a size of ∼440 kDa with a 1:1 ratio of Pcs60p and Pex5p. Molecular mass markers are indicated.
FIGURE 2.
FIGURE 2.
Pcs60p variants for cross-linking studies. Schematic of wild-type Pcs60p and coding sequence with focus on the C-terminal PTS1-comprising region. The Pcs60p variants used in this study are shown with their 3′-coding region (base pairs) and the deduced amino acid sequence (amino acids). Introduced TAG amber codons, which allow pBpa incorporation, are underlined. Asterisks indicate pBpa position at the protein level.
FIGURE 3.
FIGURE 3.
In vitro photo-cross-linking of Pcs60p and His6-Pex5p as well as His6-Pex5p-M536A. A, purified recombinant variants of Pcs60p were subjected to UV irradiation in the absence (left panel) or presence (right panel) of purified equimolar amounts of His6-Pex5p. Samples were taken prior to (0 min) and 60 min after UV treatment and subjected to SDS-PAGE. Proteins were visualized by Coomassie staining. Pex5p/Pcs60p cross-linking products are indicated (pc complex). B, verification of the obtained cross-linking bands by immunoblot analysis using specific antisera against Pex5p and Pcs60p. C, purified recombinant His6-Pex5p-M536A was subjected to UV irradiation in the absence (left panel) or presence (right panel) of purified equimolar amounts of Pcs60p variants. Samples were taken prior to (0 min) and 60 min after UV irradiation and subjected to SDS-PAGE. Proteins were visualized by Coomassie staining. Pex5p-M536A/Pcs60p cross-linking products are indicated (pc complex).
FIGURE 4.
FIGURE 4.
Identification of the main photo-cross-linking target site in Pex5p by high resolution mass spectrometry. A, MS (upper left panel) and MS/MS spectrum (lower panel) of a photo-cross-linked peptide pair formed between the Pcs60p variant Asn-539 and Pex5p. Fragment ions (y- and b-ions, yo and bo indicate neutral loss of H2O) generated by collision-induced dissociation confirm the sequences of the cross-linked peptide pair (upper right panel). B, identification of the target site in the main Pex5p peptide to which the photo-activated pBpa was bound. The calculated p value of the peptide spectrum match is shown as a function of the residue identified to be cross-linked. Data are shown for Pcs60p-variant Ser-537 (green diamonds), Arg-538 (light blue squares), Asn-539 (dark blue triangles up), N539ΔSKL (pink triangles down), as well as Ser-541 (red circles).
FIGURE 5.
FIGURE 5.
Illustration of Pex5p/Pcs60p interlinks. A, schematic representation of the domain structure of yeast Pex5p. The C-terminal half of the PTS1 receptor harbors two TPR triplets, TPR-D1 and TPD-D2, that are composed of TPR1–3 and -5–7, respectively, and linked by TPR4. The extreme C terminus harbors the 7C-loop, a rather shortened and incomplete TPR domain. B, mass spectrometry-based identification of Pex5p peptides linked to Pcs60p variants are indicated. Numbers display the peptide range, and underlined characters identified target residues.
FIGURE 6.
FIGURE 6.
Model of ScPex5p interacting with its PTS1 cargo protein Pcs60p. A, model of ScPex5p(301–612). The regions of the three Pex5p peptides identified in cross-linking experiments (cf. Fig. 5) are highlighted in violet, blue, and cyan. B, homology model of the C-terminal part of Pcs60p bound to Pex5p. Pcs60p contact residue sites (underlined in A) on the three Pex5p peptides are highlighted in red. For methionine on position 536, the side chain is also shown. Pcs60p residues that were positive in the in vitro photo-cross-linking experiments are highlighted in orange and labeled. Asn-539 from Pcs60p, which provided the strongest interaction signal, is colored in cyan. The remaining Pcs60p residues shown are in green.
FIGURE 7.
FIGURE 7.
ITC analysis of Pex5p interacting with wild-type Pcs60p (A) and Pcs60pΔSKL (B). ITC measurements were conducted in a buffer containing 50 mm HEPES, 300 mm NaCl at 25 °C on a MicroCal VP-ITC with 41–42 μm full-length Pex5p as a sample and 340–400 μm wild-type Pcs60p and 20–30 μm full-length Pex5p and 300–622 μm Pcs60pΔSKL, respectively. The upper panels represent the thermogram showing the amount of heat released after each injection of a volume of 10 μl. The lower panels represent the heat of reaction per injection as a function of the cargo/Pex5p ratio.
FIGURE 8.
FIGURE 8.
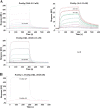
Analysis of the binding mode of His6-Pex5p and Pcs60p and the importance of the signal sequence of Pcs60p by SPR spectroscopy. His-tagged Pex5p was covalently immobilized on NTA sensor chips, and purified Pcs60p and Pcs60pΔSKL were applied as analyte in solution (serial 2-fold dilutions from 2048 to 0.13 nm, respectively). Sensorgrams are shown for Pex5p interacting with Pcs60p and Pcs60pΔSKL (A), and Pcs60p and Pcs60pΔ8 (B) at equal concentrations (2048 nm). The obtained binding curves were evaluated using BIAevaluation software 4.1.1.
FIGURE 9.
FIGURE 9.
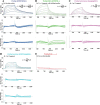
Surface plasmon resonance spectroscopy analysis of the binding properties of interaction between His6-Pex5p and wild-type Pcs60p, Pcs60pΔSKL, Pcs60p substitution, Pcs60p insertion, and Pcs60pΔ8. 0.005 mg/ml His-tagged Pex5p was immobilized on the surface of a CM5 sensor chip and varying concentrations of purified Pcs60p, Pcs60pΔSKL, Pcs60p substitution, Pcs60p insertion, as well as Pcs60pΔ8 were applied. The used concentrations of the analyte were as follows: 0, 1, 2, 3, 5, 7, 9, and 10 nm for wild-type, and 0, 10, 20, 30, 50, 70, 90, and 100 for the Pcs60p variants. Binding curves are shown for Pex5p interacting with Pcs60p (A), Pcs60pΔSKL (B), Pcs60p substitution (C), Pcs60p insertion (D), and Pcs60pΔ8 (E). Obtained binding curves were evaluated by using BIAevaluation software 3.1 (upper panel; GE Healthcare). In each case, the best fit is shown, in color are the binding curves and in black is the fit. Middle (1 to 1 Langmuir) and lower (bivalent analyte) panels show the residual plots of the best fits, indicating the closeness of the fit to the data obtained.
FIGURE 10.
FIGURE 10.
Analysis of peroxisomal import of Pcs60p variants by cell fractionation and protease protection assay. Plasmids coding for indicated Pcs60p variants were expressed in Δpcs60 cells. Wild-type cells and Δpcs60 transformed with wild-type Pcs60p served as controls. A, test for peroxisomal targeting of Pcs60p variants by differential centrifugation. Cytosolic proteins in the supernatant and proteins associated with the organellar sediments were analyzed by immunoblotting. Mitochondrial porin and cytosolic fructose-1,6-bisphosphatase (Fbp1p) served as controls for proper separation. T, total; S, supernatant; P, pellet. B, analysis of peroxisomal import of Pcs60p variants by protease protection assay. Postnuclear supernatants of indicated yeast strains were incubated with proteinase K in the absence or presence of Triton X-100, and samples were analyzed at indicated time points by immunoblotting.

References

    1. Hasan S., Platta H. W., and Erdmann R. (2013) Import of proteins into the peroxisomal matrix. Front. Physiol. 4, 261. - PMC - PubMed
    1. Theodoulou F. L., Bernhardt K., Linka N., and Baker A. (2013) Peroxisome membrane proteins: multiple trafficking routes and multiple functions? Biochem. J. 451, 345–352 - PubMed
    1. Lazarow P. B., and Fujiki Y. (1985) Biogenesis of peroxisomes. Annu. Rev. Cell Biol. 1, 489–530 - PubMed
    1. Walton P. A., Hill P. E., and Subramani S. (1995) Import of stably folded proteins into peroxisomes. Mol. Biol. Cell 6, 675–683 - PMC - PubMed
    1. Meinecke M., Cizmowski C., Schliebs W., Krüger V., Beck S., Wagner R., and Erdmann R. (2010) The peroxisomal importomer constitutes a large and highly dynamic pore. Nat. Cell Biol. 12, 273–277 - PubMed

Publication types

MeSH terms

Substances

Associated data