. 2015 Sep 10;162(6):1242-56.
doi: 10.1016/j.cell.2015.08.052.

Melanoma Cell-Intrinsic PD-1 Receptor Functions Promote Tumor Growth

Affiliations

Melanoma Cell-Intrinsic PD-1 Receptor Functions Promote Tumor Growth

Sonja Kleffel et al. Cell. .

Abstract

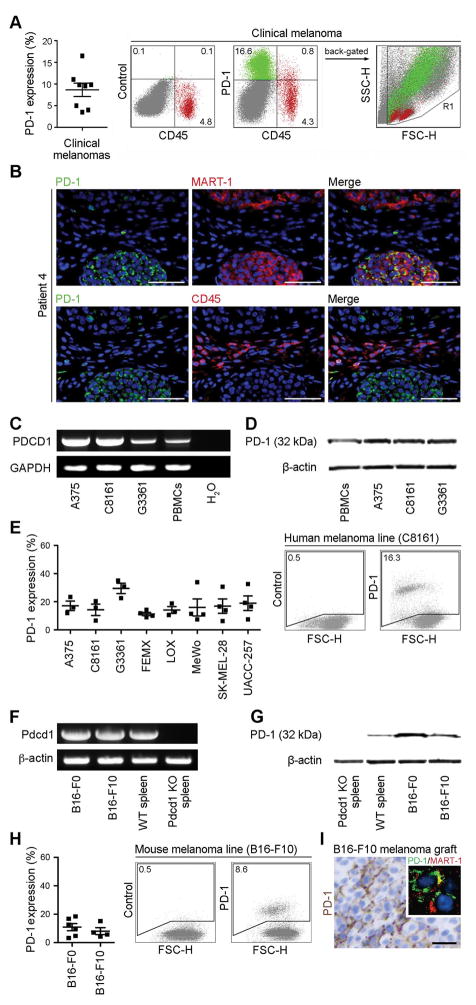
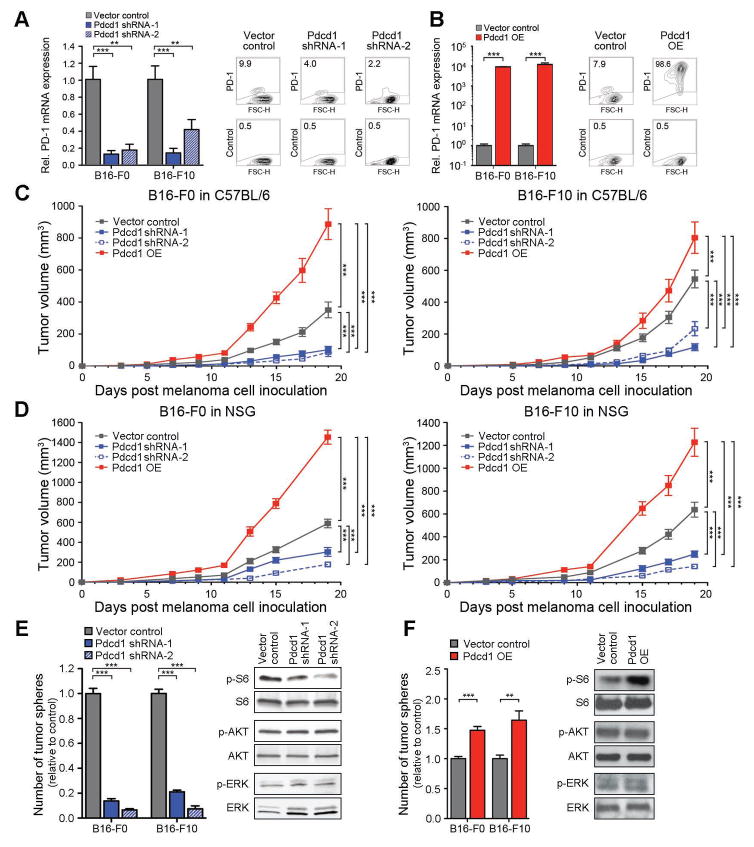
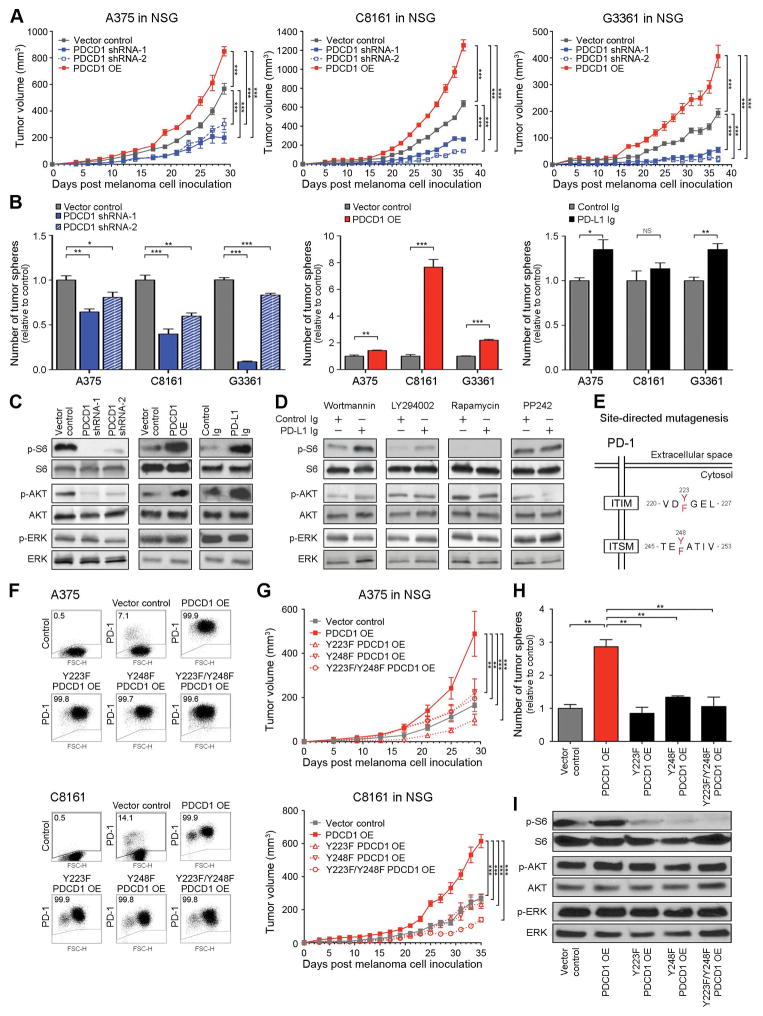
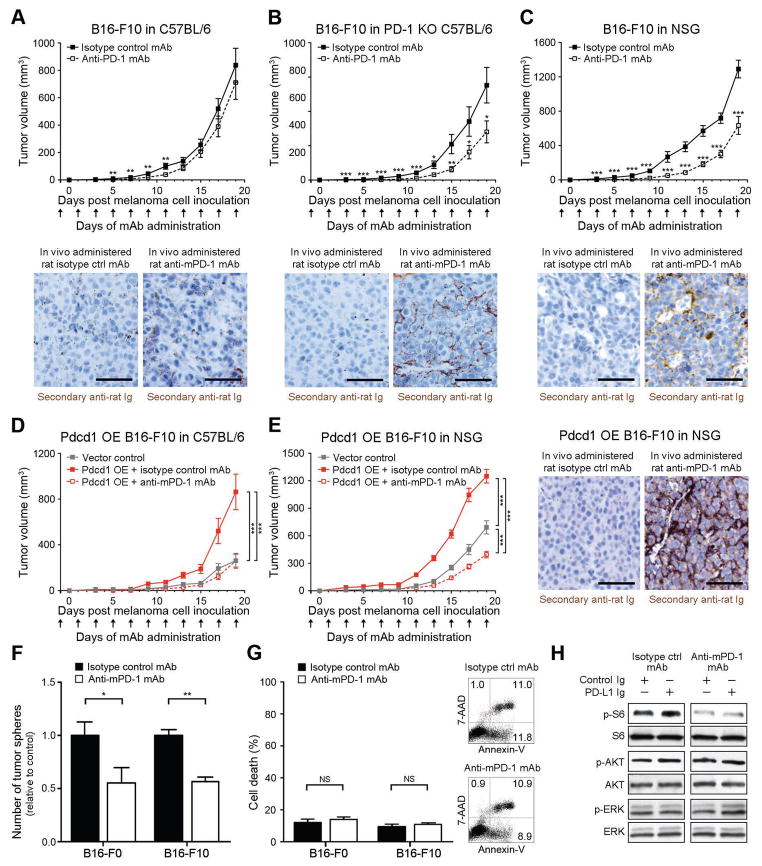
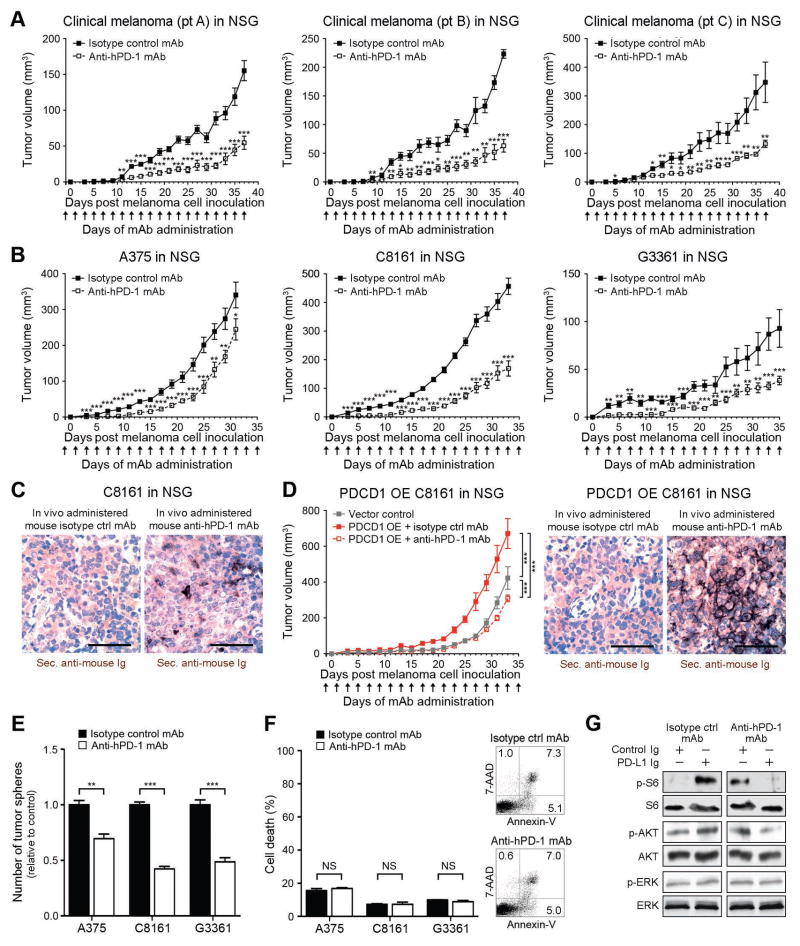
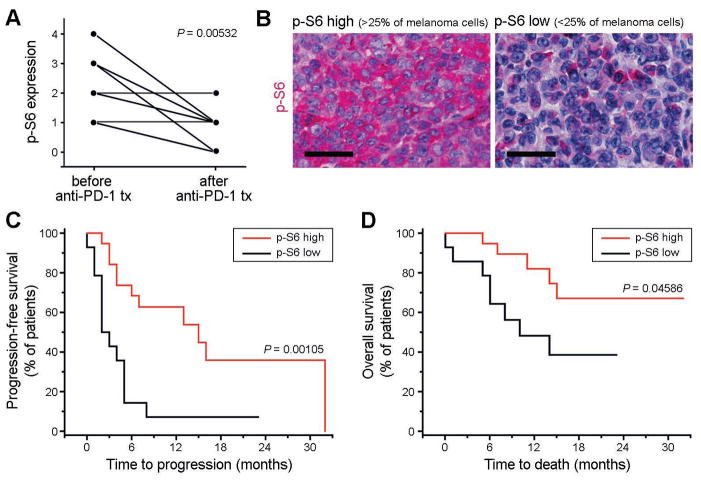
Therapeutic antibodies targeting programmed cell death 1 (PD-1) activate tumor-specific immunity and have shown remarkable efficacy in the treatment of melanoma. Yet, little is known about tumor cell-intrinsic PD-1 pathway effects. Here, we show that murine and human melanomas contain PD-1-expressing cancer subpopulations and demonstrate that melanoma cell-intrinsic PD-1 promotes tumorigenesis, even in mice lacking adaptive immunity. PD-1 inhibition on melanoma cells by RNAi, blocking antibodies, or mutagenesis of melanoma-PD-1 signaling motifs suppresses tumor growth in immunocompetent, immunocompromised, and PD-1-deficient tumor graft recipient mice. Conversely, melanoma-specific PD-1 overexpression enhances tumorigenicity, as does engagement of melanoma-PD-1 by its ligand, PD-L1, whereas melanoma-PD-L1 inhibition or knockout of host-PD-L1 attenuate growth of PD-1-positive melanomas. Mechanistically, the melanoma-PD-1 receptor modulates downstream effectors of mTOR signaling. Our results identify melanoma cell-intrinsic functions of the PD-1:PD-L1 axis in tumor growth and suggest that blocking melanoma-PD-1 might contribute to the striking clinical efficacy of anti-PD-1 therapy.

Keywords: Melanoma; PD-1; PD-L1; S6 ribosomal protein; antibody; blockade; immune checkpoint; mTOR signaling; p-S6; programmed cell death-1; therapy.


Figures

Figure 1
Figure 1. PD-1 expression by melanoma cells
(A) Percentages (mean±s.e.m.) (left) and representative flow cytometry plots (right) of PD-1 surface protein expression by clinical tumor biopsy-derived melanoma cells (green) from n=8 distinct melanoma patients. These cells are negative for the CD45 lymphocyte common antigen (red) and the CD31 endothelial marker (see also Fig. S1A). (B) Representative immunofluorescence double staining of a clinical melanoma biopsy for co-expression of PD-1 (green) and MART-1 (red) or of PD-1 (green) and CD45 (red) on a serial tissue section. Nuclei were counterstained with DAPI (blue). Size bars, 100μm. Representative of n=22/36 melanoma patients demonstrating melanoma-PD-1 positivity. A patient was considered melanoma-PD-1 positive if any tumor biopsy (total of n=50) showed expression of PD-1 by MART-1+ and/or CD45 cells. See also Table S1. (C) RT-PCR expression analysis of full-length PD-1 (PDCD1) mRNA and (D) immunoblot of PD-1 protein expression by human melanoma lines and PBMCs. (E) Percentages (mean±s.e.m., left) and representative flow cytometry plots (right) of PD-1 surface protein expression by human melanoma lines (n=3–4 independent experiments, respectively). (F) RT-PCR expression analysis of full-length PD-1 (Pdcd1) mRNA and (G) immunoblot of PD-1 protein expression by murine B16-F0 and B16-F10 melanoma cells, wildtype (WT) and Pdcd1 knockout (KO) C57BL/6-derived splenocytes. (H) Percentages (mean±s.e.m., left) and representative flow cytometry plots (right) of PD-1 surface protein expression by B16 cells (n=4–6 independent experiments, respectively). (I) Representative PD-1 immunohistochemistry and immunofluorescence double staining for co-expression of PD-1 (green) with MART-1 (red) (inset photomicrograph) of a B16-F10 melanoma graft grown in NSG mice (size bar, 50μm). See also Figures S1 and S2, and Table S1.
Figure 2
Figure 2. Melanoma-expressed PD-1 promotes tumorigenicity in murine melanoma models
(A) PD-1 expression by Pdcd1-shRNA-1 and Pdcd1-shRNA-2 vs. vector control and by (B) Pdcd1-overexpressing (OE) vs. vector-control B16-F0 or B16-F10 melanoma cells. Representative flow cytometry plots show PD-1 expression in B16-F10 melanoma variants. (C) Tumor growth kinetics (mean±s.d.) of Pdcd1-shRNA-1/-2 vs. Pdcd1-OE vs. vector control B16-F0 or B16-F10 melanomas in C57BL/6 mice (n=10–30 each) or (D) NSG mice (n=10–20 each). (E) Mean number of tumor spheres±s.e.m (left) and immunoblot analysis of phosphorylated (p) and total S6, AKT, and ERK (right) in Pdcd1-shRNA-1 and Pdcd1-shRNA-2 vs. control and (F) Pdcd1-OE vs. vector-control B16 melanoma variants. Results are representative of n=2–3 independent experiments (**P<0.01, ***P<0.001). See also Figures S3 and S4.
Figure 3
Figure 3. Tumor cell-intrinsic PD-1 signaling promotes murine melanoma growth
(A) Growth kinetics (mean±s.d.) of Pdcd1-OE vs. vector control B16-F10 melanomas in PD-L1(−/−) KO Rag(−/−) KO (n=14 vs. 20 vs. 10) vs. wildtype Rag(−/−) KO recipients (n=14 vs. 14 vs. 8) treated with anti-PD-L1- vs. isotype control monoclonal antibody (mAb). (B) Growth kinetics (mean±s.d.) in C57BL/6 (left) and NSG mice (right) of Pdcd1-OE B16-F10 cells co-transduced with PD-L1 (Cd274, also known as Pdcd1lg1)-shRNA vs. control-shRNA compared to vector controls (n=10 each). (C) Mean number of tumor spheres±s.e.m (left), and immunoblot analysis of p- and total S6, AKT, and ERK in PD-L1 Ig vs. control Ig-treated B16 cultures (right). (D) Immunoblot analysis of p- and total S6, AKT, and ERK in PD-L1 Ig vs. control Ig-treated B16-F10 melanoma cells cultured in the presence of the pharmacologic PI3K inhibitors, wortmannin or LY294002, or the mTOR pathway inhibitors, rapamycin or PP242. (E) Schematic diagram illustrating the introduction of tyrosine to phenylalanine mutations to murine PD-1 signaling motifs via site-directed mutagenesis. (F) Relative Pdcd1 mRNA expression (top, mean±s.d.) and representative flow cytometry plots of PD-1 surface protein expression (bottom) by wildtype Pdcd1-OE vs. Y225F-Pdcd1-OE, Y248F-Pdcd1-OE, Y225F/Y248F-Pdcd1-OE, and vector-control B16-F10 variants. (G) Tumor growth kinetics in C57BL/6 (top, n=10–14 each) and NSG mice (bottom, n=8–10 each), (H) mean number of tumor spheres±s.e.m, and (I) immunoblot analysis of p- and total S6, AKT, and ERK in B16-F10 melanoma variants as in (F). Immunoblot results are representative of n=2 independent experiments, respectively (*P<0.05, **P<0.01, ***P<0.001). See also Figure S5.
Figure 4
Figure 4. PD-1 expression by human melanoma cells promotes experimental tumor growth
(A) Tumor growth kinetics (mean±s.d.) of PDCD1-shRNA-, PDCD1-shRNA-2, and PDCD1-OE vs. vector control human A375 (left), C8161 (center), and G3361 melanoma cells (right) grafted to NSG mice (n=8–20 each). (B) Mean number of tumor spheres±s.e.m and (C) immunoblot analysis (G3361) of phosphorylated (p) and total ribosomal protein S6, AKT, and ERK in PDCD1-shRNA-1/-2 vs. vector control, PDCD1-OE vs. vector-control, and PD-L1 Ig- vs. control Ig-treated human A375, C8161, and G3361 melanoma cultures. (D) Immunoblot analysis of p- and total S6, AKT, and ERK in PD-L1 Ig vs. control Ig-treated G3361 melanoma cells cultured in the presence of the pharmacologic PI3K inhibitors, wortmannin or LY294002, or the mTOR pathway inhibitors, rapamycin or PP242. (E) Schematic diagram illustrating the introduction of tyrosine to phenylalanine mutations to human PD-1 signaling motifs via site-directed mutagenesis. (F) Representative flow cytometry plots of PD-1 surface protein expression and (G) tumor growth kinetics (mean±s.d.) of PDCD1-OE vs. Y225F-PDCD1-OE, Y248F-PDCD1-OE, Y225F/Y248F-PDCD1-OE, and vector-control human A375 (top, n=10–24) and C8161 melanomas (bottom, n=10–12) in NSG mice, respectively. (H) Mean number of tumor spheres±s.e.m and (I) immunoblot analysis of p- and total S6, AKT, and ERK in C8161 melanoma variants as in (D). Immunoblot results are representative of n=2–3 independent experiments (*P<0.05, **P<0.01, ***P<0.001). See also Figure S6.
Figure 5
Figure 5. Anti-PD-1 blocking antibody inhibits murine melanoma growth in immunocompetent, immunocompromised and PD-1-deficient tumor graft recipient mice
(A) Tumor growth kinetics (mean±s.d.) of B16-F10 melanomas in wildtype C57BL/6 (n=32 vs. 34), (B) PD-1(−/−) knockout (KO) C57BL/6 (n=20 vs. 16), and (C) NSG (n=20 vs. 18), and of (D) Pdcd1-overexpressing (OE) vs. vector control B16-F10 melanomas in C57BL/6 (n=10 each) or (E) NSG mice (n=10 each) treated with anti-PD-1- vs. isotype control antibody. Representative immunohistochemical images illustrate binding of in vivo-administered rat anti-mouse PD-1 blocking but not isotype control antibody to the respective B16-F10 melanoma grafts (size bars, 50μm). (F) Mean number of tumor spheres±s.e.m. and (G) flow cytometric assessment of cell death (percent AnnexinV+/7AAD+ cells, mean±s.e.m. (left) and representative flow cytometry plots (right) of anti-PD-1- vs. isotype control mAb-treated murine B16-F0 and B16-F10 melanoma cultures. (H) Immunoblot analysis (representative of n=2 independent experiments) of phosphorylated (p) and total ribosomal protein S6, AKT, and ERK in B16 cultures concurrently treated with PD-L1 Ig vs. control Ig and/or anti-PD-1- vs. isotype control mAb NS: not significant, *P<0.05, **P<0.01, ***P<0.001). See also Figure S7.
Figure 6
Figure 6. Anti-PD-1 blocking antibody inhibits human melanoma xenograft growth in immunocompromised mice
(A) Kinetics (mean±s.d.) of clinical melanoma xenograft growth in NSG mice treated with anti-human PD-1 or isotype control antibody (patient A, n=7 each; patient B, n=5 vs. 4; patient C: n=10 each). (B) Tumor growth kinetics (mean±s.d.) and (C) representative secondary antibody staining (size bars, 50μm) of mouse anti-human PD-1 vs. isotype control antibody-treated human A375 (n=14 each), C8161 (n=14 each), or G3361 melanoma xenografts (n=16 vs. 12) or of (D) human PDCD1-OE vs. vector control-transduced C8161 xenografts in NSG mice (n=10 each). Immunohistochemical images illustrate binding of in vivo-administered mouse anti-human PD-1 blocking but not isotype control antibody to the respective human melanoma xenograft (size bars, 50μm). (E) Mean number of tumor spheres±s.e.m. and (F) flow cytometric assessment of cell death (percent AnnexinV+/7AAD+ cells, mean±s.e.m. (left) and representative flow cytometry plots (right) of anti-PD-1- vs. isotype control mAb-treated human A375, C8161, and G3361 melanoma cultures. (H) Immunoblot analysis (representative of n=3 independent experiments) of phosphorylated (p) and total ribosomal protein S6, AKT, and ERK in G3361 cultures concurrently treated with PD-L1 Ig vs. control Ig and/or anti-PD-1- vs. isotype control mAb (NS: not significant, *P<0.05, **P<0.01, ***P<0.001).
Figure 7
Figure 7. Analysis of p-S6 expression in tumor biospecimens obtained from patients with advanced-stage melanoma undergoing anti-PD-1 antibody therapy
(A) Expression of phospho (p)-S6 ribosomal protein by melanoma cells in tumor biospecimens obtained from n=11 patients with stage IV melanoma before treatment start compared to that in patient-matched progressive lesions sampled after initiation of anti-PD-1 antibody therapy. p-S6 expression by melanoma cells was determined by immunohistochemical analysis and graded by three independent investigators blinded to the study outcome on a scale of 0–4 (0: no p-S6 expression by melanoma cells; 1: p-S6 expression in 1–25%; 2: 26–50%; 3: 51–75%; 4: >75% of melanoma cells). (B) Representative p-S6 immunohistochemistry of tumor biospecimens obtained from melanoma patients before initiation with systemic anti-PD-1 antibody therapy showing low (<25%) vs. high (>25%) melanoma cell expression of p-S6. Size bars, 50μm. (C) Kaplan-Meier estimates of progression-free survival and (D) of overall survival probability in stage IV melanoma patients (n=34) demonstrating low (<25%, n=14 patients) vs. high melanoma cell-expression of p-S6 (>25%, n=20 patients) in tumor biospecimens obtained before initiation of systemic anti-PD-1 antibody treatment. See also Table S2.

References

    1. Aceto N, Sausgruber N, Brinkhaus H, Gaidatzis D, Martiny-Baron G, Mazzarol G, Confalonieri S, Quarto M, Hu G, Balwierz PJ, et al. Tyrosine phosphatase SHP2 promotes breast cancer progression and maintains tumor-initiating cells via activation of key transcription factors and a positive feedback signaling loop. Nat Med. 2012;18:529–537. - PubMed
    1. Civenni G, Walter A, Kobert N, Mihic-Probst D, Zipser M, Belloni B, Seifert B, Moch H, Dummer R, van den Broek M, et al. Human CD271-positive melanoma stem cells associated with metastasis establish tumor heterogeneity and long-term growth. Cancer Res. 2011;71:3098–3109. - PubMed
    1. Corcoran RB, Rothenberg SM, Hata AN, Faber AC, Piris A, Nazarian RM, Brown RD, Godfrey JT, Winokur D, Walsh J, et al. TORC1 suppression predicts responsiveness to RAF and MEK inhibition in BRAF-mutant melanoma. Sci Transl Med. 2013;5:196ra198. - PMC - PubMed
    1. Dong H, Strome SE, Salomao DR, Tamura H, Hirano F, Flies DB, Roche PC, Lu J, Zhu G, Tamada K, et al. Tumor-associated B7-H1 promotes T-cell apoptosis: a potential mechanism of immune evasion. Nat Med. 2002;8:793–800. - PubMed
    1. Flaherty KT, Hodi FS, Fisher DE. From genes to drugs: targeted strategies for melanoma. Nat Rev Cancer. 2012;12:349–361. - PubMed

Publication types