. 2015 Sep 10;162(6):1271-85.
doi: 10.1016/j.cell.2015.07.061.

Non-genomic and Immune Evolution of Melanoma Acquiring MAPKi Resistance

Affiliations

Non-genomic and Immune Evolution of Melanoma Acquiring MAPKi Resistance

Willy Hugo et al. Cell. .

Abstract

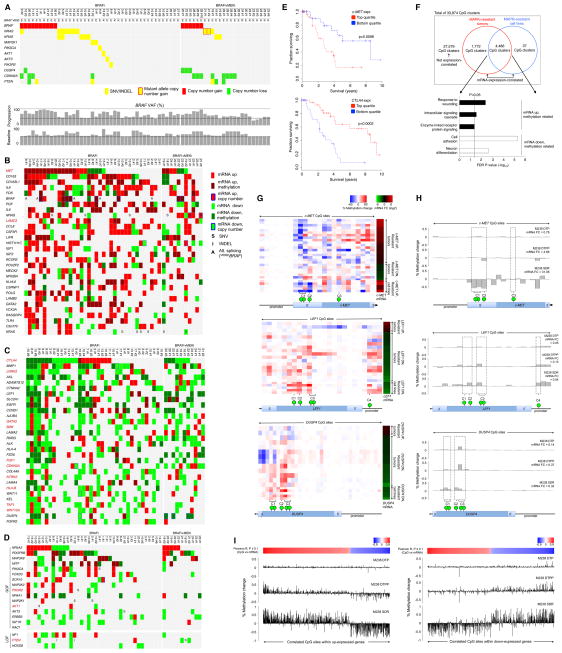
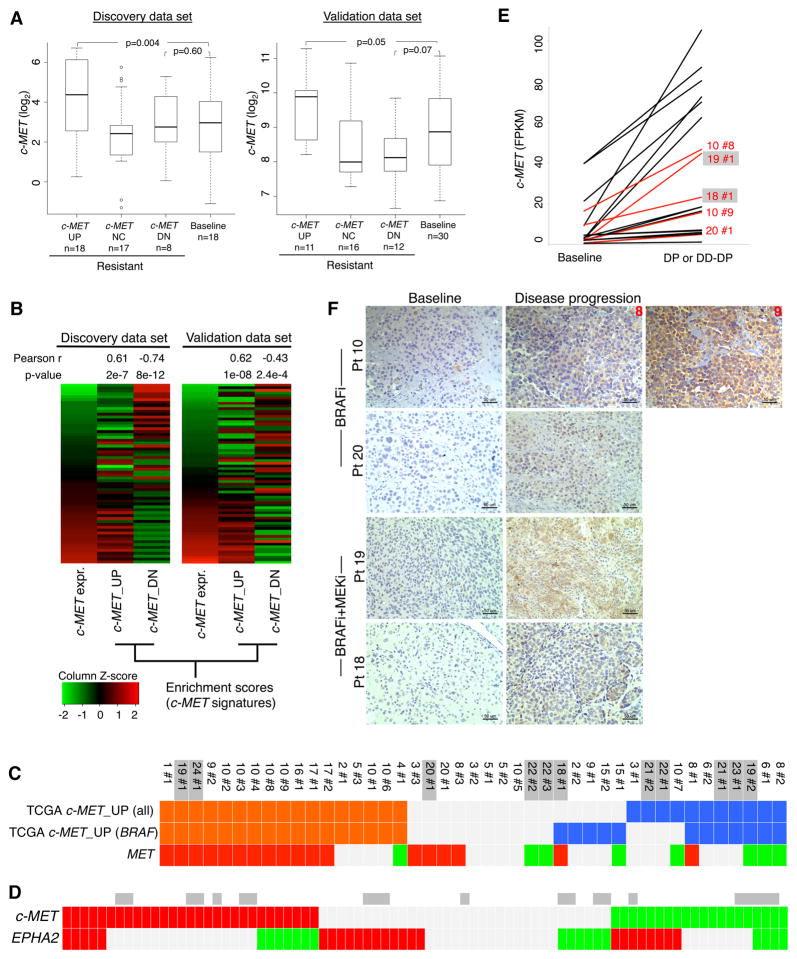
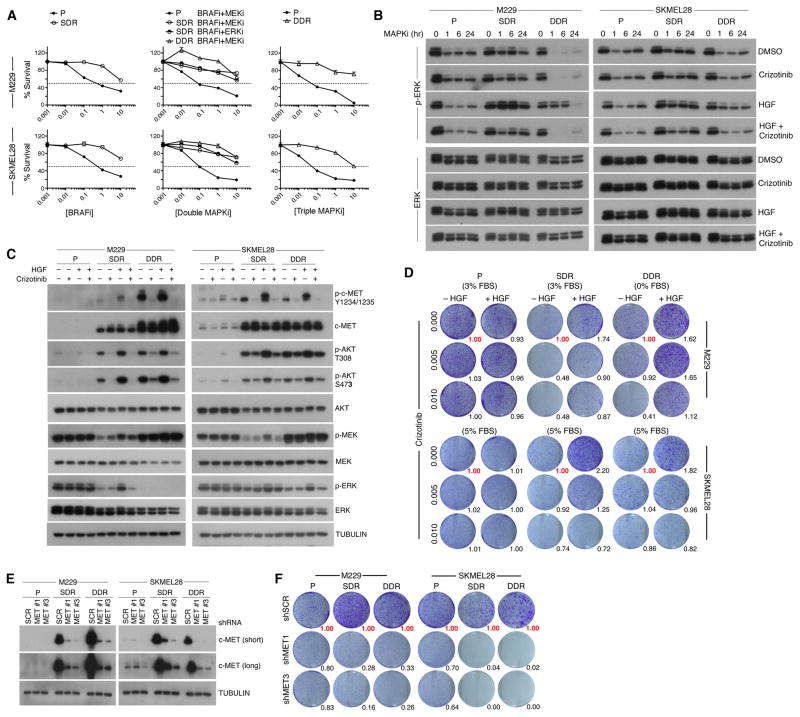
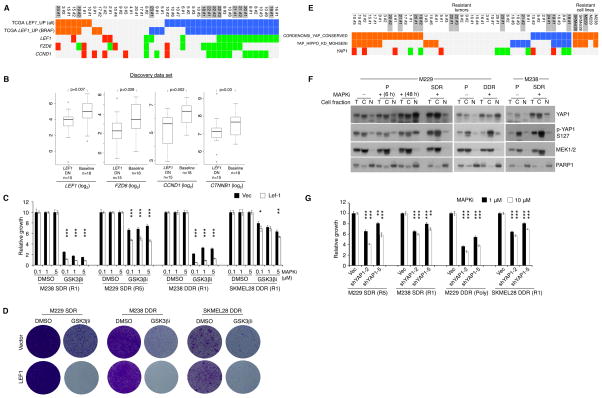
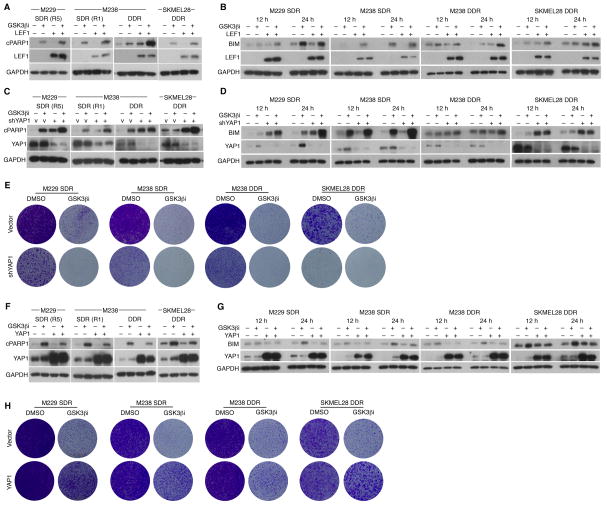
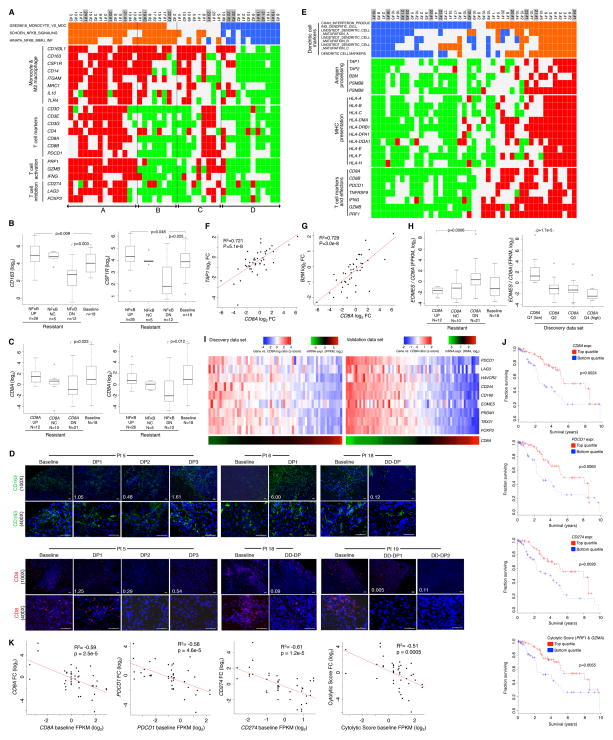
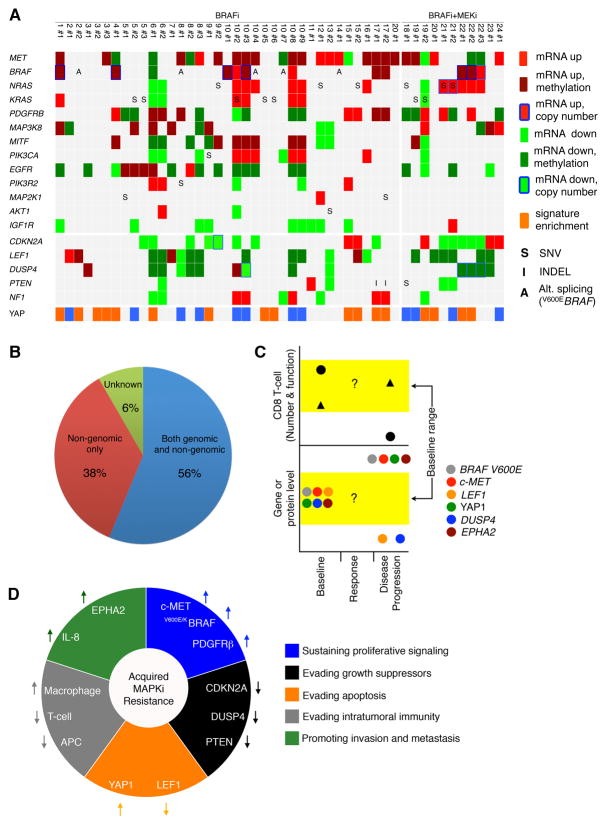
Clinically acquired resistance to MAPK inhibitor (MAPKi) therapies for melanoma cannot be fully explained by genomic mechanisms and may be accompanied by co-evolution of intra-tumoral immunity. We sought to discover non-genomic mechanisms of acquired resistance and dynamic immune compositions by a comparative, transcriptomic-methylomic analysis of patient-matched melanoma tumors biopsied before therapy and during disease progression. Transcriptomic alterations across resistant tumors were highly recurrent, in contrast to mutations, and were frequently correlated with differential methylation of tumor cell-intrinsic CpG sites. We identified in the tumor cell compartment supra-physiologic c-MET up-expression, infra-physiologic LEF1 down-expression and YAP1 signature enrichment as drivers of acquired resistance. Importantly, high intra-tumoral cytolytic T cell inflammation prior to MAPKi therapy preceded CD8 T cell deficiency/exhaustion and loss of antigen presentation in half of disease-progressive melanomas, suggesting cross-resistance to salvage anti-PD-1/PD-L1 immunotherapy. Thus, melanoma acquires MAPKi resistance with highly dynamic and recurrent non-genomic alterations and co-evolving intra-tumoral immunity.


Figures

Figure 1
Figure 1. Landscape of Genomic, Transcriptomic and Methylomic Alterations in Melanoma with Acquired MAPKi Resistance
(A) Matrix of disease progressive melanomas (n=67; indicated by patient and then tumor numbers) on BRAFi or BRAFi+MEKi therapies and of genes whose mutations cause acquired MAPKi resistance. Bottom, BRAF variant allelic frequencies or VAFs (resulting in V600E/K) adjusted by estimated tumor purities. (B and C) Tiling of top 30 recurrent GOF (B) or LOF (C) gene-based events among cancer/melanoma/immune genes across 48 disease-progressive V600BRAF mutant melanoma samples relative to patient-matched baseline melanomas (left, BRAFi; right, BRAFi+MEKi). GOF or LOF events defined as GOF:LOF ratio ≥ 2 or LOF:GOF ratio ≥ 2, respectively. SNV, expressed non-synonymous single-nucleotide variants; INDELs, expressed small insertion-deletions. Darker colors, differential mRNA expression significantly correlated with differential CpG cluster methylation. Splice variants based on RT-PCR detection reported for BRAF only. Genes in red, expression levels correlated with survival in the TCGA Melanoma data. (D) Resistance driver genes proposed in the literature and their genetic and non-genetic alterations in acquired MAPKi-resistant samples. (E) Kaplan-Meier 10-year survival curves for c-MET and CTLA4 expression groups among TCGA patients with BRAF mutant melanoma (n=118) and whose follow-up durations were within 10 years. P-values, log rank test. (F) Numbers of mRNA expression-correlated CpG clusters in resistant melanoma tissues and/or cell lines. Annotated genes from the overlapping CpG clusters grouped by up- or down-expression and Gene Ontology term enrichments. (G) Expression-correlated CpG clusters on c-MET, LEF1, and DUSP4. Green bubble, a CpG site with anti-correlated differential mRNA expression vs. gDNA methylation. Heatmaps showing (left) % methylation change at all profiled CpG sites (red, hyper- and blue, hypo-methylation) across all resistant tumors and cell lines sorted by fold change (FC) of mRNA expression (right) of each gene (red, up- and green, down-expression). (H) Percent methylation changes at profiled CpG sites (green bubbles, CpG sites nominated by aggregate tumor and cell line analysis as expression-correlated) and mRNA expression fold changes (FC). Both % methylation change and mRNA FC for each cell line sub-population were expressed relative to vehicle-treated M238. (I) Percent methylation changes across all expression-correlated CpG sites (top heat scale, Pearson correlation R values) nominated by aggregate tumor and cell line analysis and located within up-(left) or down-(right) expression genes in the SDR sub-population (vs. vehicle-treated parental M238). See also Table S1, Figure S1 and Data S1.
Figure 2
Figure 2. Recurrent c-MET Up-expression in Disease Progressive Melanomas
(A) c-MET mRNA expression levels in distinct subsets of disease progressive sample. P-values, Wilcoxon rank-sum test. (B) Pearson correlation (P-values, t-test) of the c-MET mRNA expression levels in all baseline and disease progressive melanoma samples (discovery, n=59; validation, n=61) with GSVA enrichment scores of the TCGA melanoma-derived c-MET signatures. (C, D) Tiling of c-MET signature enrichment (orange and blue, positive and negative enrichments) (C) and differential c-MET (C, D) and EPHA2 (D) expression (red and green, up- and down-expression) across disease progressive melanomas (DD-DP samples, grey) (both discovery and validation cohorts, D). (E–F) Levels of c-MET mRNA (E) and protein (F) (for samples in red) in patient-matched pairs where resistance-associated c-MET mRNA up-expression was detected (ruler, 50 micron). See also Table S2 and Figure S2.
Figure 3
Figure 3. c-MET Up-expression Drives Acquired MAPKi resistance
(A) Three-day MTT survival assays of two isogenic melanoma triplets in response to single MAPKi (BRAFi), double MAPKi (as indicated) or triple MAPKi (BRAFi+MEKi+ERKi). BRAFi, vemurafenib; MEKi, selumetinib; ERKi, SCH772984 (all in μM). Error bars, SEM, n=5; normalized to DMSO vehicle as 100%. (B) Western blot (WB) analysis of p-ERK recovery in both isogenic triplet cell lines in response to a single-dose of 1 μM BRAFi (P, SDR) or BRAFi+MEKi (DDR) under four conditions (DMSO/PBS, crizotinib (0.1 μM)/PBS, DMSO/HGF (20 ng/ml), and HGF/crizotinib). SDR and DDR sub-lines were first plated without MAPKi for 16 h. Loading controls, ERK. (C) WB levels of activation-associated phosphorylation and total levels of indicated proteins in response to vehicle, crizotinib, and/or HGF treatments (1 h). TUBULIN, loading control. (D) Long-term (10 d) clonogenic assay (P, no inhibitor; SDR, 1 μM BRAFi; DDR, 1 μM BRAFi+MEKi) −/+ HGF and crizotinib (μM). Growth quantifications relative to cultures without HGF and crizotinib (in red). (E) WB analysis of c-MET knockdown (short and long exposures). (F) Long-term (10 d) clonogenic assay −/+ c-MET knockdown. Growth quantifications relative to shScramble (shSCR) controls.
Figure 4
Figure 4. β-catenin-LEF1 Up- and YAP1 Down-regulation Sensitize Resistant Melanoma to MAPKi
(A) Tiling of LEF1_UP gene signature enrichment and differential expression of LEF1, FZD6 and CCND1 across disease progressive melanomas. (B) Indicated mRNA expression levels in LEF1 down-expressed, MAPKi-resistant melanomas vs. baseline melanomas. P-values, Wilcoxon rank-sum test. (C) Three-day survival assays of resistant melanoma cell lines at varying respective [BRAFi] and [BRAFi+MEKi], −/+ GSK3βi (10 μM CHIR99021) or LEF1 over-expression. (D) Clonogenic assays of resistant cell lines (cultured with 1 μM MAPKi) −/+ LEF1 over-expression, with DMSO (9 d) or GSK3βi (10 μM,18 d). (E) As in A except signature enrichment and differential expression indicated for YAP1. (F) Western blot analysis of indicated parental (P) and isogenic resistant cell lines for levels of total and phospho-YAP1 and fraction marker proteins in total (T), cytoplasmic (C), and nuclear (N) fractions. MAPKi, 1 μM. (G) Three-day survival assays of resistant melanoma cell lines at two indicated [BRAFi] or [BRAFi+MEKi], −/+ YAP1 knockdown. *<0.01, **<0.001, ***<0.0001, Student t-test p-values, −/+ LEF1 over-expression. See also Figure S3 and Table S3.
Figure 5
Figure 5. β-catenin-LEF1 and YAP1 Co-regulate Apoptotic Sensitivity of Acquired MAPKi-resistant Melanoma Cells
(A) Western blot (WB) analysis of indicated resistant melanoma cell lines (cultured with 1 μM MAPKi) for levels of cleaved PARP1 (cPARP1), LEF1, and GAPDH (loading control). Cells were treated with DMSO or GSK3βi (10 μM CHIR99021), −/+ LEF1 over-expression, for 1–2 days. (B–D) As in A, except cell lysates collected at 12 and 24 h and probed for BIM levels (B, D) or harbored shVector (V) or shYAP1 (C, D). (E) Clonogenic assays of indicated resistant cell lines (cultured with 1 μM MAPKi) treated with DMSO or GSK3βi (10 μM CHIR99021) for 14 d, −/+ YAP1 knockdown. (F, G) As in A, except cells −/+ YAP1 over-expression and WBs were probed for YAP1 and cPARP1 (F) or BIM (G). (H) As in E, except −/+ YAP1 over-expression; all cultures for 14 d except M238 DDR cultures with GSK3βi (22 d).
Figure 6
Figure 6. A Pro-tumorigenic Immune Microenvironment Co-evolves with MAPKi Resistance
(A) Tiling of differential gene signature enrichment (orange, positive; blue, negative) and expression (red, up; green, down) across disease progressive melanomas (DD-DP samples shaded grey). (B, C) Boxplots of mRNA levels detected in baseline vs. subsets of MAPK-resistant melanomas categorized by enrichment status of the SCHOEN_NFKB_SIGNALING signature (B, C) or differential CD8A expression status (C). (D) Anti-CD8 and -CD163 immunofluorescence of formalin-fixed, patient-matched melanoma tissues (ruler, 50 micron; white text, values of mRNA fold change). (E) Refer to A. (F–G) Correlations between mRNA levels of TAP1 (E) or B2M (F) vs. CD8A. (H) Boxplots of the ratio of EOMES/CD8A mRNA levels in baseline vs. distinct subsets of MAPKi-resistant melanoma based on CD8A fold change (FC) status (left) and in each quartile of CD8A expression across all tumor samples (right). (I) Heatmaps (left, discovery; right, validation) showing expression ratios of T-cell exhaustion genes to CD8A. Bottom, absolute mRNA levels of CD8A. (J) Ten-year survival of TCGA melanoma patients in the top and bottom quartile expression groups of indicated genes (P-values, log rank test). (K) Pearson correlations between mRNA levels at baseline vs. the FC from baseline to MAPKi-resistant melanomas. P-values by t-test for Pearson correlations and by one-sided Wilcoxon rank-sum test for boxplots. FC cutoff at ≥1.5. See also Figure S4, Table S4 and Data S2.
Figure 7
Figure 7. Melanoma Evolution Driven by MAPK-targeted Therapies
(A) Recurrence and heterogeneity of acquired resistance genes and mechanisms. (B) Scope of genomic and/or non-genomic acquired resistance mechanisms. (C) Dynamic gene expression alterations during the evolution of acquired resistance. Black circle and triangle, distinct tumor subsets. (D) Contributions of non-genomic alterations to cancer phenotypes of acquire MAPKi-resistant melanoma.

Comment in

References

    1. Biechele TL, Kulikauskas RM, Toroni RA, Lucero OM, Swift RD, James RG, Robin NC, Dawson DW, Moon RT, Chien AJ. Wnt/beta-catenin signaling and AXIN1 regulate apoptosis triggered by inhibition of the mutant kinase BRAFV600E in human melanoma. Sci Signal. 2012;5:ra3. - PMC - PubMed
    1. Ferrari de Andrade L, Ngiow SF, Stannard K, Rusakiewicz S, Kalimutho M, Khanna KK, Tey SK, Takeda K, Zitvogel L, Martinet L, et al. Natural Killer Cells Are Essential for the Ability of BRAF Inhibitors to Control BRAFV600E-Mutant Metastatic Melanoma. Cancer Res. 2014;74:7298–7308. - PubMed
    1. Girotti MR, Pedersen M, Sanchez-Laorden B, Viros A, Turajlic S, Niculescu-Duvaz D, Zambon A, Sinclair J, Hayes A, Gore M, et al. Inhibiting EGF receptor or SRC family kinase signaling overcomes BRAF inhibitor resistance in melanoma. Cancer Discov. 2013;3:158–167. - PMC - PubMed
    1. Gros A, Robbins PF, Yao X, Li YF, Turcotte S, Tran E, Wunderlich JR, Mixon A, Farid S, Dudley ME, et al. PD-1 identifies the patient-specific CD8(+) tumor-reactive repertoire infiltrating human tumors. J Clin Invest. 2014;124:2246–2259. - PMC - PubMed
    1. Johannessen CM, Boehm JS, Kim SY, Thomas SR, Wardwell L, Johnson LA, Emery CM, Stransky N, Cogdill AP, Barretina J, et al. COT drives resistance to RAF inhibition through MAP kinase pathway reactivation. Nature. 2010;468:968–972. - PMC - PubMed

Publication types

MeSH terms

Associated data