

An isomorphous replacement method for efficient de novo phasing for serial femtosecond crystallography
- PMID: 26360462
- PMCID: PMC4566134
- DOI: 10.1038/srep14017
An isomorphous replacement method for efficient de novo phasing for serial femtosecond crystallography
Abstract
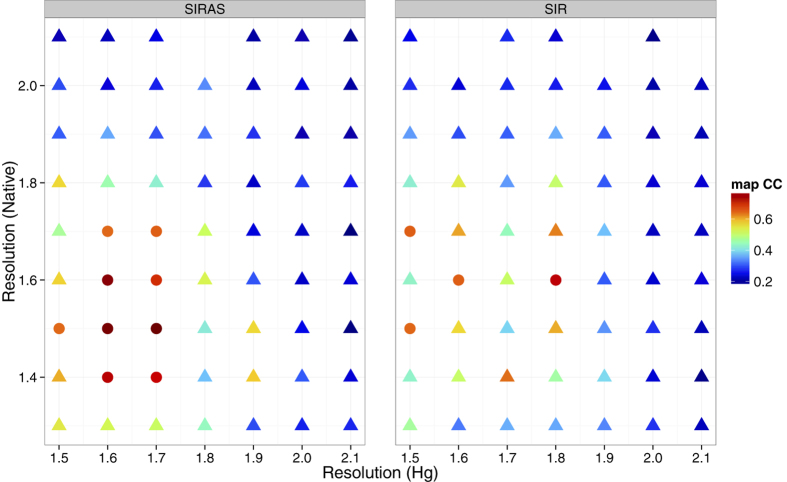
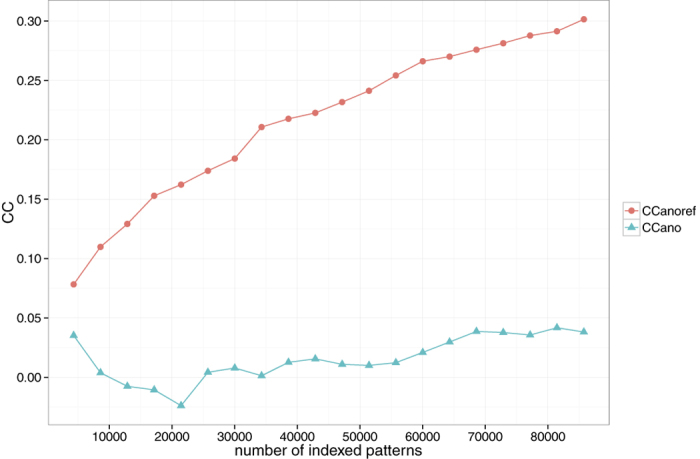
Serial femtosecond crystallography (SFX) with X-ray free electron lasers (XFELs) holds great potential for structure determination of challenging proteins that are not amenable to producing large well diffracting crystals. Efficient de novo phasing methods are highly demanding and as such most SFX structures have been determined by molecular replacement methods. Here we employed single isomorphous replacement with anomalous scattering (SIRAS) for phasing and demonstrate successful application to SFX de novo phasing. Only about 20,000 patterns in total were needed for SIRAS phasing while single wavelength anomalous dispersion (SAD) phasing was unsuccessful with more than 80,000 patterns of derivative crystals. We employed high energy X-rays from SACLA (12.6 keV) to take advantage of the large anomalous enhancement near the LIII absorption edge of Hg, which is one of the most widely used heavy atoms for phasing in conventional protein crystallography. Hard XFEL is of benefit for de novo phasing in the use of routinely used heavy atoms and high resolution data collection.
Figures
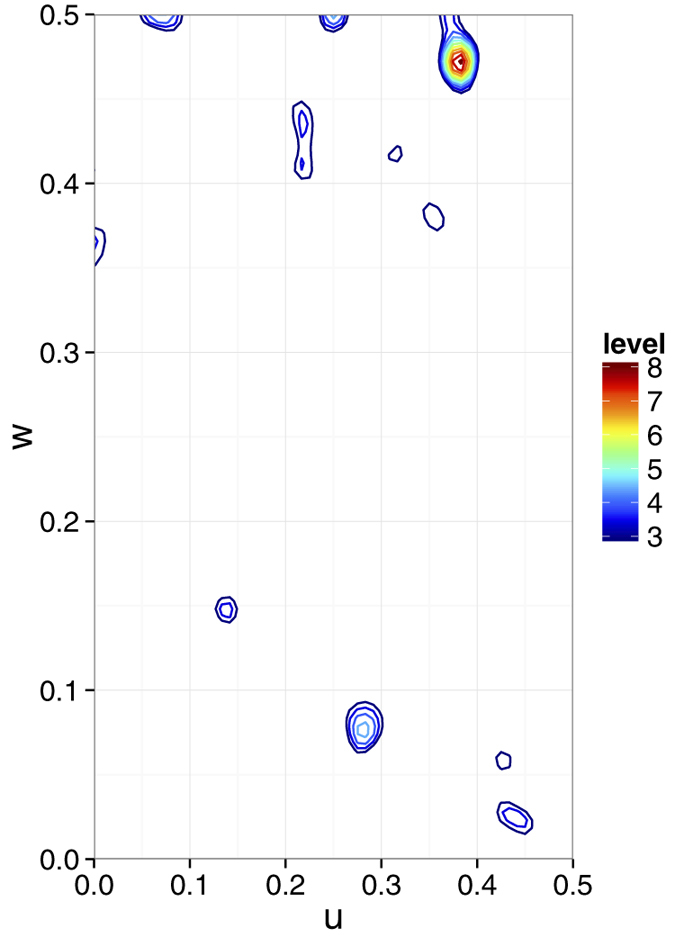
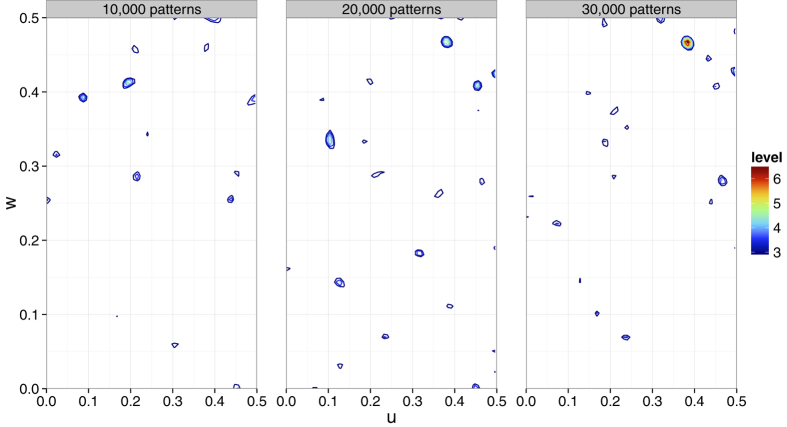
 Patterson map calculated using indexed patterns from 10,792 native and 10,000 Hg derivative LRE crystals. The Patterson map was calculated using CCTBX functionality. This figure was prepared using R with ggplot2 package.
Similar articles
-
Experimental phase determination with selenomethionine or mercury-derivatization in serial femtosecond crystallography.IUCrJ. 2017 Aug 8;4(Pt 5):639-647. doi: 10.1107/S2052252517008557. eCollection 2017 Sep 1. IUCrJ. 2017. PMID: 28989719 Free PMC article.
-
Membrane protein structure determination by SAD, SIR, or SIRAS phasing in serial femtosecond crystallography using an iododetergent.Proc Natl Acad Sci U S A. 2016 Nov 15;113(46):13039-13044. doi: 10.1073/pnas.1602531113. Epub 2016 Oct 31. Proc Natl Acad Sci U S A. 2016. PMID: 27799539 Free PMC article.
-
Protein structure determination by single-wavelength anomalous diffraction phasing of X-ray free-electron laser data.IUCrJ. 2016 Mar 9;3(Pt 3):180-91. doi: 10.1107/S2052252516002980. eCollection 2016 May 1. IUCrJ. 2016. PMID: 27158504 Free PMC article.
-
Serial femtosecond crystallography at the SACLA: breakthrough to dynamic structural biology.Biophys Rev. 2018 Apr;10(2):209-218. doi: 10.1007/s12551-017-0344-9. Epub 2017 Dec 1. Biophys Rev. 2018. PMID: 29196935 Free PMC article. Review.
-
[What Kind of Measurements Can Be Made with an X-ray Free Electron Laser at SACLA?].Yakugaku Zasshi. 2022;142(5):479-485. doi: 10.1248/yakushi.21-00203-1. Yakugaku Zasshi. 2022. PMID: 35491153 Review. Japanese.
Cited by
-
Oil-free hyaluronic acid matrix for serial femtosecond crystallography.Sci Rep. 2016 Apr 18;6:24484. doi: 10.1038/srep24484. Sci Rep. 2016. PMID: 27087008 Free PMC article.
-
Two-colour serial femtosecond crystallography dataset from gadoteridol-derivatized lysozyme for MAD phasing.Sci Data. 2017 Dec 12;4:170188. doi: 10.1038/sdata.2017.188. Sci Data. 2017. PMID: 29231920 Free PMC article.
-
Experimental phase determination with selenomethionine or mercury-derivatization in serial femtosecond crystallography.IUCrJ. 2017 Aug 8;4(Pt 5):639-647. doi: 10.1107/S2052252517008557. eCollection 2017 Sep 1. IUCrJ. 2017. PMID: 28989719 Free PMC article.
-
Selenium single-wavelength anomalous diffraction de novo phasing using an X-ray-free electron laser.Nat Commun. 2016 Nov 4;7:13388. doi: 10.1038/ncomms13388. Nat Commun. 2016. PMID: 27811937 Free PMC article.
-
Viscosity-adjustable grease matrices for serial nanocrystallography.Sci Rep. 2020 Jan 28;10(1):1371. doi: 10.1038/s41598-020-57675-7. Sci Rep. 2020. PMID: 31992735 Free PMC article.
References
-
- Spence J. C. H. et al.. Phasing of coherent femtosecond X-ray diffraction from size-varying nanocrystals. Opt. Exp. 19, 2866–2873 (2011). - PubMed
Publication types
MeSH terms
Substances
Associated data
- Actions
- Actions
- Actions
LinkOut - more resources
Full Text Sources
Other Literature Sources
Molecular Biology Databases
