

Round window electrocochleography before and after cochlear implant electrode insertion
- PMID: 26360623
- PMCID: PMC5949050
- DOI: 10.1002/lary.25602
Round window electrocochleography before and after cochlear implant electrode insertion
Abstract
Objective/hypothesis: Previous reports have documented the feasibility of utilizing electrocochleographic (ECoG) responses to acoustic signals to assess trauma caused during cochlear implantation. The hypothesis is that intraoperative round window ECoG before and after electrode insertion will help predict postoperative hearing preservation outcomes in cochlear implant recipients.
Study design: Prospective cohort study.
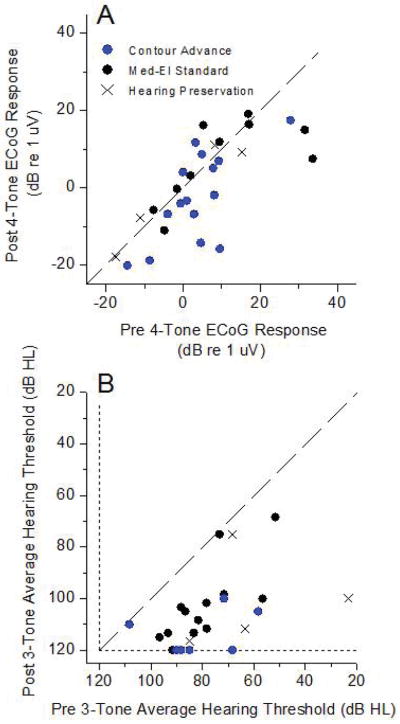
Methods: Intraoperative round window ECoG responses were collected from 31 cochlear implant recipients (14 children and 17 adults) immediately prior to and just after electrode insertion. Hearing preservation was determined by postoperative changes in behavioral thresholds.
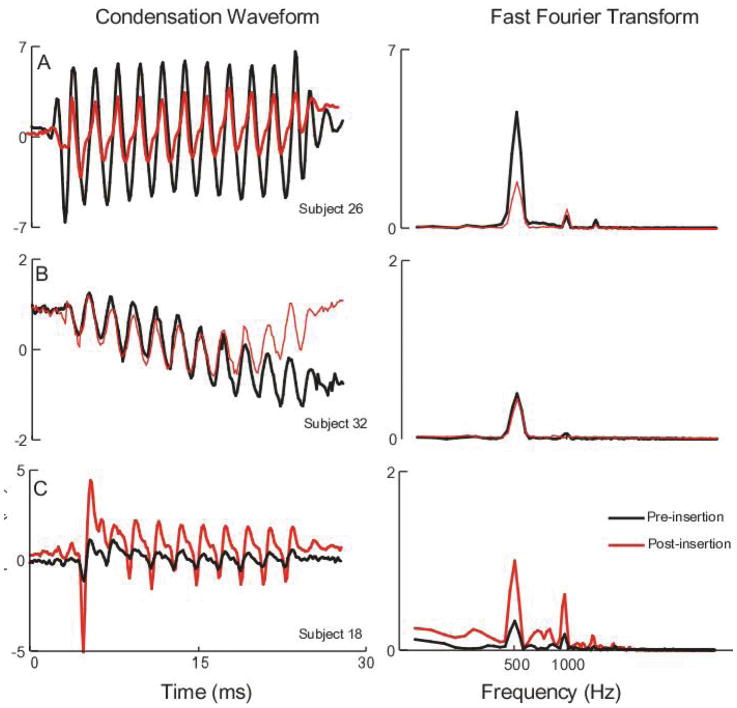
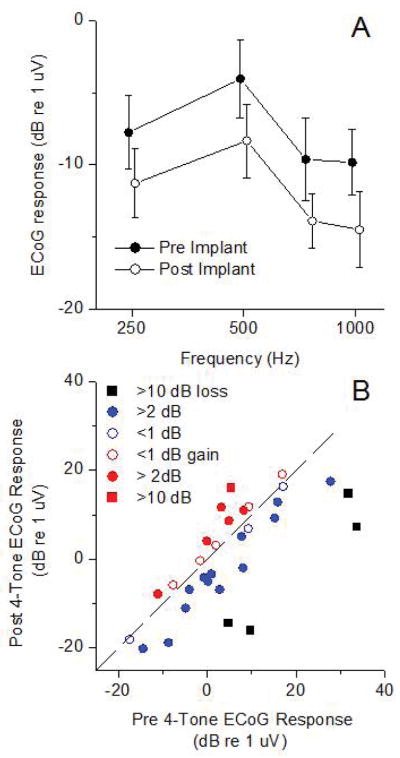
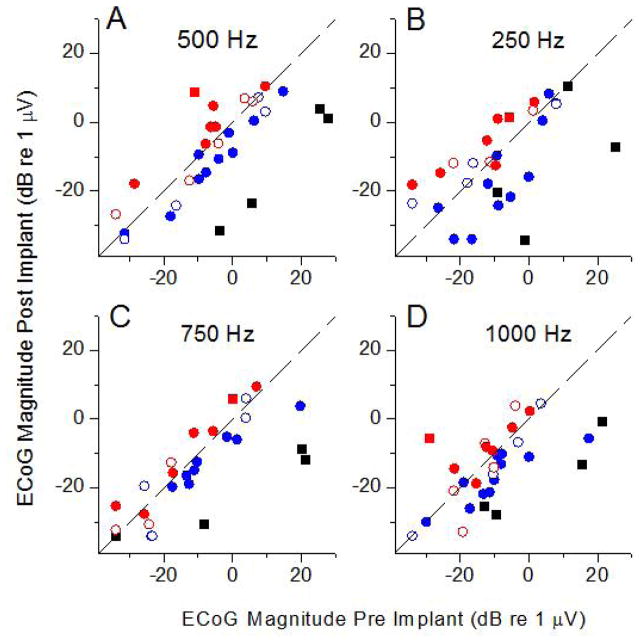
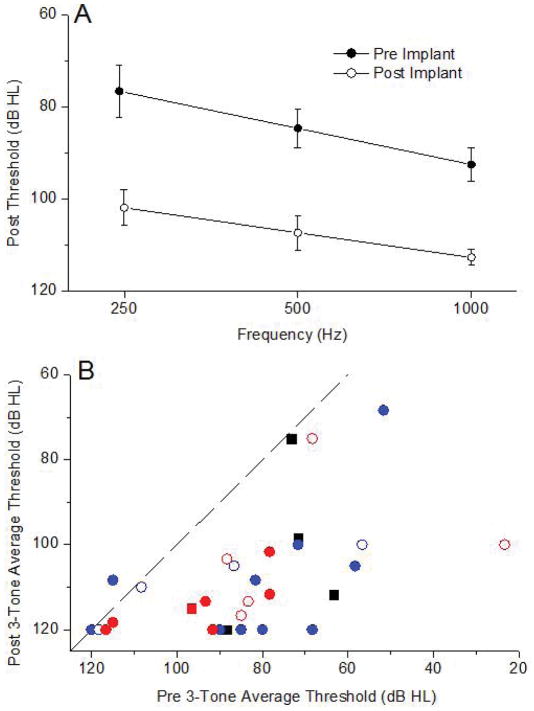
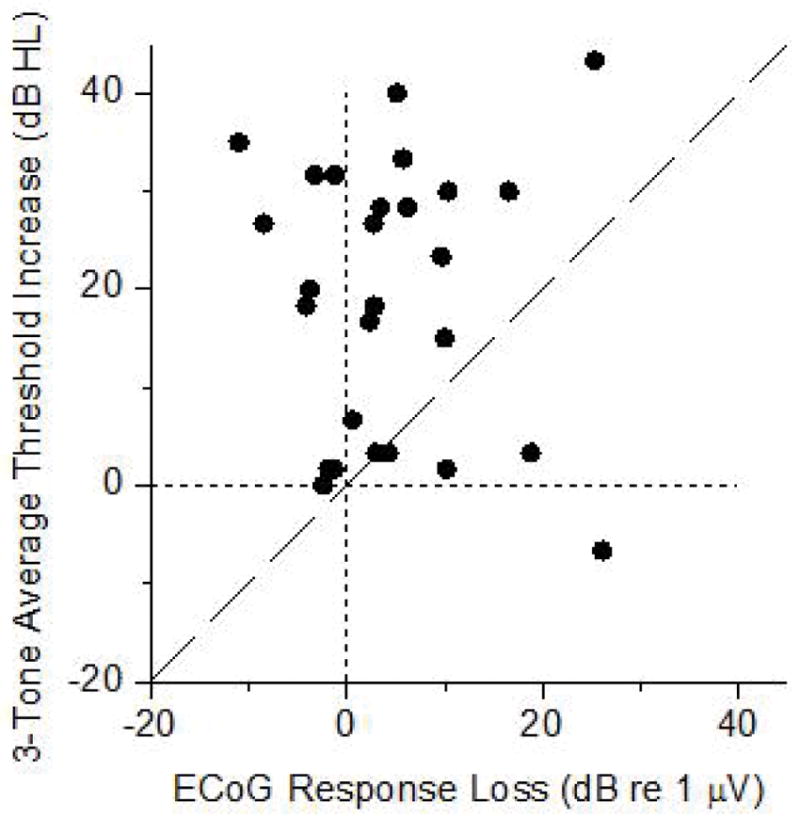
Results: On average, the postinsertion response was smaller than the preinsertion response by an average of 4 dB across frequencies. However, in some cases (12 of 31) the response increased after insertion. The subsequent hearing loss was greater than the acute loss in the ECoG, averaging 22 dB across the same frequency range (250-1,000 Hz). There was no correlation between the change in the ECoG response and the corresponding change in audiometric threshold.
Conclusions: Intraoperative ECoG is a sensitive method for detecting electrophysiologic changes during implantation but had limited prognostic value regarding hearing preservation in the current conventional cochlear implant patient population where hearing preservation was not intended.
Level of evidence: 2b Laryngoscope, 126:1193-1200, 2016.
Keywords: Electrocochleography; cochlear implants; cochlear physiology; hearing preservation; intraoperative monitoring.
© 2015 The American Laryngological, Rhinological and Otological Society, Inc.
Conflict of interest statement
Supported by a grant from the MED-El Corporation and the Howard Holderness Distinguished Medical Scholars Program at the University of North Carolina.
Figures
Similar articles
-
Electrocochleography in Cochlear Implant Users with Residual Acoustic Hearing: A Systematic Review.Int J Environ Res Public Health. 2020 Sep 26;17(19):7043. doi: 10.3390/ijerph17197043. Int J Environ Res Public Health. 2020. PMID: 32993065 Free PMC article.
-
Postoperative Electrocochleography from Hybrid Cochlear Implant users: An Alternative Analysis Procedure.Hear Res. 2018 Dec;370:304-315. doi: 10.1016/j.heares.2018.10.016. Epub 2018 Oct 29. Hear Res. 2018. PMID: 30393003 Free PMC article.
-
Intracochlear Electrocochleography: Response Patterns During Cochlear Implantation and Hearing Preservation.Ear Hear. 2019 Jul/Aug;40(4):833-848. doi: 10.1097/AUD.0000000000000659. Ear Hear. 2019. PMID: 30335669 Free PMC article.
-
Intraoperative round window electrocochleography and speech perception outcomes in pediatric cochlear implant recipients.Ear Hear. 2015 Mar-Apr;36(2):249-60. doi: 10.1097/AUD.0000000000000106. Ear Hear. 2015. PMID: 25259669
-
Bridging the gap: A systematic review of intraoperative electrocochleography during cochlear implantation and preservation of residual hearing.PLoS One. 2025 May 13;20(5):e0323493. doi: 10.1371/journal.pone.0323493. eCollection 2025. PLoS One. 2025. PMID: 40359384 Free PMC article.
Cited by
-
Light sheet microscopy of the gerbil cochlea.J Comp Neurol. 2021 Mar;529(4):757-785. doi: 10.1002/cne.24977. Epub 2020 Aug 3. J Comp Neurol. 2021. PMID: 32632959 Free PMC article.
-
Response Changes During Insertion of a Cochlear Implant Using Extracochlear Electrocochleography.Ear Hear. 2018 Nov/Dec;39(6):1146-1156. doi: 10.1097/AUD.0000000000000571. Ear Hear. 2018. PMID: 29554036 Free PMC article.
-
Electrocochleography in Cochlear Implant Users with Residual Acoustic Hearing: A Systematic Review.Int J Environ Res Public Health. 2020 Sep 26;17(19):7043. doi: 10.3390/ijerph17197043. Int J Environ Res Public Health. 2020. PMID: 32993065 Free PMC article.
-
Postoperative Electrocochleography from Hybrid Cochlear Implant users: An Alternative Analysis Procedure.Hear Res. 2018 Dec;370:304-315. doi: 10.1016/j.heares.2018.10.016. Epub 2018 Oct 29. Hear Res. 2018. PMID: 30393003 Free PMC article.
-
Acute effects of cochleostomy and electrode-array insertion on compound action potentials in normal-hearing guinea pigs.Front Neurosci. 2023 Feb 8;17:978230. doi: 10.3389/fnins.2023.978230. eCollection 2023. Front Neurosci. 2023. PMID: 36845413 Free PMC article.
References
-
- Adunka O, Roush P, Grose J, Macpherson C, Buchman CA. Monitoring of cochlear function during cochlear implantation. Laryngoscope. 2006;116:1017–1020. - PubMed
-
- Radeloff A, Shehata-Dieler W, Scherzed A, et al. Intraoperative monitoring using cochlear microphonics in cochlear implant patients with residual hearing. Otol Neurotol. 2012;33:348–354. - PubMed
-
- Dalbert A, Sim JH, Huber AM. Electrophysiologic Monitoring of Residual Hearing During and After Cochlear Implantation. Association for Research in Otolaryngology 37th Annual Midwinter Meeting; San Diego, CA: Association for Research in Otolaryngology Abstracts; 2014. pp. 317–318.
-
- Miller CA, Brown CJ, Abbas PJ, Chi SL. The clinical application of potentials evoked from the peripheral auditory system. Hear Res. 2008;242:184–197. - PubMed
-
- Schuknecht HF. Auditory and cytocochlear correlates of inner ear disorders. Otolaryngol Head Neck Surg. 1994;110:530–538. - PubMed
Publication types
MeSH terms
Grants and funding
LinkOut - more resources
Full Text Sources
Other Literature Sources
Research Materials
Miscellaneous
