. 2016;12(2):491-502.
doi: 10.1080/21645515.2015.1082693.

Booster dose after 10 years is recommended following 17DD-YF primary vaccination

Affiliations

Booster dose after 10 years is recommended following 17DD-YF primary vaccination

Ana Carolina Campi-Azevedo et al. Hum Vaccin Immunother. 2016.

Abstract

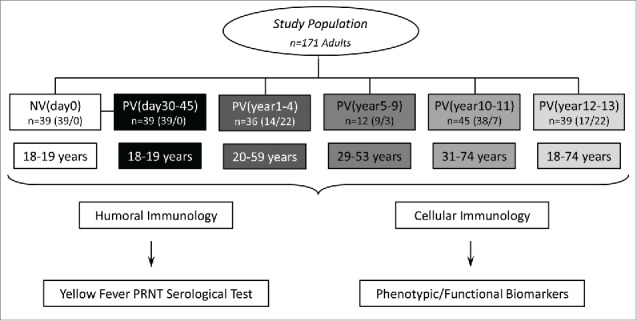
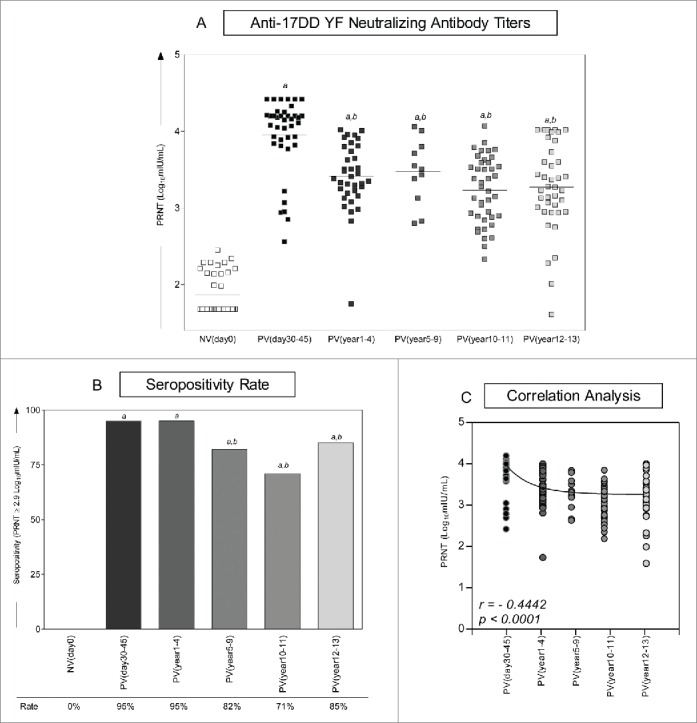
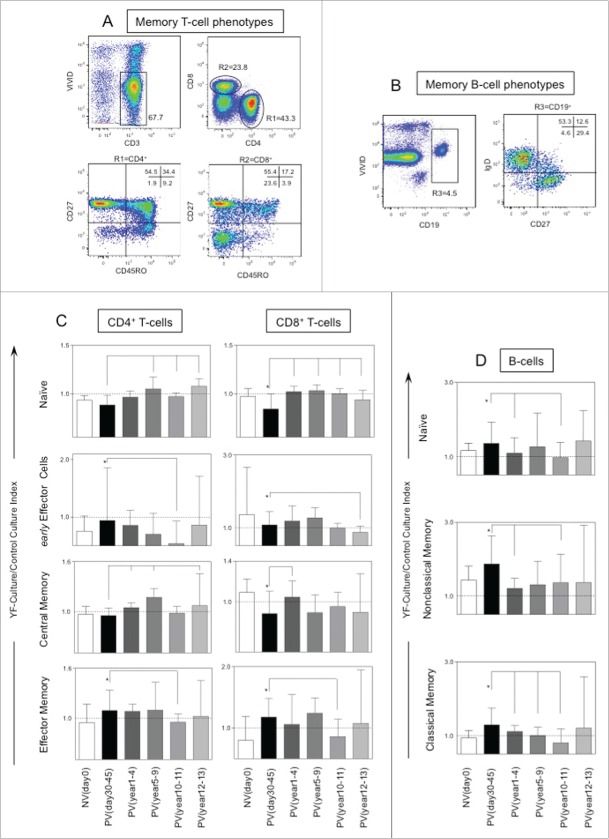
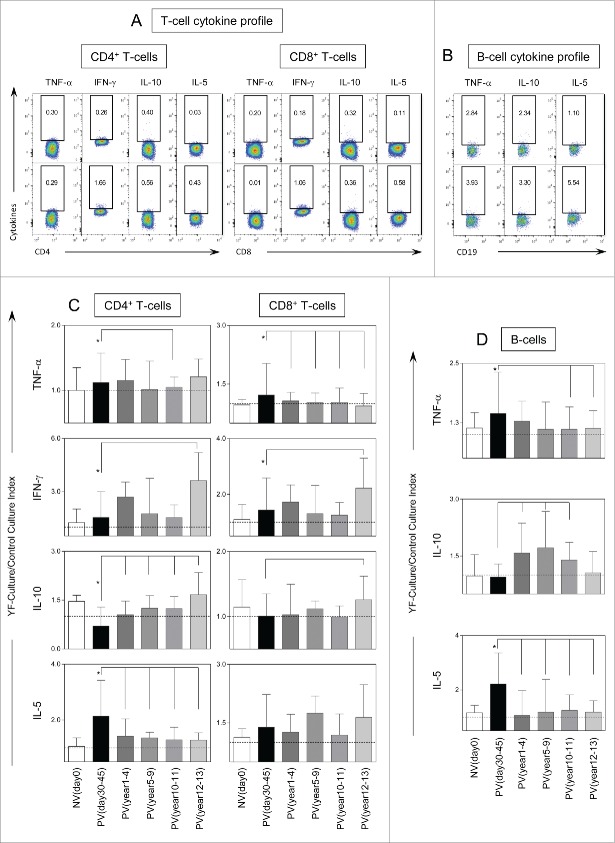
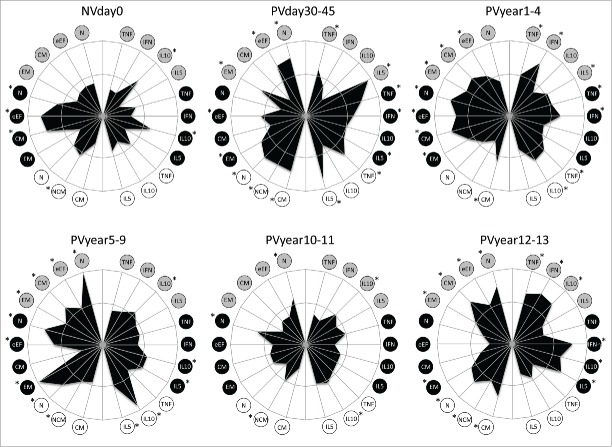
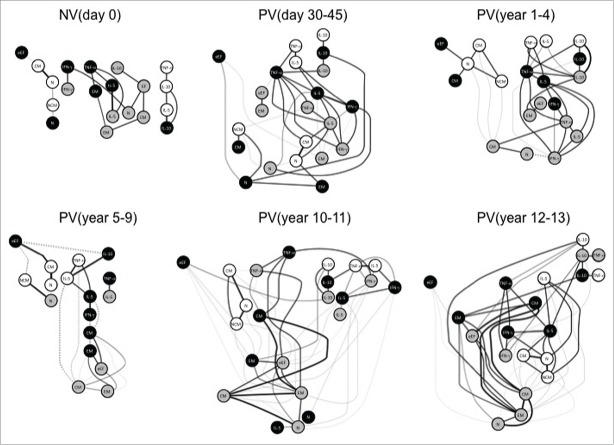
A single vaccination of Yellow Fever vaccines is believed to confer life-long protection. In this study, results of vaccinees who received a single dose of 17DD-YF immunization followed over 10 y challenge this premise. YF-neutralizing antibodies, subsets of memory T and B cells as well as cytokine-producing lymphocytes were evaluated in groups of adults before (NVday0) and after (PVday30-45, PVyear1-4, PVyear5-9, PVyear10-11, PVyear12-13) 17DD-YF primary vaccination. YF-neutralizing antibodies decrease significantly from PVyear1-4 to PVyear12-13 as compared to PVday30-45, and the seropositivity rates (PRNT≥2.9Log10mIU/mL) become critical (lower than 90%) beyond PVyear5-9. YF-specific memory phenotypes (effector T-cells and classical B-cells) significantly increase at PVday30-45 as compared to naïve baseline. Moreover, these phenotypes tend to decrease at PVyear10-11 as compared to PVday30-45. Decreasing levels of TNF-α(+) and IFN-γ(+) produced by CD4(+) and CD8(+) T-cells along with increasing levels of IL-10(+)CD4(+)T-cells were characteristic of anti-YF response over time. Systems biology profiling represented by hierarchic networks revealed that while the naïve baseline is characterized by independent micro-nets, primary vaccinees displayed an imbricate network with essential role of central and effector CD8(+) memory T-cell responses. Any putative limitations of this cross-sectional study will certainly be answered by the ongoing longitudinal population-based investigation. Overall, our data support the current Brazilian national immunization policy guidelines that recommend one booster dose 10 y after primary 17DD-YF vaccination.

Keywords: cytokine; duration of immunity; flow cytometry; memory cells and vaccination; vaccine; yellow fever.


Figures

Figure 1.
Figure 1.
Flowchart illustrating the study population and experimental design. The study was based on two branches: The humoral (A) and cellular (B) immunology analysis. The eligible population comprises 171 adults. Blood collections (without anticoagulant for humoral analysis and in heparinized tubes for cellular immunology assessment) were performed prior vaccination (NVday0 (n=39) and at different timepoints after primary vaccination: PVday30-45 (n=39); PVyear1-4 (n=36); PVyear5-9 (n=12); PVyear10-11 (n=45) and PVyear12-13 (n=39).
Figure 2.
Figure 2.
Immunogenicity following 17DD-YF primary vaccination. (A) Anti-YF neutralizing antibody titers were measured by PRNT carried out before NVday0 (n=39) and at different time-points after primary vaccination: PVday30-45 (n = 39); PVyear1-4 (n = 36); PVyear5-9 (n = 12); PVyear10-11 (n = 45) and PVyear12-13 (n = 39). PRNT antibody titers are expressed in log10 mIU/mL. (B) Seropositivity rates were determined by the PRNT value of 2.9 log10 mIU/mL as the cut-off point to segregate seropositive from seronegative samples and data analysis performed by multivariate logistic regression analysis modeled as a function of the time (in months) elapsed since vaccination as categories. (C) Correlation analysis of Anti-YF neutralizing antibody titers after primary vaccination at different time-points using linear regression fit curve. Spearman's correlation r index and p values are displayed in the lower corner of the graph. Significant differences at p < 0.05 as compared to NVday0 time-point are displayed as “a” and differences as compared to PVday30-45 are displayed as “b”.
Figure 3.
Figure 3.
Timeline of memory phenotypic features following 17DD-YF primary vaccination. (A) Flow cytometric dot plots representing the memory T-cell phenotypes and (B) memory B-cell phenotypes. (C) memory T-cell phenotypes such as naïve, early effector, central and effector memory T-cells as well as (D) B-cell phenotypes such as naïve, nonclassical and classical memory are represented by YF-Culture/Control culture index plotted as bar graphs for healthy adults prior vaccination NVday0 (n=39) and at different time-points after primary vaccination: PVday30-45 (n = 39); PVyear1-4 (n = 36); PVyear5-9 (n = 12); PVyear10-11 (n = 45) and PVyear12-13 (n = 39). Significant differences at p < 0.05 as compared to NVday0 time-point are displayed as “*” and differences as compared to PVday30-45 time-point are displayed as connecting lines.
Figure 4.
Figure 4.
For figure legend, see next page.
Figure 5.
Figure 5.
Phenotypic and functional memory analysis following 17DD-YF primary vaccination along time. Radar graphs represent the frequency of high producers of memory and functional phenotypic subsets relevant to assessing the immune response before and different times following primary vaccination. Memory phenotypic features were plotted on the left half, while the functional cytokine-producing T and B-cells were plotted at the right half of each radar graph. The inner circle represents the 50th percentile for each parameter, which was taken as threshold to define relevant frequency of subjects with higher levels of a given biomarker (*). Circles in gray, black and white refer to CD4+, CD8+ T-cells and B-cells, respectively. N – naïve, eEF – early effector, CM – Central Memory and EM – Effector Memory.
Figure 6.
Figure 6.
Systems biology analysis of 17DD-YF primary vaccination over time. Networks were assembled by assessing the association memory and functional phenotypic subsets relevant to assessing the immune response after 17DD-YF primary vaccination at each time-point. Only significant positive and negative correlations (p < 0.05) are displayed. Continuous lines represent direct or positive correlations, whereas dotted lines represent inverse or negative correlations defined by spearman's correlation r index, as described in material and methods. The correlation index (r) defined the strength of association as moderate when 0.36 > r < 0.67 (thin lines) or strong if r > 0.68 (thick lines). Circles in gray, black and white refer to CD4+, CD8+ T-cells and B-cells, respectively. N – naïve, eEF – early effector, CM – Central Memory and EM – Effector Memory.

References

    1. Monath TP. Yellow fever: an update. Lancet Infect Dis 2001; 1:11-20; PMID:11871403; http://dx.doi.org/10.1016/S1473-3099(01)00016-0 - DOI - PubMed
    1. Poland JD, Calisher CH, Monath TP, Downs WG, Murphy K. Persistence of neutralizing antibody 30-35 years after immunization with 17D yellow fever vaccine. Bull World Health Organ 1981; 59: 895-900; PMID:6978196 - PMC - PubMed
    1. Akondy RS, Monson ND, Miller JD, Edupuganti S, Teuwen D, Wu H, Quyyumi F, Garg S, Altman JD, Del Rio C, et al.. The yellow fever virus vaccine induces a broad and polyfunctional human memory CD8+ T cell response. J Immunol 2009; 183:7919-30; PMID:19933869; http://dx.doi.org/10.4049/jimmunol.0803903 - DOI - PMC - PubMed
    1. Collaborative group for studies on yellow fever vaccines . Duration of post-vaccination immunity against yellow fever in adults. Vaccine 2014; 32:4977-84; PMID:25090646; http://dx.doi.org/10.1016/j.vaccine.2014.07.021 - DOI - PubMed
    1. Gotuzzo E, Yactayo S, Córdova E. Efficacy and duration of immunity after yellow fever vaccination: systematic review on the need for a booster every 10 years. Am J Trop Med Hyg 2013; 89:434-44; PMID:24006295; http://dx.doi.org/10.4269/ajtmh.13-0264 - DOI - PMC - PubMed

Publication types

MeSH terms

LinkOut - more resources