. 2015 Aug 5;2(8):150152.
doi: 10.1098/rsos.150152. eCollection 2015 Aug.

Iconicity can ground the creation of vocal symbols

Affiliations

Iconicity can ground the creation of vocal symbols

Marcus Perlman et al. R Soc Open Sci. .

Abstract

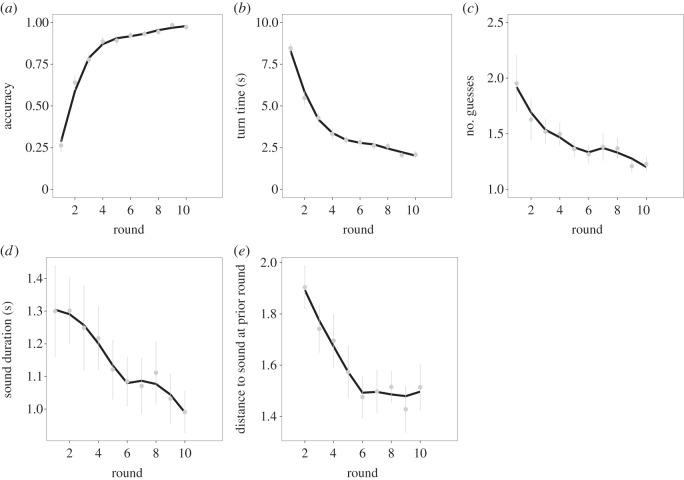
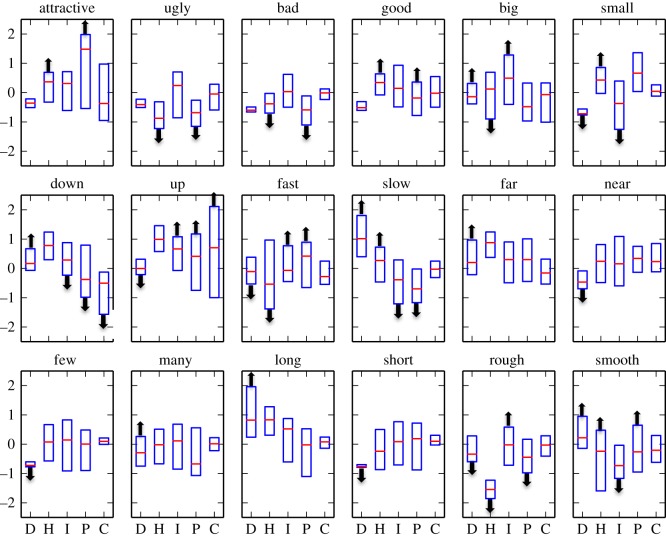
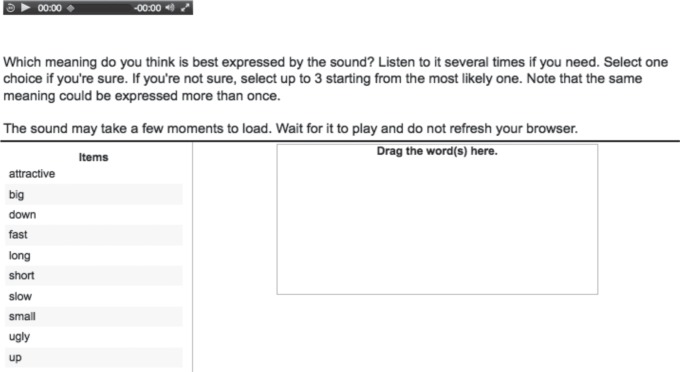
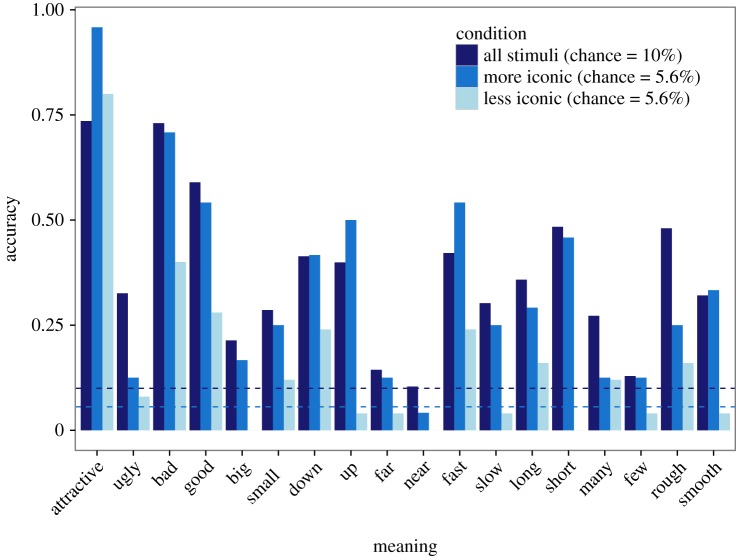
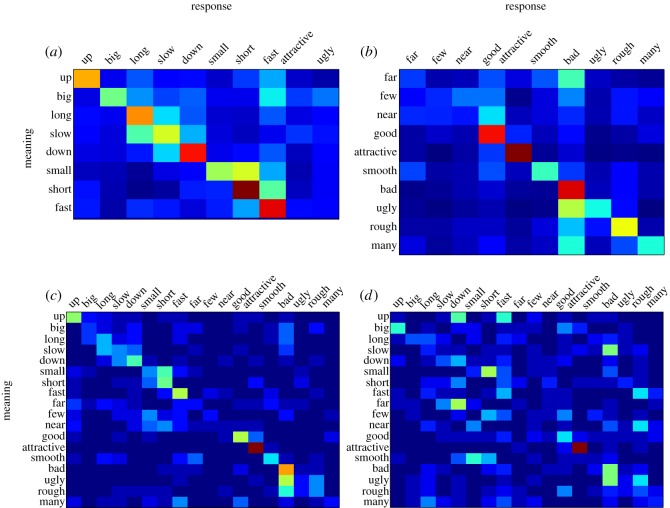
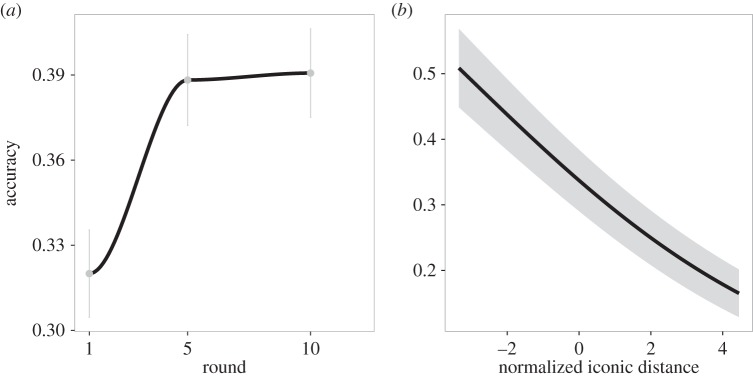
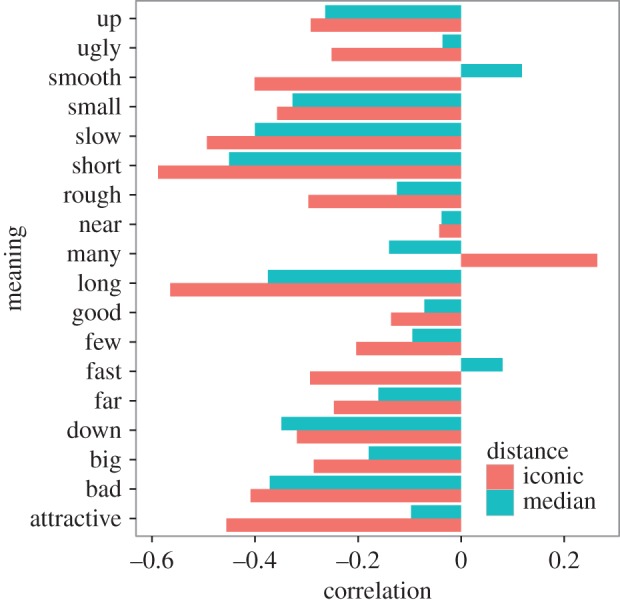
Studies of gestural communication systems find that they originate from spontaneously created iconic gestures. Yet, we know little about how people create vocal communication systems, and many have suggested that vocalizations do not afford iconicity beyond trivial instances of onomatopoeia. It is unknown whether people can generate vocal communication systems through a process of iconic creation similar to gestural systems. Here, we examine the creation and development of a rudimentary vocal symbol system in a laboratory setting. Pairs of participants generated novel vocalizations for 18 different meanings in an iterative 'vocal' charades communication game. The communicators quickly converged on stable vocalizations, and naive listeners could correctly infer their meanings in subsequent playback experiments. People's ability to guess the meanings of these novel vocalizations was predicted by how close the vocalization was to an iconic 'meaning template' we derived from the production data. These results strongly suggest that the meaningfulness of these vocalizations derived from iconicity. Our findings illuminate a mechanism by which iconicity can ground the creation of vocal symbols, analogous to the function of iconicity in gestural communication systems.

Keywords: experimental semiotics; iconicity; language evolution; vocalization.


Figures

Figure 1.
Figure 1.
Performance and change in the form of vocalizations over 10 round of vocal charades. The lines in each plot were fit by local regression. Error bars represent standard error between subjects. Round is displayed on the x-axis of each plot. (a) Mean accuracy increased across rounds. (b) The mean number of guesses per turn decreased across rounds. (c) Mean turn time (s) decreased across rounds. (d) Sound duration (s) decreased across rounds. (e) The mean Euclidean distance between the form of sounds produced at round t and round t−1. Sounds became increasingly similar across the first 5 rounds.
Figure 2.
Figure 2.
The plots show the acoustic characteristics of each of the 18 meanings. The five variables are represented on the x-axis: D, duration; H, harmonics to noise ratio; I, intensity; P, pitch; C, pitch change. All values are normalized (z-scored) for each of the five measures. The red line shows the median and the blue box spans the first and third quartiles. The up and down arrows indicate variables that differed reliably between antonymic meanings. For example, vocalizations for bad differed from those for good by having a lower harmonics to noise ratio and pitch. The variables marked with arrows were the basis for the iconic template of each meaning.
Figure 3.
Figure 3.
Screenshot of the interface from the playback experiments. Participants listened to a sound as many times as they wanted by clicking on the ‘play’ arrow. They then made their selection by dragging the chosen word into the empty box.
Figure 4.
Figure 4.
Accuracy of naive listeners at selecting the correct meaning in the playback experiments. The dark blue bars represent playback for stimuli with varied iconicity (10 choices for each meaning; chance=10%, indicated by the dark blue dashed line). The medium and light blue bars show performance from a follow-up experiment with more and less iconic instances of the vocalizations, respectively (18 choices for each meaning: chance=5.6% indicated by the medium blue dashed line). Accuracy was higher for the more iconic versus less iconic vocalizations for all 18 of the tested meanings.
Figure 5.
Figure 5.
Confusions made for each of the meanings during the playback experiments. The y-axis displays the meaning of the sound that was presented, and the x-axis displays the meaning that was selected. The ordering of meanings in each matrix was determined by a norming experiment that collected similarity ratings between each possible pair of meanings, with more similar words placed closer together. Warmer colours indicate more frequent choices. (a) Results from the first batch and (b) from the second batch in the playback experiment. Warmer colours gravitate along the diagonal, showing that listeners tended to select the correct response or a meaning that was similar to it. The results from the follow-up experiment with more and less iconic stimuli are shown in (c) and (d), respectively. Warmer colours gravitate along the diagonal for more iconic stimuli, but responses for less iconic stimuli appear more random.
Figure 6.
Figure 6.
(a) Accuracy in the playback experiment as a function of the round in which the stimulus was produced in the vocal charades game. Error bars display standard error between subjects. Accuracy is higher in rounds 5 and 10 compared to round 1. (b) Accuracy as a function of the normalized iconic distance of the stimulus. Iconic distance is the Euclidean distance between the vocalization and the iconic template for its intended meaning. Accuracy is higher for vocalizations that are closer to the template.
Figure 7.
Figure 7.
Correlations between the two distance metrics to each particular meaning and probability of selecting that meaning. The correlation coefficient is plotted on the x-axis and meaning on the y-axis. Red represents iconic distance, and blue median distance. Negative correlations indicate that smaller distances to a particular meaning are associated with a higher likelihood of selecting that meaning. All meanings but many are associated with a negative correlation.

References

    1. De Vos C, Pfau R. 2015. Sign language typology: the contribution of rural sign languages. Annu. Rev. Linguist. 1, 265–288. (doi:10.1146/annurev-linguist-030514-124958) - DOI
    1. Sandler W, Meir I, Padden C, Aronoff M. 2005. The emergence of grammar: systematic structure in a new language. Proc. Natl Acad. Sci. USA 102, 2661–2665. (doi:10.1073/pnas.0405448102) - DOI - PMC - PubMed
    1. Senghas A, Kita S, Özyürek A. 2004. Children creating core properties of language: evidence from an emerging sign language in Nicaragua. Science 305, 1779–1782. (doi:10.1126/science.1100199) - DOI - PubMed
    1. Frishberg N. 1975. Arbitrariness and iconicity: historical change in American Sign Language. Language 51, 696–719. (doi:10.2307/412894) - DOI
    1. Meir I, Israel A, Sandler W, Padden CA, Aronoff M. 2012. The influence of community on language structure: evidence from two young sign languages. Linguist. Var. 12, 247–291. (doi:10.1075/lv.12.2.04mei) - DOI