. 2015 Oct 22;126(17):2005-15.
doi: 10.1182/blood-2015-04-639062. Epub 2015 Sep 11.

Overexpression and knockout of miR-126 both promote leukemogenesis

Affiliations

Overexpression and knockout of miR-126 both promote leukemogenesis

Zejuan Li et al. Blood. .

Abstract

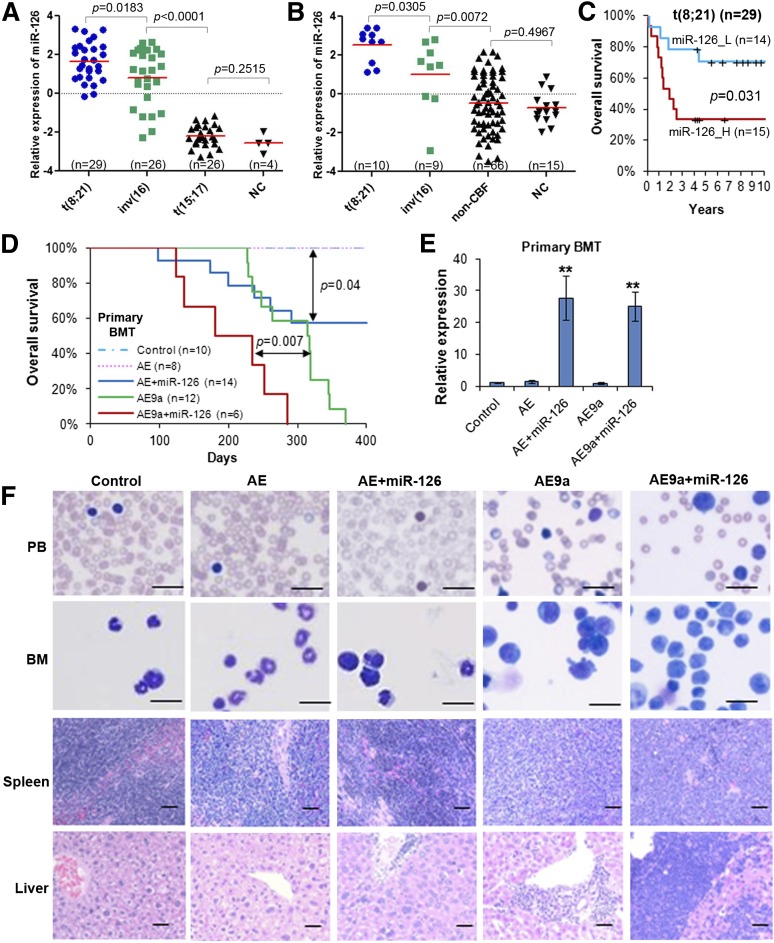
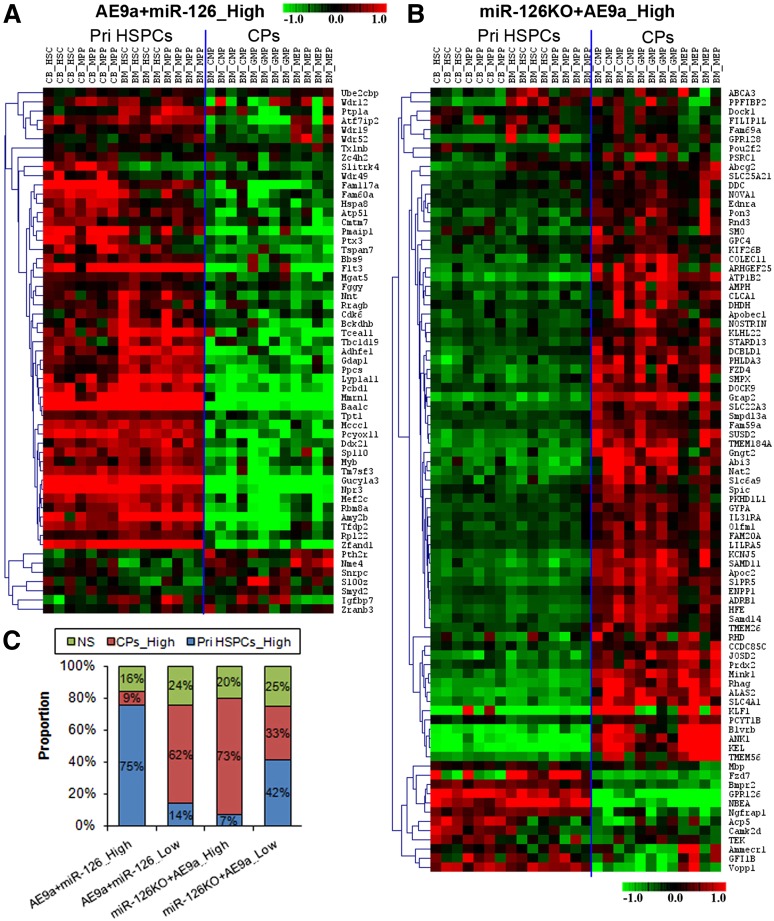
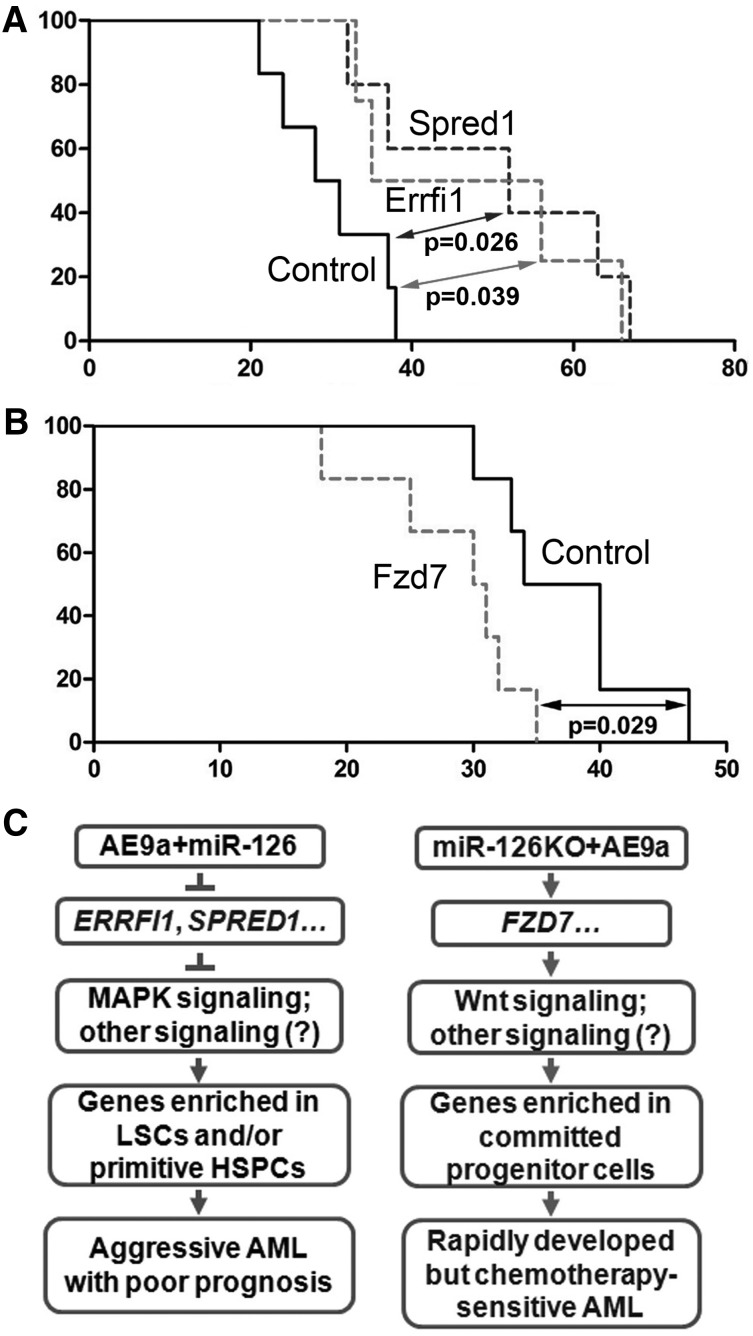
It is generally assumed that gain- and loss-of-function manipulations of a functionally important gene should lead to the opposite phenotypes. We show in this study that both overexpression and knockout of microRNA (miR)-126 surprisingly result in enhanced leukemogenesis in cooperation with the t(8;21) fusion genes AML1-ETO/RUNX1-RUNX1T1 and AML1-ETO9a (a potent oncogenic isoform of AML1-ETO). In accordance with our observation that increased expression of miR-126 is associated with unfavorable survival in patients with t(8;21) acute myeloid leukemia (AML), we show that miR-126 overexpression exhibits a stronger effect on long-term survival and progression of AML1-ETO9a-mediated leukemia stem cells/leukemia initiating cells (LSCs/LICs) in mice than does miR-126 knockout. Furthermore, miR-126 knockout substantially enhances responsiveness of leukemia cells to standard chemotherapy. Mechanistically, miR-126 overexpression activates genes that are highly expressed in LSCs/LICs and/or primitive hematopoietic stem/progenitor cells, likely through targeting ERRFI1 and SPRED1, whereas miR-126 knockout activates genes that are highly expressed in committed, more differentiated hematopoietic progenitor cells, presumably through inducing FZD7 expression. Our data demonstrate that miR-126 plays a critical but 2-faceted role in leukemia and thereby uncover a new layer of miRNA regulation in cancer. Moreover, because miR-126 depletion can sensitize AML cells to standard chemotherapy, our data also suggest that miR-126 represents a promising therapeutic target.


Figures

Figure 1
Figure 1
miR-126 expression patterns in human AML subtypes, its prognosis impact in t(8;21) AML, and its pathological effect in leukemogenesis induced by AE and AE9a fusion genes. Expression patterns of miR-126 in the In-house 85S data set (A) or the In-house 100S data set (B). The P values were calculated by 2-tailed Student t test. (C) Comparison of OS between t(8;21) AML patients with higher or lower levels of miR-126 expression (median OS, 1.9 years vs 7.0 years, respectively; P = .031) in the In-house 85S data set. Kaplan-Meier survival curves are shown. The P values were calculated by log-rank test. (D) Effect of miR-126 on AE- and AE9a-induced primary leukemogenesis. Kaplan-Meier curves are shown for 5 cohorts of transplanted mice: MSCV-PIG (control), MSCV-PIG-AML1-ETO (AE), MSCV-PIG-AML1-ETO-miR-126 (AE+miR-126), MSCV-PIG-AML1-ETO9a (AE9a), and MSCV-PIG-AML1-ETO9a-miR-126 (AE9a+miR-126). P values were calculated by log-rank test. (E) Expression of miR-126 level was detected by qRT-PCR assay in the primary BMT mouse BM cells, which were isolated and sorted by flow cytometry for CD45.2+ cells at the end point. **P < .01. (F) Wright-Giemsa–stained PB and BM, and H&E-stained spleen and liver of the primary BMT recipient mice at the end point. Bars represent 25 μm for PB and BM; 100 μm for spleen and liver. H&E, hematoxylin and eosin; _H, high; _L, low; n, number of mice studied; NC, normal hematopoietic cells; OS, overall survival; PB, peripheral blood; qRT-PCR, quantitative real-time polymerase chain reaction.
Figure 2
Figure 2
Knockout and overexpression of miR-126 promote AE9a-induced leukemogenesis in primary and secondary BMT. (A) The effect of the overexpression and knockout of miR-126 on AE9a-induced primary leukemogenesis in primary BMT recipient mice. Kaplan-Meier curves and P values (log-rank test) are shown. (B) Expression of miR-126 was detected by qRT-PCR assay in leukemic or control BM cells (CD45.2+) isolated from primary BMT recipient mice at the end point. **P < .01. Survival curves (C) and relative miR-126 expression levels (D) in secondary BMT recipient mice are shown. **P < .01. (E) Wright-Giemsa–stained PB and BM, and H&E-stained spleen and liver of the secondary BMT recipient mice at the end point. Bars represent 25 μm for PB and BM; 100 μm for spleen and liver.
Figure 3
Figure 3
Overexpression of miR-126 exhibited a more potent effect than knockout of miR-126 on long-term LSC/LIC self-renewal and frequency. (A) The tertiary BMT recipients were transplanted with leukemic BM cells isolated from the secondary BMT recipient mice of the AE9a, AE9a+miR-126, and miR-126KO+AE9a groups. Kaplan-Meier curves and P values (log-rank test) are shown. (B) Expression of miR-126 was detected by qRT-PCR assay in leukemic BM cells (CD45.2+) of tertiary BMT recipients. **P < .01. Survival curves (C) and relative miR-126 expression levels (D) of the 3 groups in quaternary BMT are shown. (E) Mouse BM leukemic cells from secondary BMT recipient mice were used as donor cells for BMT in the limiting dilution assays. The estimated LSC/LIC frequencies of the AE9a, AE9a+miR-126, and miR-126KO+AE9a groups are 1/166 619 (95% CI, 1/529 517-1/52 429), 1/2476 (95% CI, 1/7237-1/847), and 1/27 399 (95% CI, 1/66 212-1/11 338), respectively. Significance of the frequency difference: AE9a vs AE9a+miR-126, P = 5.35 × 10−92-test); AE9a vs miR-126KO+AE9a, P = .0092; AE9a+miR-126 vs miR-126KO+AE9a, P =.00072. (F) Mouse spleen leukemic cells from secondary BMT recipient mice were used as donor cells. The estimated LSC/LIC frequency of the AE9a+miR-126 group is 1/95 040 (95% CI, 1/215 902-1/41 837), significantly greater (P = .00088) than that of the miR-126KO+AE9a group at 1/653 224 (95% CI, 1/1 380 618-1/309 066). CI, confidence interval; Dose, number of donor cells; Tested, total number of mice used as BMT recipients in the limiting dilution assay; Response, mice that developed leukemia within 15 weeks post BMT.
Figure 4
Figure 4
Depletion of miR-126 increases sensitivity to chemotherapy treatment in mice carrying AE9a-induced AML. (A) AE9a, AE9a+miR-126, and miR-126KO+AE9a tertiary leukemic recipient mice were treated with phosphate-buffered saline (control; solid line), or a daily dose of 100 mg/kg Ara-C for 5 days along with a daily dose of 3 mg/kg doxorubicin during the first 3 days of Ara-C treatment (indicated by _D and dashed line; 5+3 regimen). Kaplan-Meier curves are shown. (B) Wright-Giemsa–stained PB and BM, and H&E-stained spleen and liver of the treated tertiary BMT recipient mice at the end point. Bars represents 25 μm for PB and BM; 100 μm for spleen and liver. (C) The relative viability of Kasumi-1 and primary leukemia cells of t(8;21) AML patients treated with serial dilutions of doxorubicin and Ara-C for 48 hours. (D) Lentivirus-mediated inhibition of miR-126 was detected by qRT-PCR. The data shown are the means of 3 biological replicates. **P < .01. Error bars represent standard deviation. IC50, half-maximum inhibitory concentration miRZip-Con, miRZip™ control lentivirus (System Biosciences); miRZip-126, miRZip™ anti-miR-126 lentivirus (System Biosciences, Mountain View, CA).
Figure 5
Figure 5
Comparison of expression levels between Pri HSPCs and CPs for the genes dysregulated in AE9a+miR-126 and miR-126KO+AE9a leukemic cells. Expression patterns between Pri HSPCs and CPs from the GSE24006 data set for the 57 AE9a+miR-126_High genes (A) and the 88 miR-126KO+AE9a_High genes (B) are shown. Expression data were mean centered, and the relative value for each sample is represented by a color, with red and green representing a high and low expression, respectively (scale is shown). (C) Within each gene set (ie, AE9a+miR-126_High, AE9a+miR-126_Low, miR-126KO+AE9a_High, or miR-126KO+AE9a_Low), the proportion of genes that are expressed at a significantly higher level in Pri HSPCs than in CPs (Pri HSPCs_High; blue), a significantly higher level in CPs than in Pri HSPCs (CPs_High; red), or a comparable level between Pri HSPCs and CPs (nonsignificant [NS]; green) is shown. Gene expression levels were compared between Pri HSPCs (including BM_HSC and BM_MPP samples) and CPs (including BM_CMP, BM_GMP, and BM_MEP samples) in the GSE24006 data set through significance analysis of microarrays, with a q value <0.05 and a false discovery rate <0.001 as criteria for statistical significance. CB_HSC and CB_MPP samples were not included in the significance analysis of microarrays due to their tissue differences from other BM samples. CB, core blood; CMP, common myeloid progenitor; CPs, committed progenitors; GMP, granulocyte/monocyte progenitor; HSC, hematopoietic stem cell; MEP, megakaryocyte/erythrocyte progenitor; MPP, multipotent progenitor; Pri HSPCs, primitive HSPCs.
Figure 6
Figure 6
Direct target genes of miR-126. (A) ERRFI1 and FZD7 3′UTR and the wild-type (_WT) and mutant (_Mut) sequences of mature miR-126 (left), and luciferase reporter and mutagenesis assay results (right). Whereas wild-type miR-126 significantly inhibits luciferase activity of the reporter plasmid carrying the 3′UTR of ERRFI1and FZD7, mutation in the miR-126 seed sequence rescues the inhibitory effect. (B) Western blot analysis of Errfi1, Fzd7, and Spred1 levels in AE9a, AE9a+miR-126, and miR-126KO+AE9a AML cells collected from quaternary BMT recipients (2 samples per group). β-Actin was used as an endogenous control. (C) Colony-forming/replating assays with cotransduction of MSCVneo-AE9a together with MSCV-PIG (Control), MSCV-PIG-Errfi1, or MSCV-PIG-Spred1 into normal mouse BM progenitor cells (left), or with transduction of MSCV-PIG (Control), MSCV-PIG-Errfi1, or MSCV-PIG-Spred1 into AE9a+miR-126 BM leukemia cells collected from tertiary BMT recipients (right). (D) Western blot analysis of phosphorylated (P)-MEK1 or P-ERK in human 293T cells transfected with MSCV-PIG (Control) or MSCV-PIG-miR-126 (miR-126) 48 hours posttransfection. Glyceraldehyde-3-phosphate dehydrogenase (GAPDH) was used as an endogenous control. (E) Colony-forming/replating assays with transduction of MSCV-PIG (Control) and MSCV-PIG-Fzd7 (Fzd7) into AE9a BM leukemia cells collected from tertiary BMT recipients. (F) Correlation between the expression levels of miR-126 and ERRFI1, SPRED1, or FZD7 in the set of 29 AML patients carrying t(8;21). All expression data were log2 transformed and mean centered. The correlation coefficient (r) and P values were detected by Pearson correlation, and the correlation regression lines were drawn with the linear regression algorithm. (G) Comparison of the OS in t(8;21) AML patients with higher or lower levels of ERRFI1, SPRED1, or FZD7 expression. Kaplan-Meier survival curves and P values (log-rank test) are shown.
Figure 7
Figure 7
The in vivo function of ERRFI1, SPRED1, and FZD7 in AE9a-mediated leukemogenesis. (A) Kaplan-Meier curves are shown for 3 groups of transplanted mice: MSCV-PIG (Control, n = 5), MSCV-PIG-Errfi1 (Errfi1, n = 4), and MSCV-PIG-Spred1 (Spred1, n = 5). The leukemic BM cells collected from tertiary miR-126+AE9a BMT recipients were used as the donor cells. The P values were calculated by log-rank test. (B) Kaplan-Meier curves are shown for 2 groups of transplanted mice: MSCV-PIG (Control, n = 5) and MSCV-PIG-Fzd7 (Fzd7, n = 6). The leukemia BM cells collected from tertiary AE9a BMT recipients were used as the donor cells. The P value was calculated by log-rank test. (C) Schematic model of target genes and signaling pathways activated in AE9a+miR-126 cells (left) and miR-126KO+AE9a cells (right).

References

    1. Lu J, Getz G, Miska EA, et al. MicroRNA expression profiles classify human cancers. Nature. 2005;435(7043):834–838. - PubMed
    1. He L, He X, Lim LP, et al. A microRNA component of the p53 tumour suppressor network. Nature. 2007;447(7148):1130–1134. - PMC - PubMed
    1. He L, Thomson JM, Hemann MT, et al. A microRNA polycistron as a potential human oncogene. Nature. 2005;435(7043):828–833. - PMC - PubMed
    1. Chen J, Odenike O, Rowley JD. Leukaemogenesis: more than mutant genes. Nat Rev Cancer. 2010;10(1):23–36. - PMC - PubMed
    1. Tavazoie SF, Alarcón C, Oskarsson T, et al. Endogenous human microRNAs that suppress breast cancer metastasis. Nature. 2008;451(7175):147–152. - PMC - PubMed

Publication types

MeSH terms