

Mining the Archives: A Cross-Platform Analysis of Gene Expression Profiles in Archival Formalin-Fixed Paraffin-Embedded Tissues
- PMID: 26361796
- PMCID: PMC4659533
- DOI: 10.1093/toxsci/kfv195
Mining the Archives: A Cross-Platform Analysis of Gene Expression Profiles in Archival Formalin-Fixed Paraffin-Embedded Tissues
Abstract
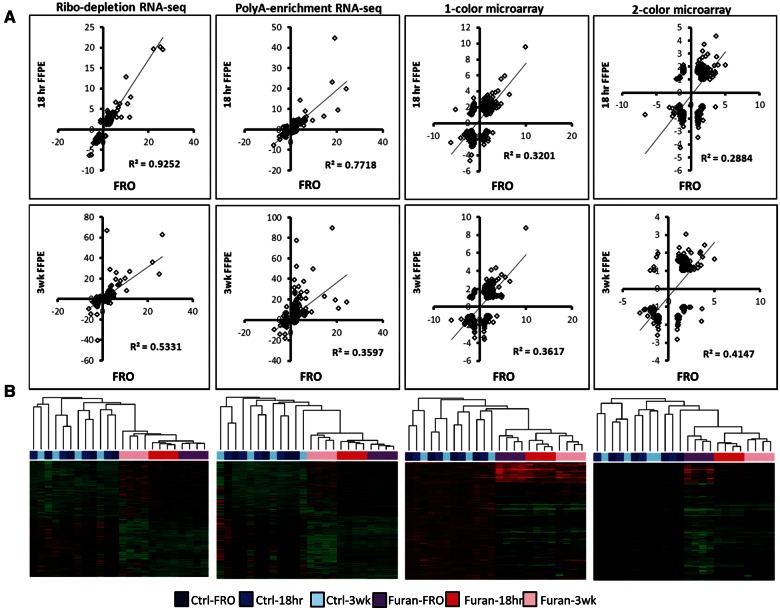
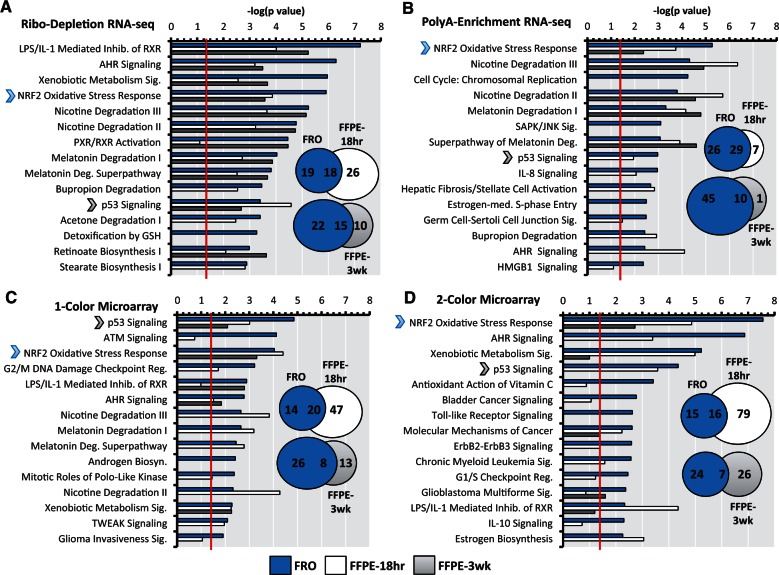
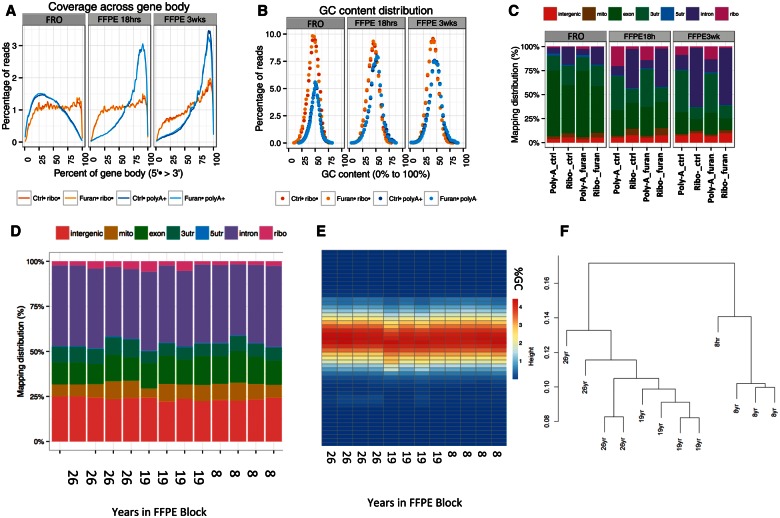
Formalin-fixed paraffin-embedded (FFPE) tissue samples represent a potentially invaluable resource for transcriptomic research. However, use of FFPE samples in genomic studies has been limited by technical challenges resulting from nucleic acid degradation. Here we evaluated gene expression profiles derived from fresh-frozen (FRO) and FFPE mouse liver tissues preserved in formalin for different amounts of time using 2 DNA microarray protocols and 2 whole-transcriptome sequencing (RNA-seq) library preparation methodologies. The ribo-depletion protocol outperformed the other methods by having the highest correlations of differentially expressed genes (DEGs), and best overlap of pathways, between FRO and FFPE groups. The effect of sample time in formalin (18 h or 3 weeks) on gene expression profiles indicated that test article treatment, not preservation method, was the main driver of gene expression profiles. Meta- and pathway analyses indicated that biological responses were generally consistent for 18 h and 3 week FFPE samples compared with FRO samples. However, clear erosion of signal intensity with time in formalin was evident, and DEG numbers differed by platform and preservation method. Lastly, we investigated the effect of time in paraffin on genomic profiles. Ribo-depletion RNA-seq analysis of 8-, 19-, and 26-year-old control blocks resulted in comparable quality metrics, including expected distributions of mapped reads to exonic, untranslated region, intronic, and ribosomal fractions of the transcriptome. Overall, our results indicate that FFPE samples are appropriate for use in genomic studies in which frozen samples are not available, and that ribo-depletion RNA-seq is the preferred method for this type of analysis in archival and long-aged FFPE samples.
Keywords: FFPE; RNA-seq; archival RNA; biorepositories; microarray; toxicogenomics.
© The Author 2015. Published by Oxford University Press on behalf of the Society of Toxicology.
Figures
Similar articles
-
Demodifying RNA for Transcriptomic Analyses of Archival Formalin-Fixed Paraffin-Embedded Samples.Toxicol Sci. 2018 Apr 1;162(2):535-547. doi: 10.1093/toxsci/kfx278. Toxicol Sci. 2018. PMID: 29228314 Free PMC article.
-
Editor's Highlight: Dose-Response Analysis of RNA-Seq Profiles in Archival Formalin-Fixed Paraffin-Embedded Samples.Toxicol Sci. 2016 Dec;154(2):202-213. doi: 10.1093/toxsci/kfw161. Epub 2016 Aug 25. Toxicol Sci. 2016. PMID: 27562560
-
Preparation of archival formalin-fixed paraffin-embedded mouse liver samples for use with the Agilent gene expression microarray platform.J Pharmacol Toxicol Methods. 2013 Sep-Oct;68(2):260-268. doi: 10.1016/j.vascn.2013.02.008. Epub 2013 Mar 1. J Pharmacol Toxicol Methods. 2013. PMID: 23458726
-
Formalin fixation in the '-omics' era: a primer for the surgeon-scientist.ANZ J Surg. 2012 Jun;82(6):395-402. doi: 10.1111/j.1445-2197.2012.06092.x. Epub 2012 May 9. ANZ J Surg. 2012. PMID: 22571596 Review.
-
Accuracy of Molecular Data Generated with FFPE Biospecimens: Lessons from the Literature.Cancer Res. 2015 Apr 15;75(8):1541-7. doi: 10.1158/0008-5472.CAN-14-2378. Epub 2015 Apr 2. Cancer Res. 2015. PMID: 25836717 Free PMC article. Review.
Cited by
-
Case study: Targeted RNA-sequencing of aged formalin-fixed paraffin-embedded samples for understanding chemical mode of action.Toxicol Rep. 2022 Apr 18;9:883-894. doi: 10.1016/j.toxrep.2022.04.012. eCollection 2022. Toxicol Rep. 2022. PMID: 36518475 Free PMC article.
-
Demodifying RNA for Transcriptomic Analyses of Archival Formalin-Fixed Paraffin-Embedded Samples.Toxicol Sci. 2018 Apr 1;162(2):535-547. doi: 10.1093/toxsci/kfx278. Toxicol Sci. 2018. PMID: 29228314 Free PMC article.
-
Recommended approaches in the application of toxicogenomics to derive points of departure for chemical risk assessment.Arch Toxicol. 2017 May;91(5):2045-2065. doi: 10.1007/s00204-016-1886-5. Epub 2016 Dec 7. Arch Toxicol. 2017. PMID: 27928627 Free PMC article.
-
Transcriptome Sequencing (RNAseq) Enables Utilization of Formalin-Fixed, Paraffin-Embedded Biopsies with Clear Cell Renal Cell Carcinoma for Exploration of Disease Biology and Biomarker Development.PLoS One. 2016 Feb 22;11(2):e0149743. doi: 10.1371/journal.pone.0149743. eCollection 2016. PLoS One. 2016. PMID: 26901863 Free PMC article.
-
Robust detection of immune transcripts in FFPE samples using targeted RNA sequencing.Oncotarget. 2017 Jan 10;8(2):3197-3205. doi: 10.18632/oncotarget.13691. Oncotarget. 2017. PMID: 27911273 Free PMC article.
References
-
- Auerbach S. S., Phadke D. P., Mav D., Holmgren S., Gao Y., Xie B., Shin J. H., Shah R. R., Merrick B. A., Tice R. R. (2014). RNA-Seq-based toxicogenomic assessment of fresh frozen and formalin-fixed tissues yields similar mechanistic insights. J. Appl. Toxicol. - PubMed
-
- Bass B. P., Engel K. B., Greytak S. R., Moore H. M. (2014). A review of preanalytical factors affecting molecular, protein, and morphological analysis of formalin-fixed, paraffin-embedded (FFPE) tissue: How well do you know your FFPE specimen? Arch . Pathol. Lab. Med. 138, 1520–1530. - PubMed
-
- Benjamini Y., Hochberg Y. (1995). Controlling the false discovery rate: A practical and powerful approach to multiple testing. J. R. Stat. Soc. Ser. B (Methodological) 57, 289–300.
-
- Black M., Parks B. B., Pluta L., Chu T. M., Allen B. C., Wolfinger R. D., Thomas R. S. (2014). Comparison of microarrays and RNA-seq for gene expression analyses of dose-response experiments. Toxicol Sci. 137, 385–403. - PubMed
-
- Bolstad B. M., Irizarry R. A., Åstrand M., Speed T. P. (2003). A comparison of normalization methods for high density oligonucleotide array data based on variance and bias. Bioinformatics 19, 185–193. - PubMed
Publication types
MeSH terms
Substances
Grants and funding
LinkOut - more resources
Full Text Sources
Other Literature Sources
Molecular Biology Databases
