. 2015 Sep 15;43(3):566-78.
doi: 10.1016/j.immuni.2015.06.025. Epub 2015 Sep 8.

Tissue-Specific Distribution of iNKT Cells Impacts Their Cytokine Response

Affiliations

Tissue-Specific Distribution of iNKT Cells Impacts Their Cytokine Response

You Jeong Lee et al. Immunity. .

Abstract

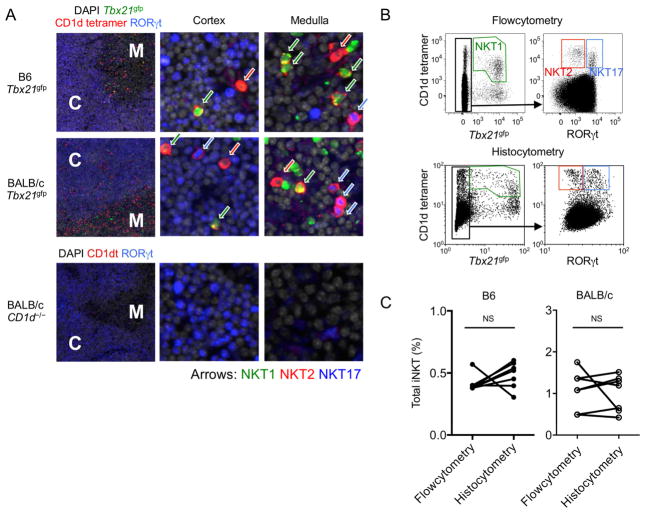
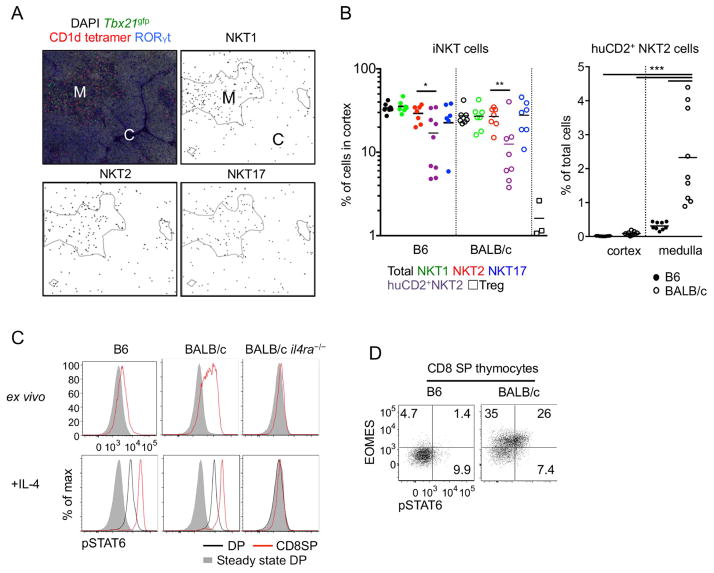
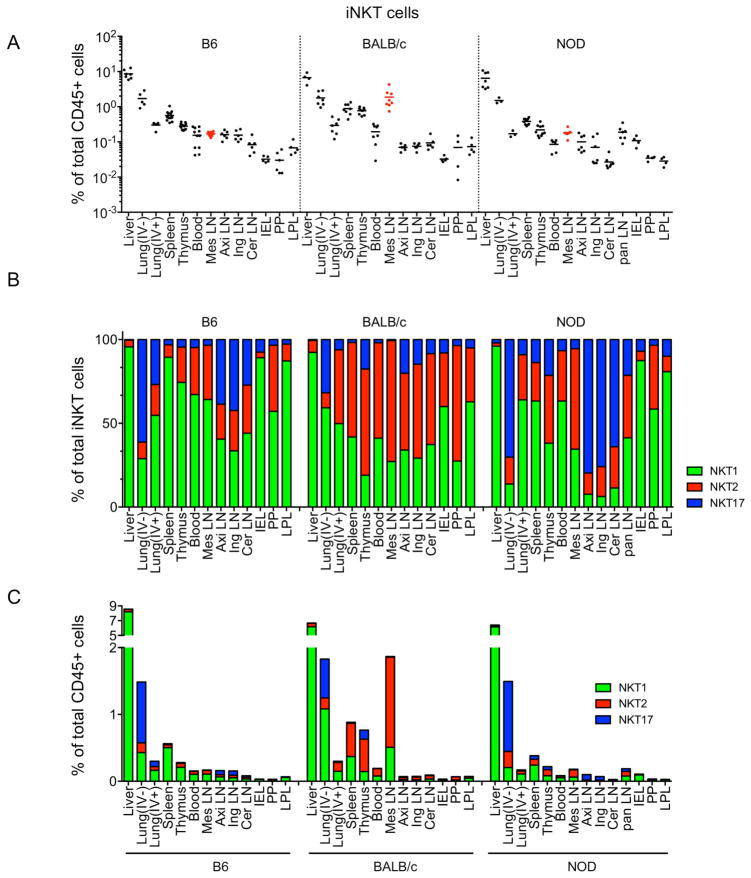
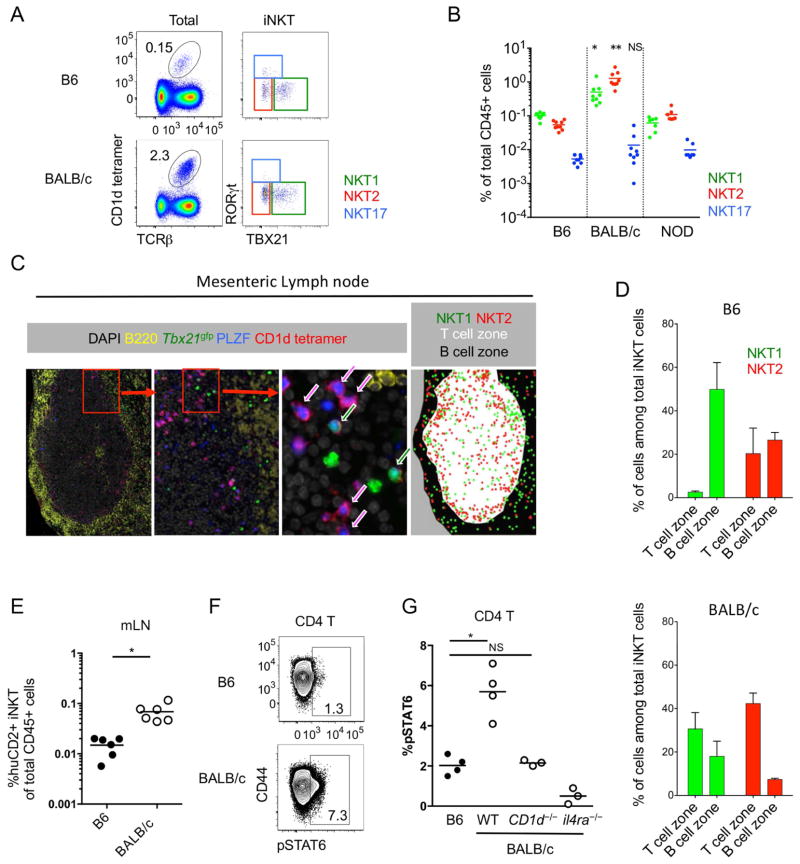
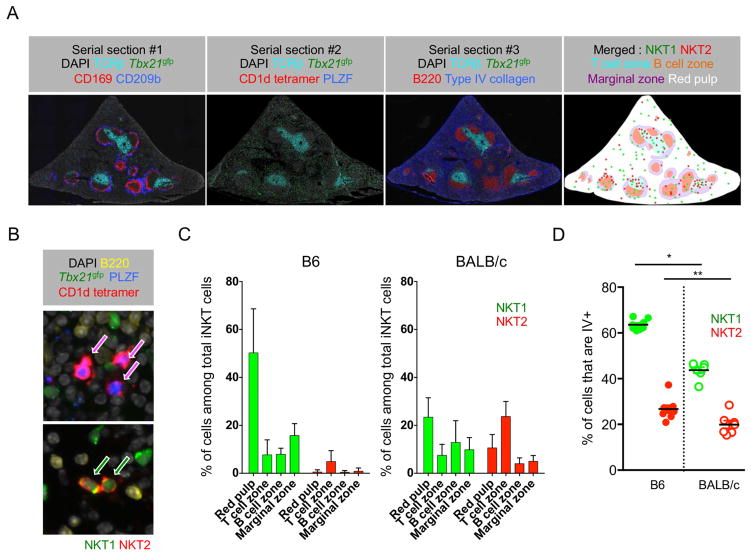
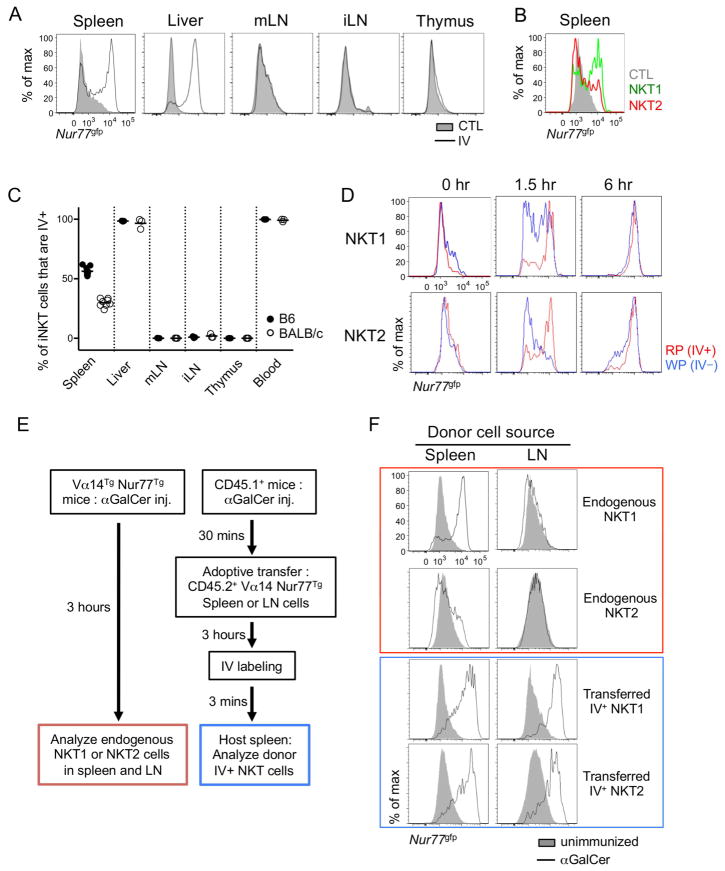
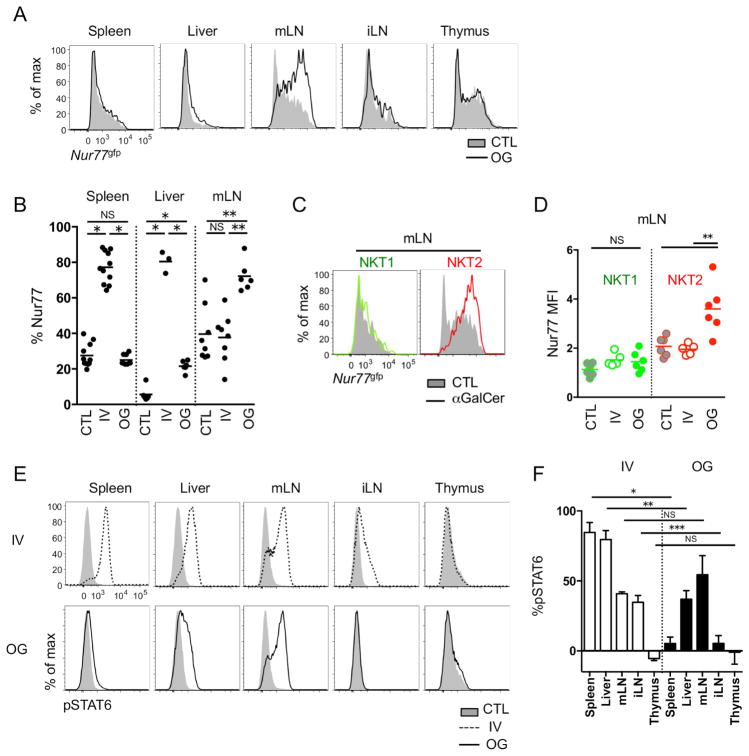
Three subsets of invariant natural killer T (iNKT) cells have been identified, NKT1, NKT2, and NKT17, which produce distinct cytokines when stimulated, but little is known about their localization. Here, we have defined the anatomic localization and systemic distribution of these subsets and measured their cytokine production. Thymic NKT2 cells that produced interleukin-4 (IL-4) at steady state were located in the medulla and conditioned medullary thymocytes. NKT2 cells were abundant in the mesenteric lymph node (LN) of BALB/c mice and produced IL-4 in the T cell zone that conditioned other lymphocytes. Intravenous injection of α-galactosylceramide activated NKT1 cells with vascular access, but not LN or thymic NKT cells, resulting in systemic interferon-γ and IL-4 production, while oral α-galactosylceramide activated NKT2 cells in the mesenteric LN, resulting in local IL-4 release. These findings indicate that the localization of iNKT cells governs their cytokine response both at steady state and upon activation.


Figures

Figure 1
Figure 1
iNKT cells localized with CD1d tetramer immunofluorescence and histocytometry. (A) Thymi of B6 and BALB/c Tbx21gfp mice and BALB/c Cd1d−/− mouse were stained with CD1d tetramer (red), RORγt (blue) and DAPI (grey) to visualize and distinguish NKT1, NKT2 and NKT17 cells. Arrows indicate NKT1 (green), NKT2 (red) and NKT17 (blue) cells. M; medulla, C; cortex. (B) Each thymic lobe from BALB/c Tbx21gfp mouse was subjected to histocytometric analysis after immunofluorescence staining or to flow cytometry analysis. Representative plots are shown among 4 different experiments. (C) Frequencies of total iNKT cells in thymus obtained from histocytometry and flow cytometry were compared in 7 different sections obtained from 4 different B6 or BALB/c Tbx21gfp mice. NS; not significant (paired t-test). See also Figure S1.
Figure 2
Figure 2
Medullary distribution of NKT2 cells determines localized pSTAT6 expression. (A) Thymi of BALB/c Tbx21gfp mice were stained with indicated markers and analyzed localization of each subset using histocytometric algorithm. Representative figures from at least 5 independent experiments are shown. M; medulla, C; cortex. (B) Cortical frequencies of thymic iNKT cells in B6 and BALB/c Tbx21gfp mice were analyzed (left) and frequencies of human CD2 (huCD2)+ NKT2 cells were calculated in thymic medulla (right). Pooled data from 7 to 9 different sections using 4 different mice are shown. *p=0.032, **p<0.016, ***p<0.0005 (unpaired t-test). Each dot represents an individual section and horizontal bars indicate mean values. (C) Histograms of pSTAT6 expression of double positive (DP) and CD8 single positive (SP) thymocytes are shown from indicated mouse strains with or without IL-4 (10ng/ml) treatment for 30 minutes ex vivo. Representative results of 5 independent experiments are shown. All histograms have the same axis scales. (D) CD8 SP thymocytes from B6 and BALB/c mouse were stained for Eomesodermin (Eomes) and pSTAT6. Numbers indicate frequency of cells in each quadrant and the two plots have the same axis scales. Representative results of five independent experiments are shown. See also Figure S2.
Figure 3
Figure 3
iNKT subsets have unique peripheral distribution, with some interstrain variation. Frequencies of total iNKT cells among total CD45+ cells (A), mean frequencies of iNKT subsets among total iNKT cells (B) and frequency of iNKT subsets among total CD45+ cells (C) are shown in indicated organs and strains of mice. IV−; intravenous antibody unlabeled, IV+; intravenous antibody labeled, Mes; Mesenteric, Axi; Axillary, Ing; Inguinal, Cer; Cervical, Pan; Pancreas, IEL; Intra-Epithelial Lymphocytes, PP; Peyer’s Patches, LPL; Lamina Propria Lymphocytes. Each symbol represents an individual mouse (n = 4 ~ 9) and horizontal bars indicate mean values. Pooled data from 8 independent experiments are shown. See also Figure S3.
Figure 4
Figure 4
NKT2 cells in BALB/c mLN produce IL-4 and condition lymphocytes at steady state. (A) Dot plots show total lymphocytes (left) or iNKT cells (right) from mesenteric lymph nodes (mLNs) of B6 (top) and BALB/c (botton) mice. Numbers indicated frequency of cells in adjacent gates and all plots have the same axis scales. Representative data from at least five independent experiments are shown. (B) Statistical analysis of frequencies of each iNKT subset among total lymphocytes in mLN of B6 (n = 9), BALB/c (n = 9) and NOD (n = 7) mice are shown. *p=0.0014, **p<0.0001 (one-way analysis of variance (ANOVA)). NS, not significant. Horizontal bars indicate mean values. (C) mLN of BALB/c Tbx21gfp mice was stained with indicated antibodies and CD1d tetramer. Arrows indicate NKT1 cells (green) and NKT2 cells (red). (D) Average frequencies of each NKT subset among total iNKT cells in T and B cell zones were analyzed in B6 (n = 3) and BALB/c (n = 3) mice. Error bars indicate standard deviation. (E) Human CD2 (huCD2) positive iNKT cells among total lymphocytes in mLN were analyzed in B6 (n = 6) and BALB/c (n = 6) mice. *p=0.0009 (unpaired t-test). Each dot represents an individual mouse and horizontal bars indicate mean values. (F) Flow cytometry plots show pSTAT6 expression of CD4 T cells in mLN. Numbers indicated percentage of cells in adjacent gates and the two plots have the same axis scales. (G) Statistical analysis of pSTAT6 expressing CD4 T cells in B6 and BALB/c mice (wild type (WT), CD1d−/− and il4ra−/−) (n = 3 – 4) is shown. *p=0.001 (unpaired t-test). NS, not significant. Each dot represents an individual mouse and horizontal bars indicate mean values. See also Figure S4.
Figure 5
Figure 5
Splenic NKT1 cells are mainly localized in red pulp, while NKT2 cells are in T cell zone. (A) Five micron serial sections of spleen of BALB/c Tbx21gfp mice were stained with indicated combinations of antibodies and CD1d tetramer. A merged image in far right shows combined boundaries of image #1 and image #3 with green and red dots representing NKT1 and NKT2 cells from image #2. Representative images of four independent experiments are shown. (B) Representative images of NKT2 cells in T cell zone (top) and NKT1 cells in red pulp (red) are shown. (C) Bar graphs show average frequencies of iNKT subsets in each anatomic region among total iNKT cells in B6 (n = 4) and BALB/c (n = 7) mice. Error bars show standard deviation. (D) Frequencies of splenic NKT1 and NKT2 cells labeled with intravenous (IV) anti-CD45 staining are shown in B6 (n = 8) and BALB/c (n = 7) mice. *p<0.0001, **p=0.015 (unpaired t-test). Each dot represents an individual mouse and horizontal bars indicate mean values. See also Figure S5.
Figure 6
Figure 6
Vascular localized NKT1 cells respond rapidly to αGalCer challenge. (A) BALB/c Nur77gfp mouse was intravenously (IV) injected with αGalCer and indicated organs were collected 3 hours later. Overlaid histograms show Nur77gfp expression in total iNKT cells from αGalCer IV injected and uninjected control (CTL) mice. Representative histograms of at least five independent experiments are shown. All histograms have the same axis scales. mLN, mesenteric lymph node; iLN, inguinal lymph node. (B) Overlaid histogram shows Nur77gfp expression in NKT1 (green) and NKT2 (red) cells 3 hours after αGalCer IV injection in BALB/c mice. Representative histogram of at least five independent experiments is shown. (C) Percentages of iNKT cells labeled with IV anti-CD45 antibody in corresponding organs of B6 (n = 3 ~ 8) and BALB/c (n = 3 ~ 7) mice are shown. Each dot represents an individual mouse and horizontal bars indicate mean values. (D) BALB/c Nur77gfp mice were IV injected with αGalCer and labeled with IV ant-CD45 antibody after indicated time periods. Three minutes later, mice were sacrificed and analyzed for Nur77gfp expressions. All histograms have the same axis scales. Representative results of three independent experiments are shown. RP, red pulp; WP, white pulp. (E) Schematic representation shows experimental procedure for (F). Vα14Tg Nur77gfp (left) or CD45.1+ congenic B6 (right) mice were IV injected with αGalCer and the latters were transferred with LN cells of Vα14Tg Nur77gfp mice. Three hours later, mice were sacrificed after CD45.1+ congenic B6 recipient mice were labeled with IV anti-CD45 antibody for 3 minutes. (F) Histograms show Nur77 expression of NKT1 and NKT2 cells of spleen and LN of Vα14Tg Nur77gfp mice (red) and donor iNKT cells in splenic red pulp of host mice immunized (blue). Filled histogram shows Nur77 expression of NKT1 and NKT2 cells in unimmunized Vα14Tg Nur77gfp mice. All histograms have the same axis scales. Representative data of three mice are shown. See also Figure S6.
Figure 7
Figure 7
mLN NKT2 cells respond to oral administration of αGalCer. (A) BALB/c Nur77gfp mice were oral gavaged (OG) with 2μg of αGalCer and Nur77gfp expressions in total iNKT cells were analyzed after 24 hours. All histograms have the same axis scales. Representative histograms of at least five independent experiments are shown. mLN, mesenteric lymph node; iLN, inguinal lymph node. (B) Statistical analyses show frequencies of iNKT cells expressing Nur77gfp in spleen, liver and mLN of unimmunized control (CTL), intravenously (IV) αGalCer injected and oral gavaged (OG) BALB/c mice (n = 3 ~ 9). *p<0.0001, **p=0.0002 (one-way analysis of variance (ANOVA)). NS, not significant. Each dot represents an individual mouse and horizontal bars indicate mean values. (C and D) Overlay histograms show Nur77gfp expressions in NKT1 (green) and NKT2 (red) cells in BALB/c mice 24 hours after αGalCer oral gavage. Representative histograms of three independent experiments (C) and its statistical analysis (n = 6) (D) are shown. All histograms have the same axis scales. **p=0.001 (unpaired t-test). NS, not significant. Each dot represents an individual mouse and horizontal bars indicate mean values. (E) Histograms show pSTAT6 expression in CD4 T cells 3 hours after IV injection (IV, top) or 24 hours after oral gavage (OG, bottom) of αGalCer. All histograms have the same axis scales. (F) Bar graphs show average percent point increases of pSTAT6 expression in CD4 T cells after IV injection or OG of αGalCer in BALB/c mice (n = 3 ~ 6). *p<0.0001, **p=0.0014, ***p=0.0033 (unpaired t-test). NS, not significant. Error bars show standard deviation. See also Figure S7.

References

    1. An D, Oh SF, Olszak T, Neves JF, Avci FY, Erturk-Hasdemir D, Lu X, Zeissig S, Blumberg RS, Kasper DL. Sphingolipids from a symbiotic microbe regulate homeostasis of host intestinal natural killer T cells. Cell. 2014;156:123–133. - PMC - PubMed
    1. Anderson KG, Mayer-Barber K, Sung H, Beura L, James BR, Taylor JJ, Qunaj L, Griffith TS, Vezys V, Barber DL, Masopust D. Intravascular staining for discrimination of vascular and tissue leukocytes. Nature protocols. 2014;9:209–222. - PMC - PubMed
    1. Barral P, Polzella P, Bruckbauer A, van Rooijen N, Besra GS, Cerundolo V, Batista FD. CD169(+) macrophages present lipid antigens to mediate early activation of iNKT cells in lymph nodes. Nature immunology. 2010;11:303–312. - PMC - PubMed
    1. Barral P, Sanchez-Nino MD, van Rooijen N, Cerundolo V, Batista FD. The location of splenic NKT cells favours their rapid activation by blood-borne antigen. The EMBO journal. 2012;31:2378–2390. - PMC - PubMed
    1. Bendelac A, Savage PB, Teyton L. The biology of NKT cells. Annual review of immunology. 2007;25:297–336. - PubMed

Publication types

MeSH terms