. 2015 Sep;27(9):2616-36.
doi: 10.1105/tpc.15.00588. Epub 2015 Sep 11.

Arabidopsis SEIPIN Proteins Modulate Triacylglycerol Accumulation and Influence Lipid Droplet Proliferation

Affiliations

Arabidopsis SEIPIN Proteins Modulate Triacylglycerol Accumulation and Influence Lipid Droplet Proliferation

Yingqi Cai et al. Plant Cell. 2015 Sep.

Abstract

The lipodystrophy protein SEIPIN is important for lipid droplet (LD) biogenesis in human and yeast cells. In contrast with the single SEIPIN genes in humans and yeast, there are three SEIPIN homologs in Arabidopsis thaliana, designated SEIPIN1, SEIPIN2, and SEIPIN3. Essentially nothing is known about the functions of SEIPIN homologs in plants. Here, a yeast (Saccharomyces cerevisiae) SEIPIN deletion mutant strain and a plant (Nicotiana benthamiana) transient expression system were used to test the ability of Arabidopsis SEIPINs to influence LD morphology. In both species, expression of SEIPIN1 promoted accumulation of large-sized lipid droplets, while expression of SEIPIN2 and especially SEIPIN3 promoted small LDs. Arabidopsis SEIPINs increased triacylglycerol levels and altered composition. In tobacco, endoplasmic reticulum (ER)-localized SEIPINs reorganized the normal, reticulated ER structure into discrete ER domains that colocalized with LDs. N-terminal deletions and swapping experiments of SEIPIN1 and 3 revealed that this region of SEIPIN determines LD size. Ectopic overexpression of SEIPIN1 in Arabidopsis resulted in increased numbers of large LDs in leaves, as well as in seeds, and increased seed oil content by up to 10% over wild-type seeds. By contrast, RNAi suppression of SEIPIN1 resulted in smaller seeds and, as a consequence, a reduction in the amount of oil per seed compared with the wild type. Overall, our results indicate that Arabidopsis SEIPINs are part of a conserved LD biogenesis machinery in eukaryotes and that in plants these proteins may have evolved specialized roles in the storage of neutral lipids by differentially modulating the number and sizes of lipid droplets.


Figures

Figure 1.
Figure 1.
Common Motifs and Phylogenetic Analysis of SEIPIN Proteins in Different Species. (A) Common motifs shared between SEIPIN homologs in yeast, human, and Arabidopsis. Motif organization was generated by Multiple Em for Motif Elicitation (MEME) (Bailey et al., 2009). The P value gives the probability of a random protein having the same motif. Motifs with P values of <0.0001 are considered to be significant. The minimum width and maximum width of motifs were set at 20 and 300 amino acids, respectively. The minimum number of sites was set at 5. (B) Common motifs shared between the three Arabidopsis SEIPIN homologs. The minimum width and maximum width of motifs were set as 10 and 300 amino acids, respectively. The minimum number of sites was set at 2. (C) Phylogenetic analysis of SEIPIN proteins in plants. Homologs of the Arabidopsis SEIPINs were identified in diverse plant species, as well as algae, then phylogenetic analysis was performed as described (see Methods for details). The Arabidopsis SEIPINs are in red font, and the two monophyletic groups are circled.
Figure 2.
Figure 2.
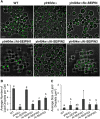
Complementation Tests for LD Phenotypes in the Yeast SEIPIN Deletion Mutant (ylr404w∆) by Arabidopsis SEIPINs Compared with Functional Complementation with Yeast SEIPIN (Sc-SEIPIN). Wild-type (WT) and ylr404w∆ were transformed with empty plasmid pRS315. (A) LD phenotypes were assessed in projections by confocal laser scanning microscopy of different yeast strains. LDs are stained with BODIPY 493/503 and shown in a false color green. Bar = 5 µm. (B) Numbers of LDs were quantified in different yeast strains (three lines for each strain, with more than 150 cells analyzed per replicate; means with different letters are significantly different determined by one-way ANOVA with Tukey’s post-test; P < 0.05). sd (n = 3). (C) Average sizes of LD in different yeast strains (30 cells analyzed for each strain; means with different letters are significantly different determined by one-way ANOVA with Tukey’s post-test; P < 0.05). sd (n = 30).
Figure 3.
Figure 3.
Amount and Composition of TAGs in Yeast SEIPIN Deletion Mutant (ylr404w∆) and ylr404w∆ Expressing Yeast or Arabidopsis SEIPINs. Different letters indicate significant difference at P < 0.05, as determined by one-way ANOVA with Tukey’s post-test. Values are averages, and error bars represent sd (n = 3). FW, fresh weight. (A) Amount of TAG in different yeast strains. (B) and (C) Composition of TAG in different yeast strains.
Figure 4.
Figure 4.
Expression of Arabidopsis SEIPINs in Tobacco Leaves Increases the Number of LDs and Influences Their Size. (A) Representative confocal images of LDs (BODIPY 493/503 fluorescence, false color green) in tobacco leaves. Red color shows chloroplast autofluorescence. Images were collected at the same magnification and show a 134.82 × 134.82-μm field of the leaf mesophyll. Images are projections of Z-stacks of 22 optical sections taken 0.466 μm apart. Mock infection was infiltrated with media only; P19 was used as a viral suppressor of transgene silencing and was coexpressed in all SEIPIN treatments. Bar = 20 µm; scale bar (zoom in image) = 5 µm. (B) LD counts by size (average diameter) in tobacco leaves expressing Arabidopsis SEIPINs. Values are averages and sd of three individual experiments (with three images from each replicate). Different letters indicate significant difference at P < 0.05, as determined by one-way ANOVA with Tukey’s post-test. Small LDs, diameters <1.5 μm; intermediate LDs, diameters between 1.5 and 2.5 μm; large LDs, diameters larger than 2.5 μm.
Figure 5.
Figure 5.
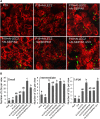
Transient Coexpression of Arabidopsis SEIPINs and LEC2 in Tobacco Leaves. (A) Representative confocal images of LDs in tobacco leaves. Red color shows chloroplast autofluorescence. Images were collected at same magnification and show a 134.82 × 134.82-μm field of the leaf mesophyll. Images are projections of Z-stacks of 22 optical sections taken 0.466 μm apart. P19 was used as a viral suppressor of transgene silencing in all experiments. Bar = 20 µm. (B) LD counts by size (average diameter) in tobacco leaves expressing Arabidopsis SEIPINs and LEC2. Values are averages and sd of three individual experiments (with three images from each replicate). Different letters indicate significant difference at P < 0.05, as determined by one-way ANOVA with Tukey’s post-test. Small LDs, diameters <1.5 μm; intermediate LDs, diameters between 1.5 and 2.5 μm; large LDs, diameters larger than 2.5 μm.
Figure 6.
Figure 6.
Analysis of TAG and Fatty Acids in Neutral Lipids of Tobacco Leaves Expressing Arabidopsis SEIPINs and/or LEC2. Values are averages and sd of three individual infiltration experiments. Different letters indicate significant difference at P < 0.05, as determined by one-way ANOVA with Tukey’s post-test. (A) Total TAG in tobacco leaves analyzed by TLC and densitometric scanning. (B) Total amount of neutral lipids on a fatty acid basis in tobacco leaves. DW, dry weight. (C) to (E) Fatty acid compositions in tobacco leaves expressing individual Arabidopsis SEIPINs (C), combinations of Arabidopsis SEIPINs (D), and coexpressing Arabidopsis SEIPINs and LEC2 (E).
Figure 7.
Figure 7.
Colocalization of LD, ER, and Arabidopsis SEIPINs in Tobacco Leaves. Arabidopsis SEIPINs, ER, and LDs were visualized by fluorescence patterns of N-terminal GFP-tagged SEIPINs, CFP-HDEL, and Nile Red, respectively. CFP-HDEL consists of CFP linked to an N-terminal Kar2 signal sequence and C-terminal HDEL ER retrieval signal (Szymanski et al., 2007). All individual channels are shown in gray-scale. GFP, CFP-HDEL, Nile Red, and colocalization are shown in green, blue, yellow, and white, respectively, in the combined channel. Images are all Z-stack projections, and the thickness of stacks varies from 8 to 12 μm to include all CFP signal, GFP signal, and LDs in mesophyll in particular areas. The optical sections were taken 0.466 μm apart. P19 was used as a viral suppressor of transgene silencing in all samples. Arrowheads indicate apparent colocalization of ER, LDs, and GFP-tagged SEIPINs. The images in the last column are 3D projections of surface rendering, high magnified (zoom in) Z-stack images of selected regions of cells showing the colocalization of LDs, ER, and GFP-tagged SEIPINs. Supplemental Movies 1 to 5 are associated with the 3D projections in the last column. Bars in the last column are all 5 μm. Bar (first four columns) = 20 µm. The inset (bar = 5 µm) in the merged image in the top row represents a higher magnification image of a portion of the cell as indicated.
Figure 8.
Figure 8.
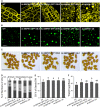
N-Terminal Ends of Arabidopsis SEIPINs Are Involved in Modulating the Size of LDs. (A) Diagram of N-terminal domain swaps and truncations in At-SEIPIN1, At-SEIPIN3, and Sc-SEIPIN. Black arrowheads indicate the relative position on wild-type At-SEIPIN1, At-SEIPIN3, and Sc-SEIPIN where domain swaps/deletions were introduced. Red box frames indicate the first putative TMD in At-SEIPIN1, At-SEIPIN3, and Sc-SEIPIN. (B) Representative confocal images of LDs (Nile Red, yellow) in tobacco leaves expressing domain-swapped/truncated Arabidopsis and yeast SEIPINs. Red color shows chloroplast autofluorescence. Images are Z-stack projections collected as described in Figures 4 and 5. Bar = 20 µm. (C) LD counts by size (average diameter) in tobacco leaves expressing domain-swapped/truncated Arabidopsis and yeast SEIPINs. Values are averages and sd of three individual experiments (with three images from each replicate). Different letters indicate significant difference at P < 0.05, as determined by one-way ANOVA with Tukey’s post-test. Small LDs, diameters <1.5 µm; intermediate LDs, diameters between 1.5 and 2.5 µm; large LDs, diameters larger than 2.5 µm.
Figure 9.
Figure 9.
Stable Expression of Arabidopsis SEIPINs Increases the Number and Size of LDs in Arabidopsis Leaves. (A) Representative confocal images of LDs (Nile Red, yellow) in Arabidopsis leaves. SEIPIN1-GFP OE-A, B, and C are three transgenic events. Red color shows chloroplast autofluorescence. Images were collected at the same magnification and show a 134.82 × 134.82-µm field of the leaf mesophyll. Images are projections of Z-stacks of 30 optical sections taken 0.466 µm apart. Bar = 20 µm. (B) to (D) LD counts by size (average diameter) in Arabidopsis leaves expressing Arabidopsis SEIPINs. Values are averages and sd of three biological replicates (three Z-stack image series from each biological replicate). Different letters indicate significant difference at P < 0.05, as determined by one-way ANOVA with Tukey’s post-test. (B) Number of small LDs with diameters <1.5 µm. (C) Number of intermediate LDs with diameters between 1.5 and 2 µm. (D) Number of large LDs with diameters larger than 2 µm.
Figure 10.
Figure 10.
Overexpression of Arabidopsis SEIPINs in Arabidopsis Increases the Size of LDs and Oil Content in Mature Seeds. (A) Representative confocal images of LDs (Nile Red, yellow) in Arabidopsis seeds. SEIPIN1-GFP OE-A, B, and C are three transgenic events. Images were collected at the same magnification and show a 44.94 × 44.94-µm field of the embryo. Bar = 5 µm. (B) Isolated LDs (BODIPY 493/503 fluorescence, false color green) from mature Arabidopsis seeds overexpressing Arabidopsis SEIPIN1. Images are Z-stack projections including all LDs in a 134.82 × 134.82-µm field. Bar = 20 µm. (C) Mature Arabidopsis seeds overexpressing SEIPIN1. Bar = 1 mm. (D) Percentage of numbers of different sized LDs isolated from the seeds of wild-type Arabidopsis and SEIPIN1 overexpressing lines. Small LDs, diameters <1.5 µm; intermediate LDs, diameters between 1.5 and 3 µm; large LDs, diameters larger than 3 µm. Values are averages and sd of three individual experiments (more than 100 LDs were measured for each sample in each individual experiment). Different letters indicate significant difference at P < 0.05, as determined by one-way ANOVA with Tukey’s post-test. (E) Percentage of oil in dry seeds. Values are averages and sd of three individual measurements on 50 mg/sample. Seeds were harvested from plants grown under identical conditions, and trends of increased oil content in SEIPIN transgenics were observed in three independent growth trials. Different letters indicate significant difference at P < 0.05, as determined by one-way ANOVA with Tukey’s post-test. (F) Average seed weight. Values are averages and sd of seeds harvested from six individual plants. Different letters indicate significant difference at P < 0.05, as determined by one-way ANOVA with Tukey’s post-test.
Figure 11.
Figure 11.
Downregulation of SEIPIN1 in Arabidopsis by RNAi Decreases the Seed Size and Oil Content per Seed. Six RNAi lines presented here are from three different transgenic events. seipin1-1-3, seipin1-1-4, and seipin1-1-6 are three lines from the same transgenic event, seipin1-1. seipin1-3-7 is from transgenic event seipin1-3. seipin1-7-2 and seipin1-7-7 are two lines from the same transgenic event, seipin1-7. (A) Representative confocal images of LDs (Nile Red, yellow) in Arabidopsis seeds. Bar = 5 µm. (B) Mature Arabidopsis seeds with down-regulated SEIPIN1. Bar = 1 mm. (C) Relative expression level of SEIPIN1 in RNAi lines assessed by RT-qPCR. Values are averages and sd of three replicates. Different letters indicate significant difference at P < 0.05, as determined by one-way ANOVA with Tukey’s post-test. (D) Average seed weight. Seeds were harvested from plants grown under identical conditions, and trends of decreased seed weight were observed in all six RNAi lines. Values are averages and sd of three individual measurements of 100 seeds/replicate. Different letters indicate significant difference at P < 0.05, as determined by one-way ANOVA with Tukey’s post-test. (E) Oil percentage of seed dry weight. Values are averages and sd of three individual measurements on 50 mg/sample. Different letters indicate significant difference at P < 0.05, as determined by one-way ANOVA with Tukey’s post-test. (F) Oil content per seed. Values are calculated by multiplying oil percentage of seeds’ dry weight by average seed weight.

References

    1. Andrianov V., Borisjuk N., Pogrebnyak N., Brinker A., Dixon J., Spitsin S., Flynn J., Matyszczuk P., Andryszak K., Laurelli M., Golovkin M., Koprowski H. (2010). Tobacco as a production platform for biofuel: overexpression of Arabidopsis DGAT and LEC2 genes increases accumulation and shifts the composition of lipids in green biomass. Plant Biotechnol. J. 8: 277–287. - PubMed
    1. Atanassov I.I., Atanassov I.I., Etchells J.P., Turner S.R. (2009). A simple, flexible and efficient PCR-fusion/Gateway cloning procedure for gene fusion, site-directed mutagenesis, short sequence insertion and domain deletions and swaps. Plant Methods 5: 14. - PMC - PubMed
    1. Bailey T.L., Boden M., Buske F.A., Frith M., Grant C.E., Clementi L., Ren J., Li W.W., Noble W.S. (2009). MEME SUITE: tools for motif discovery and searching. Nucleic Acids Res. 37: W202–W208. - PMC - PubMed
    1. Bartz R., Li W.H., Venables B., Zehmer J.K., Roth M.R., Welti R., Anderson R.G., Liu P., Chapman K.D. (2007). Lipidomics reveals that adiposomes store ether lipids and mediate phospholipid traffic. J. Lipid Res. 48: 837–847. - PubMed
    1. Baud S., Lepiniec L. (2010). Physiological and developmental regulation of seed oil production. Prog. Lipid Res. 49: 235–249. - PubMed

Publication types

MeSH terms

Associated data