. 2015 Nov 6;290(45):27021-27039.
doi: 10.1074/jbc.M115.659250. Epub 2015 Sep 11.

Agonism, Antagonism, and Inverse Agonism Bias at the Ghrelin Receptor Signaling

Affiliations

Agonism, Antagonism, and Inverse Agonism Bias at the Ghrelin Receptor Signaling

Céline M'Kadmi et al. J Biol Chem. .

Abstract

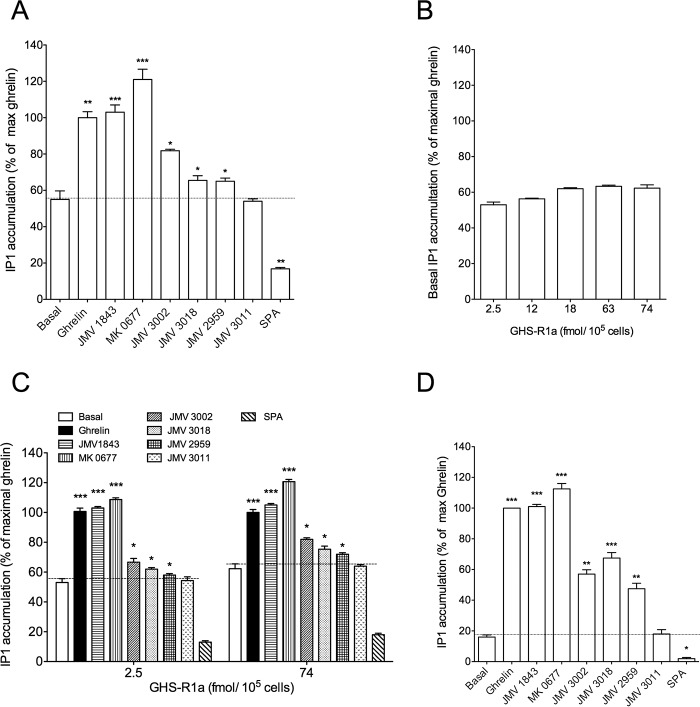
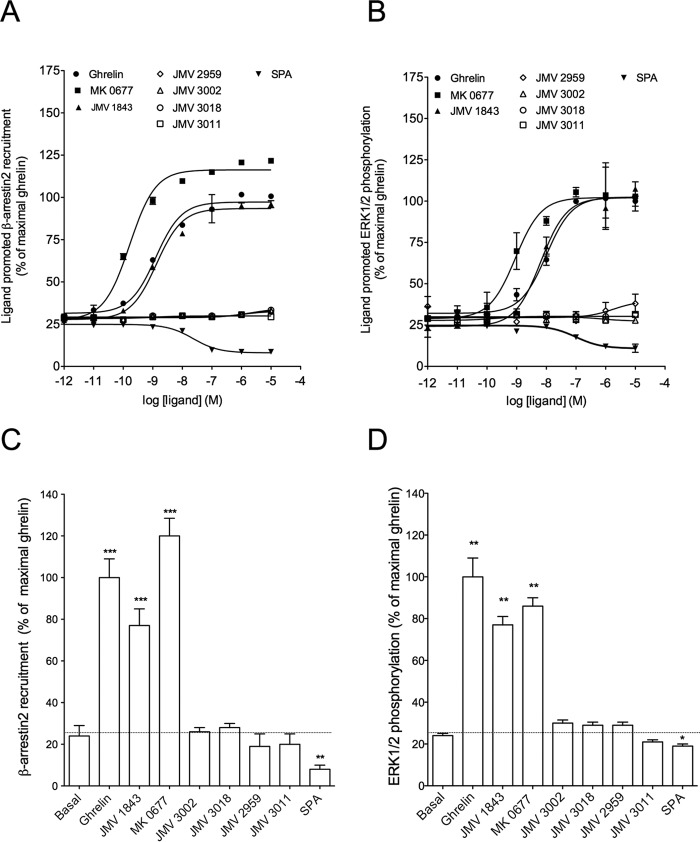
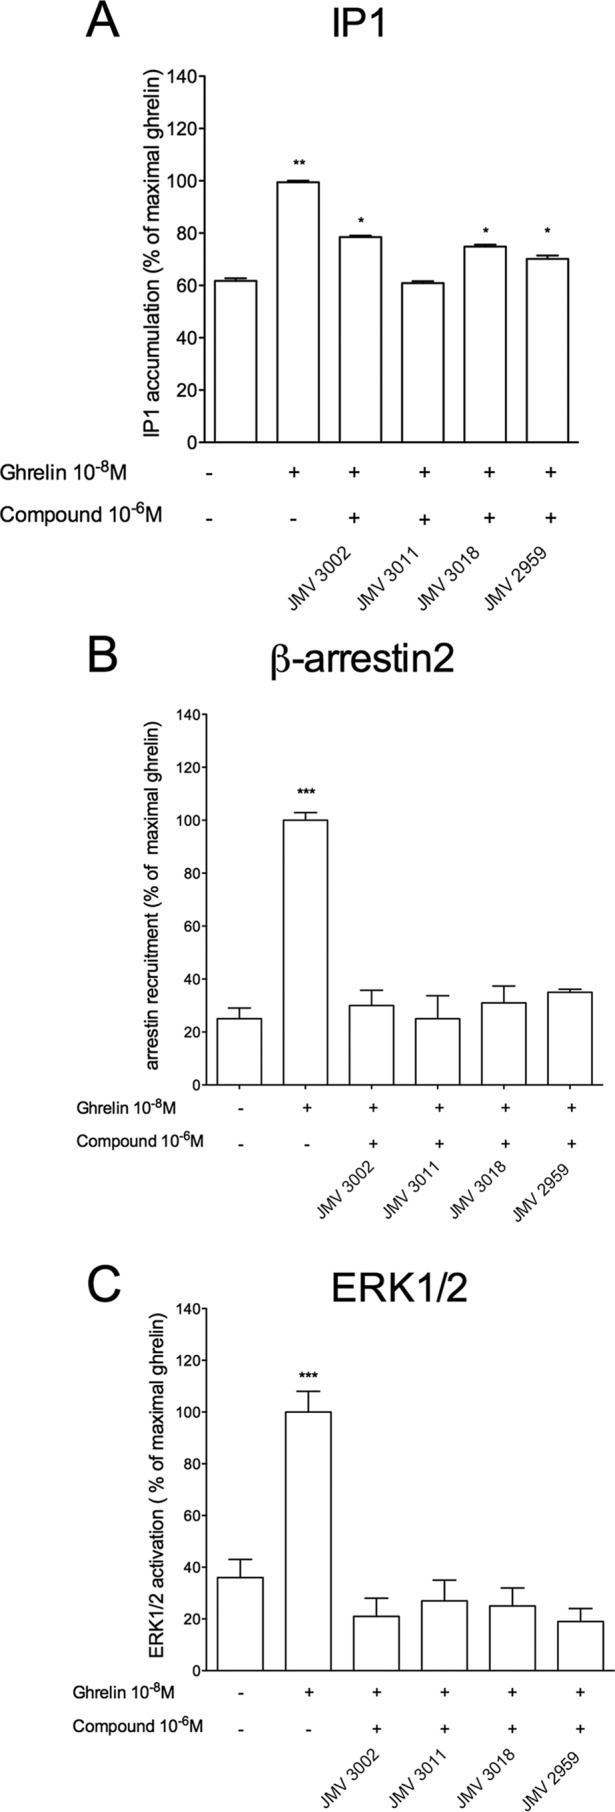
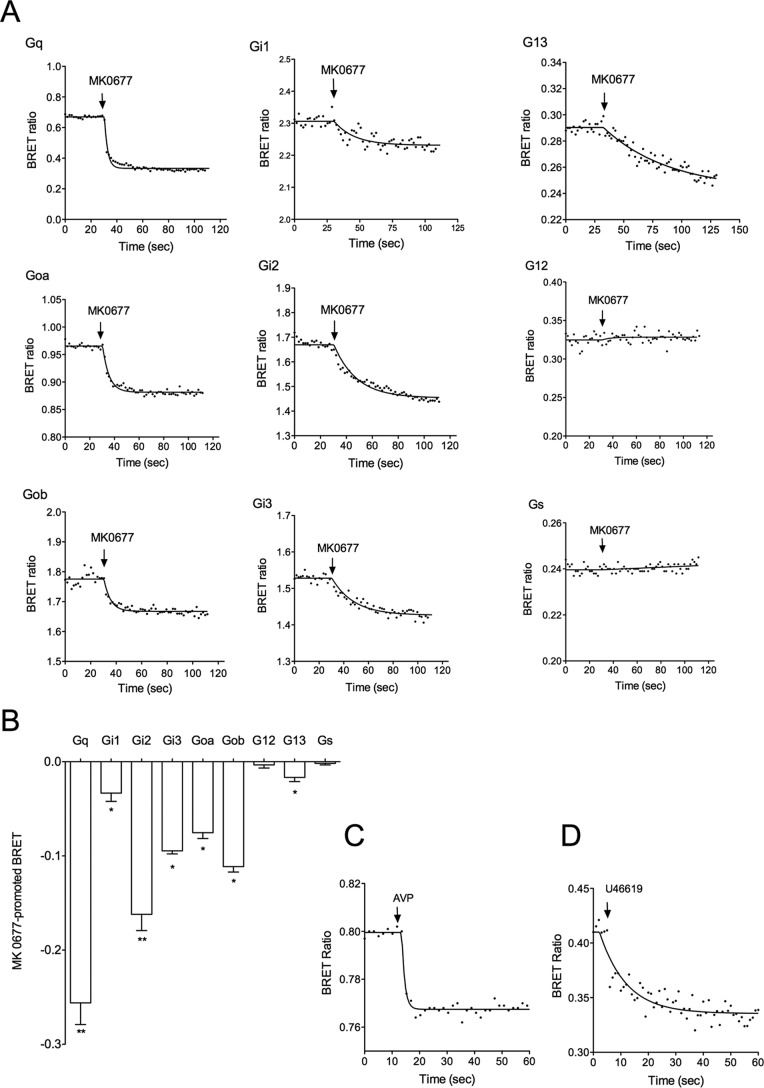
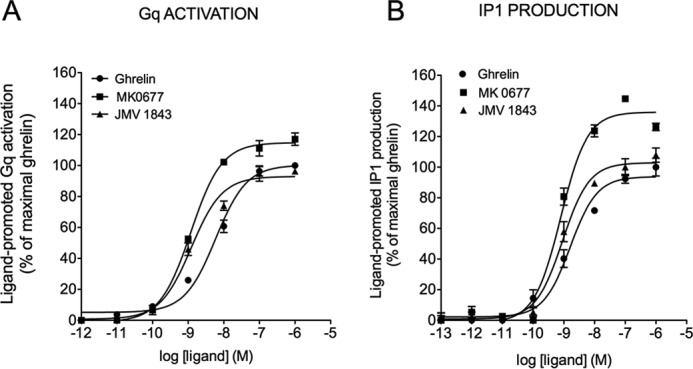
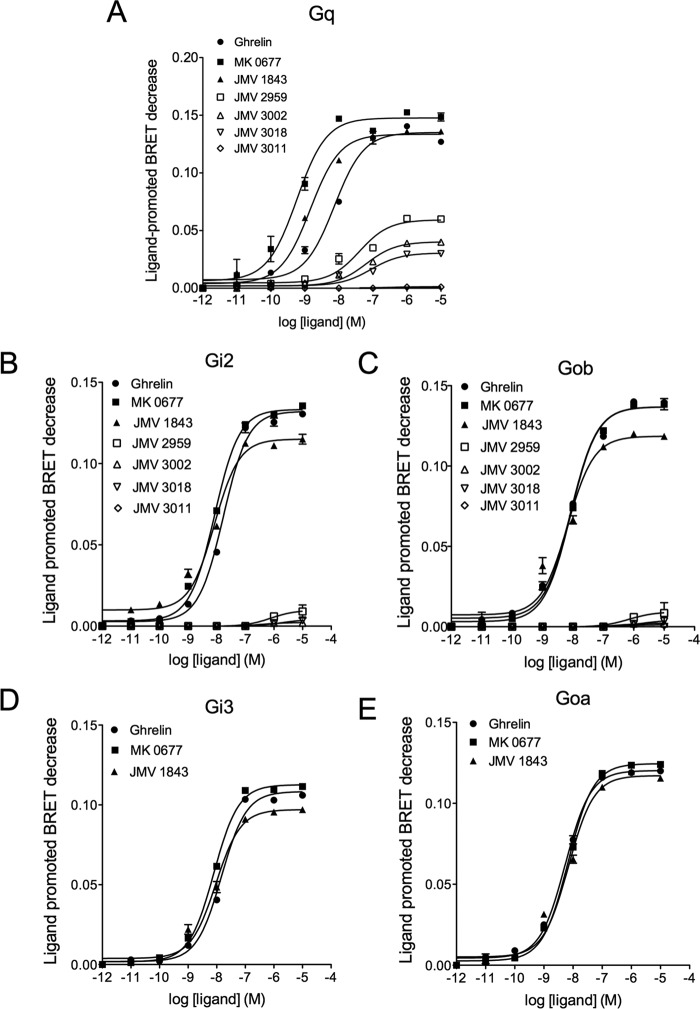
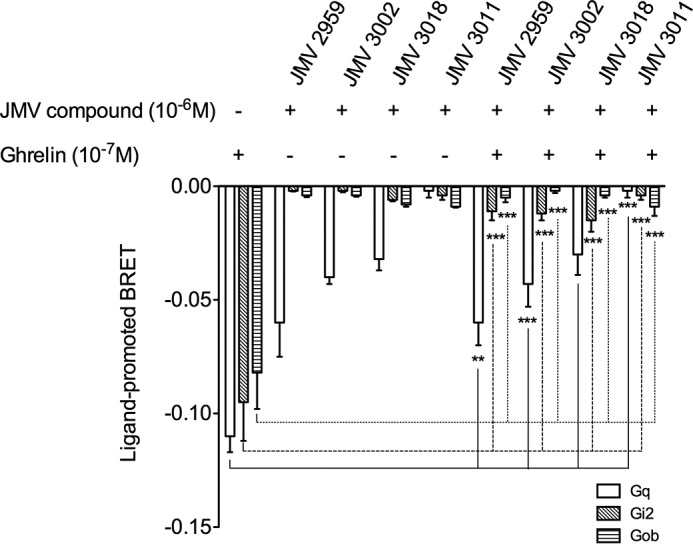
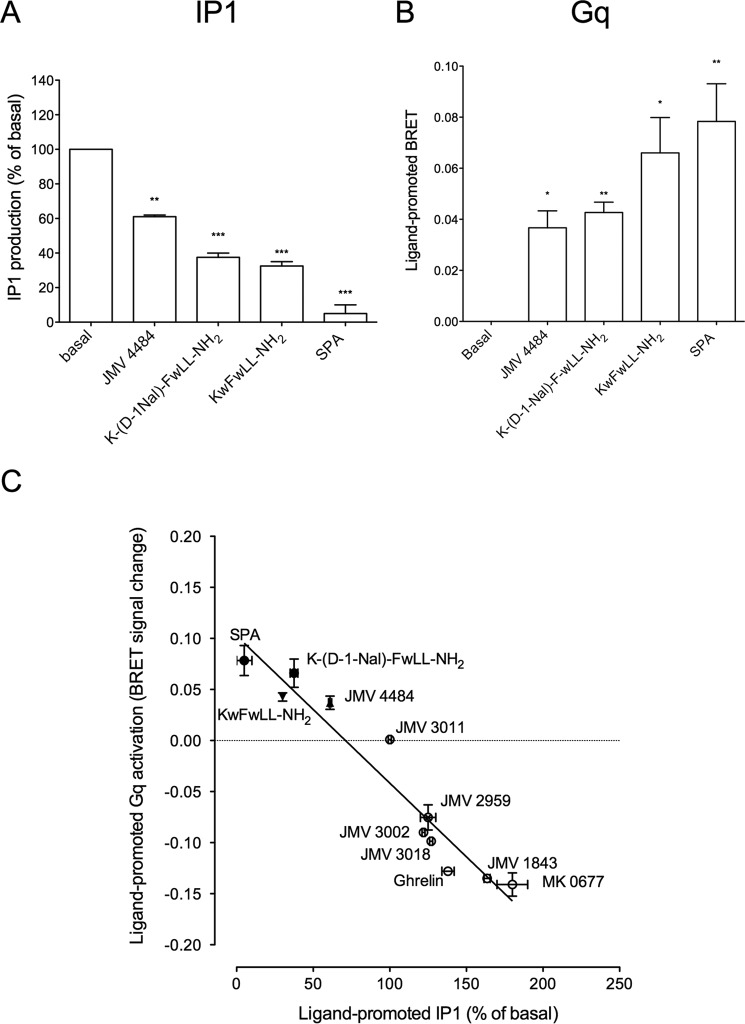
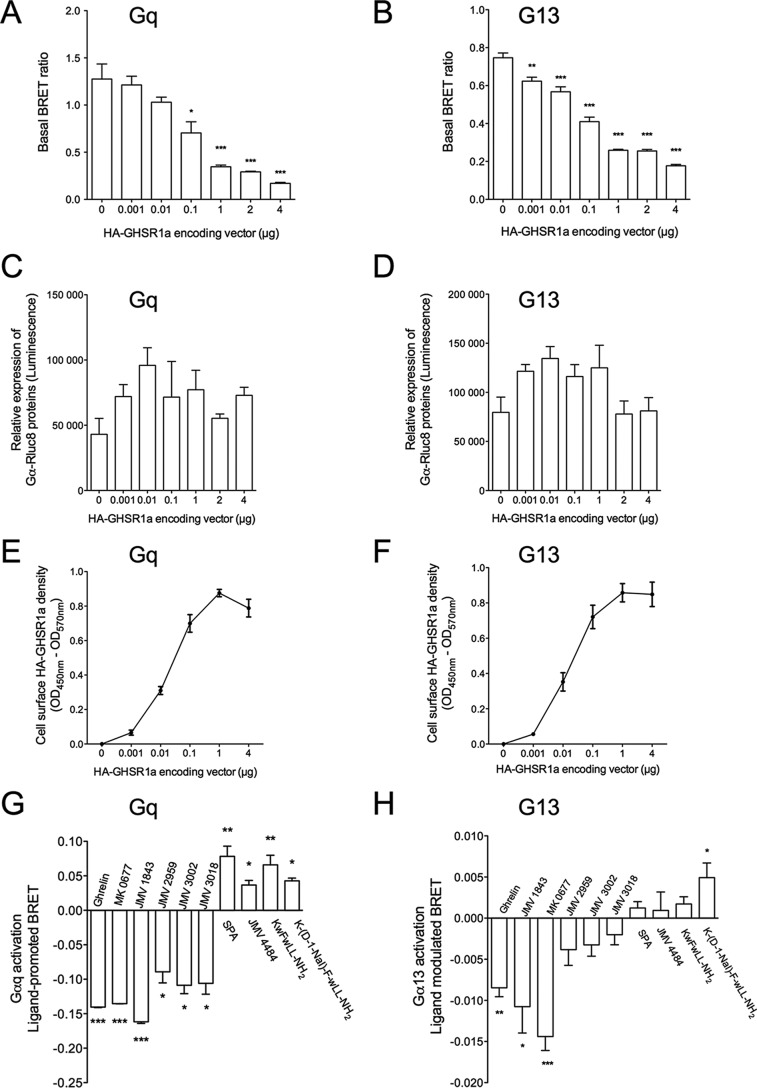
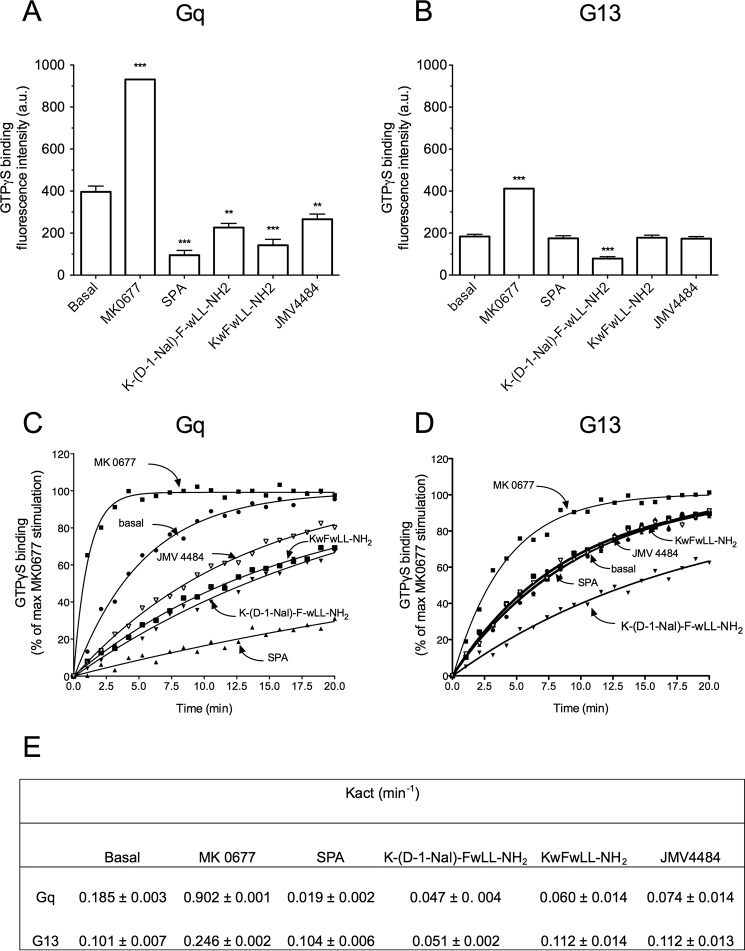
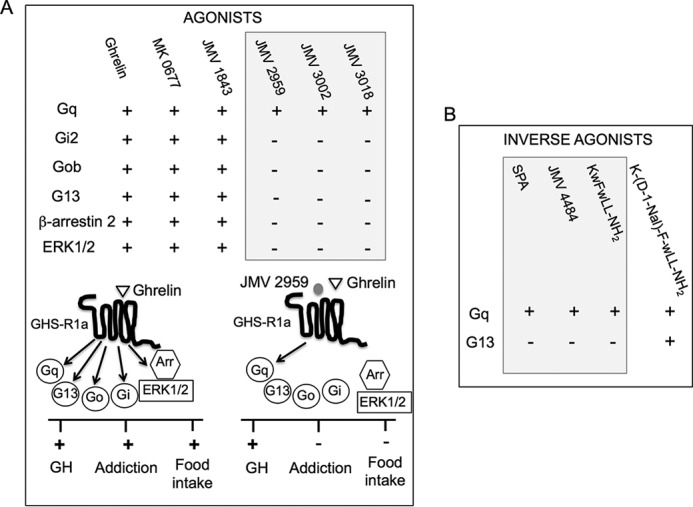
The G protein-coupled receptor GHS-R1a mediates ghrelin-induced growth hormone secretion, food intake, and reward-seeking behaviors. GHS-R1a signals through Gq, Gi/o, G13, and arrestin. Biasing GHS-R1a signaling with specific ligands may lead to the development of more selective drugs to treat obesity or addiction with minimal side effects. To delineate ligand selectivity at GHS-R1a signaling, we analyzed in detail the efficacy of a panel of synthetic ligands activating the different pathways associated with GHS-R1a in HEK293T cells. Besides β-arrestin2 recruitment and ERK1/2 phosphorylation, we monitored activation of a large panel of G protein subtypes using a bioluminescence resonance energy transfer-based assay with G protein-activation biosensors. We first found that unlike full agonists, Gq partial agonists were unable to trigger β-arrestin2 recruitment and ERK1/2 phosphorylation. Using G protein-activation biosensors, we then demonstrated that ghrelin promoted activation of Gq, Gi1, Gi2, Gi3, Goa, Gob, and G13 but not Gs and G12. Besides, we identified some GHS-R1a ligands that preferentially activated Gq and antagonized ghrelin-mediated Gi/Go activation. Finally, we unambiguously demonstrated that in addition to Gq, GHS-R1a also promoted constitutive activation of G13. Importantly, we identified some ligands that were selective inverse agonists toward Gq but not of G13. This demonstrates that bias at GHS-R1a signaling can occur not only with regard to agonism but also to inverse agonism. Our data, combined with other in vivo studies, may facilitate the design of drugs selectively targeting individual signaling pathways to treat only the therapeutically relevant function.

Keywords: G protein; G protein subtypes; G protein-coupled receptor (GPCR); bioluminescence resonance energy transfer (BRET); cell signaling; ghrelin; hormone receptor; signaling bias.


Figures

FIGURE 1.
FIGURE 1.
Efficacy of GHS-R1a ligands to promote inositol phosphate production. Inositol phosphate (IP1) production was promoted by ligands at a maximal dose (10−6 m) in cells expressing the GHS-R1a (A) or the A204E GHS-R1a mutant (D). Basal level of IP1 production was measured in cells expressing different amounts of GHS-R1a (B). IP1 production was promoted by ligands at a maximal dose (10−6 m) in cells expressing low and high amount of GHS-R1a (C). IP1 production was measured with an HTRF assay in HEK293T cells treated with ligands for 30 min at 37 °C. Data are expressed as the percentage of ghrelin maximal response. Basal represents IP1 production measured in non-stimulated HEK293T cells expressing GHS-R1a receptors. 0% is defined as the basal IP1 production of mock-transfected HEK293T cells (cells transfected with an empty pcDNA3.1 (+) vector). Values are mean ± S.E. of three independent experiments performed in triplicate. Statistical significance between stimulated and non-stimulated cells was assessed using a one-way ANOVA followed by Dunnett's post hoc test (***, p < 0.001; **, p < 0.01; *, p < 0.1).
FIGURE 2.
FIGURE 2.
Efficacy of GHS-R1a ligands to promote β-arrestin2 recruitment and ERK1/2 phosphorylation. β-Arrestin2 recruitment dose-response curves (A) and maximal responses with 10−6 m of ligand are shown (C). β-Arrestin2 recruitment to GHS-R1a was measured with a BRET1 assay upon ligand stimulation for 45 min at 37 °C in HEK293T cells expressing the GHS-R1a. ERK1/2 phosphorylation dose-response curves (B) and maximal responses with 10−6 m of ligand are shown (D). ERK1/2 phosphorylation was measured with an HTRF assay upon ligand stimulation for 10 min at 37 °C in HEK293T cells expressing the GHS-R1a. All data are expressed as the percentage of maximal ghrelin-induced stimulation. Dose-response curves (A and B) are representative of three experiments and graphs of maximal responses (C and D). Values are mean ± S.E. of three independent experiments performed in triplicate. 0% represents the basal of mock-transfected HEK293T cells. Statistical significance between stimulated and non-stimulated cells was assessed using a one-way ANOVA followed by Dunnett's post hoc test (***, p < 0.001; **, p < 0.01; *, p < 0.1).
FIGURE 3.
FIGURE 3.
Antagonist efficacy of JMV compounds toward ghrelin-promoted IP1 production, β-arrestin2 recruitment, and ERK1/2 phosphorylation. IP1 production (A), β-arrestin2 recruitment (B), and ERK1/2 phosphorylation (C) were measured as described in Figs. 1 and 2 and under the “Experimental Procedures.” HEK293T cells expressing the GHS-R1a were stimulated with ghrelin at 10−8 m in the absence or in the presence of 10−6 m JMV compounds. Data are expressed as the percentage of maximal ghrelin-induced stimulation. Bars and error bars represent the mean ± S.E. of three independent experiments, each performed in triplicate. Statistical significance between stimulated and non-stimulated cells was assessed using a one way ANOVA followed by Dunnett's post hoc test (***, p < 0.001; **, p < 0.01; *, p < 0.1).
FIGURE 4.
FIGURE 4.
Activation of G protein subtypes and isoforms by GHS-R1a. A, G protein activation kinetics was measured by BRET2 using G protein activation biosensors as described under “Experimental Procedures.” HEK293T cells co-expressing both the GHS-R1a and the G protein biosensor were stimulated by the GHS-R1a agonist MK-0677 (10−6 m). Data are representative of three to eight independent experiments. B, BRET maximal signal promoted by 10−6 m MK-0677 on HEK293T cells co-expressing GHS-R1a and G protein biosensors. Results are expressed as the difference in BRET ratio measured in the presence and in the absence of ligand stimulation for each G protein type (mean ± S.E.). Statistical significance between stimulated and non-stimulated cells was assessed using a paired Student's t test (**, p < 0.01; *, p < 0.05). C, Gs activation by the vasopressin V2 receptor. HEK293T cells co-expressing the V2 vasopressin receptor and Gs biosensor were stimulated by 10−6 m Arg-vasopressin, and the BRET signal was recorded as described in A. D, G12 activation by the thromboxane A2 α type (TPα) receptor: HEK293T cells co-expressing the TPα receptor and G12 biosensor were stimulated by 10−6 m U46619, and the BRET signal was recorded at described in A.
FIGURE 5.
FIGURE 5.
Efficacy and potency of ghrelin, MK-0677, and JMV 1843 toward Gq activation and IP1. A, dose-dependent Gq activation measured by BRET2 in HEK293T cells co-expressing both the GHS-R1a and Gq biosensor. B, dose-dependent IP1 measured by HTRF in HEK293T cells expressing the GHS-R1a. The zero value corresponds to basal non-stimulated HEK293T cells expressing the GHS-R1a. Curves are representative of three independent experiments, each performed in triplicate. Values of EC50 and Emax are reported in Table 2.
FIGURE 6.
FIGURE 6.
Efficacy and potency of GHS-R1a ligands to trigger activation of Gq, Gi, and Go. The BRET signal was recorded as a function of increasing concentrations of ligands in HEK293T cells co-expressing GHS-R1a and the G protein sensors. The effect of JMV 2959, JMV 3002, JMV 3018, and JMV 3011 was tested only on Gq, Gi2, and Gob. Data are representative of three independent experiments each performed in triplicate. Values of EC50 and Emax are reported in Table 2.
FIGURE 7.
FIGURE 7.
Efficacy of JMV 2959, JMV 3002, JMV 3018, and JMV 3011 at inhibiting ghrelin-promoted Gq, Gi2, and Gob activation. HEK293T cells expressing GHS-R1a were stimulated for 15 min at 25 °C with 10−6 m JMV compounds in the presence or absence of ghrelin at 10−7 m. Results are expressed as the difference in BRET ratio measured in the presence and in the absence of ligand stimulation for each G protein type. Values are mean ± S.E. of three experiments, each performed in triplicate. Statistical significance between the signal obtained with ghrelin alone and ghrelin in the presence of JMV compounds for each G protein was assessed using a paired Student's t test (***, p < 0.001; **, p < 0.01).
FIGURE 8.
FIGURE 8.
Efficacy of inverse agonists toward Gq and IP production. A, efficacy of ligands (10−6 m) at promoting IP1 production expressed as the percentage of basal IP of HEK293T cells expressing GHS-R1a, where zero represents the basal IP1 production of mock-transfected HEK293T cells. B, efficacy of ligands (10−6 m) at promoting BRET signal increase in HEK293T cells co-expressing the GHS-R1a and the Gq biosensor. The basal value represents the BRET signal obtained in the absence of ligand stimulation. Values are mean ± S.E. of three experiments, each performed in triplicate. Statistical significance between stimulated and non-stimulated cells was assessed using a paired Student's t test (***, p < 0.001; **, p < 0.01; *, p < 0.05). C, correlation between the efficacy of ligands toward Gq activation and their efficacy toward inositol phosphate production. Variation of the BRET2 signal triggered by ligands in HEK293T cells co-expressing GHS-R1a and the Gq sensor is plotted versus IP1 production promoted by ligands in HEK293T cells expressing GHS-R1a. BRET2 signal variation is expressed as the difference of the BRET ratio measured in simulated and non-stimulated cells. IP production is expressed as the percentage of basal IP production measured in HEK293T cells expressing the GHS-R1a with basal representing 100%. Values are mean ± S.E. of three experiments. R2 = 0.94
FIGURE 9.
FIGURE 9.
GHS-R1a-dependent constitutive activity at Gq and G13 and selectivity of agonists and inverse agonists. A and B, BRET signal measured in HEK293T cells co-expressing either Gαq-Rluc8 (A) or Gα13-Rluc8 (B) and GFP10-Gγ2 and Gβ1 in the absence or presence of increasing amounts of HA-GHS-R1a (vectors encoding N-terminally the HA-tagged GHS-R1a ranging from 0.001 to 4 μg/well) and in the absence of ligand. Data represent the mean ± S.E. of at least three independent experiments. Statistical significance between cells expressing or not the HA-GHS-R1a was assessed using a one-way ANOVA followed by Tukey's test (*, p < 0.05; **, p < 0.01; ***, p < 0.001). Each transfection condition was controlled for Gαq-Rluc8 (C) and Gαq-Rluc8 (D) total expression levels by measuring luminescence intensity (C and D) and cell surface expression of HA-GHS-R1a quantified by ELISA using an anti-HA antibody (E and F). Results are expressed as the mean ± S.E. of at least three independent experiments. G and H, BRET signal promoted by ligands measured in HEK293T cells co-expressing either Gαq-Rluc8 (G) or Gα13-Rluc8 (H), GFP10-Gγ2 and Gβ1, in the presence of the HA-GHS-R1a, and stimulated or not with 10 μm ligands. Results are expressed as the difference in BRET signals measured in the presence and in the absence of ligand. Values are mean ± S.E. of at least four independent experiments. Statistical significance between stimulated and non-stimulated cells was assessed using a paired Student's t test (***, p < 0.001; **, p < 0.01; *, p < 0.05).
FIGURE 10.
FIGURE 10.
GHS-R1a-dependent constitutive activity at Gq and G13 proteins and ligand selectivity with the purified receptor. The monomeric GHS-R1a in lipid discs was incubated with purified Gαq and Gα13 in the presence of Gβ1γ2. The efficacy of ligands to modulate GHS-R1a-promoted Gq (A) and G13 (B) activity was assessed by monitoring changes in the BODIPY® FL GTPγS emission intensity. GTPγS binding is expressed as raw values of fluorescence emission of BODIPY® FL GTPγS. Data are from one representative of three independent experiments, and statistical significance between unliganded and liganded GHS-R1a was assessed using Student's t test (***, p < 0.001; **, p < 0.01). Kinetics of GTPγS binding to Gq (C) and G13 (D) were carried out under the same conditions. GHS-R1a-catalyzed GTPγS binding is expressed as the percentage of maximal MK-0677 stimulation. E, Kact (min−1) values (mean ± S.E., n = 2) were calculated from GTPγS binding kinetics using GraphPad Prism software.
FIGURE 11.
FIGURE 11.
Outline of the functional selectivity of GHS-R1a ligands at GHS-R1a signaling. A, agonists. Ghrelin, MK-0677, and JMV 1843 are agonists (+) for all pathways, whereas JMV 2959, JMV 3002, and JMV 3018 compounds are partial agonists for Gq and neutral (−) toward the other pathways. Schematic drawings represent signaling pathways and in vivo effects promoted by ghrelin upon binding to GHS-R1a. Ghrelin, the endogenous ligand of GHS-R1a, activates Gq-, Go-, Gi-, and G13-dependent pathways and induces arrestin recruitment and ERK1/2 phosphorylation, resulting in GH secretion, food intake, and addiction. JMV 2959 antagonizes ghrelin action at Go, Gi, arrestin, and ERK but inhibits only partially Gq resulting in inhibition of addiction and food intake but not to inhibition of GH secretion. The possible connection between selectivity of JMV 2959 toward signaling pathways and physiological responses remains to be established. B, inverse agonists at Gq and G13. K-(D-1-Nal)-F-wLL-NH2 is an inverse agonist at both Gq and G13, whereas SPA, JMV 4484, and KwFwLL-NH2 are inverse agonists for both Gq and G13. Physiological consequences of the inverse agonism selectivity at Gq and G13 remain to be explored.

Similar articles

Cited by

References

    1. Kojima M., Hosoda H., Date Y., Nakazato M., Matsuo H., and Kangawa K. (1999) Ghrelin is a growth-hormone-releasing acylated peptide from stomach. Nature 402, 656–660 - PubMed
    1. Akamizu T., and Kangawa K. (2012) The physiological significance and potential clinical applications of ghrelin. Eur. J. Intern. Med. 23, 197–202 - PubMed
    1. Delporte C. (2013) Structure and physiological actions of ghrelin. Scientifica 2013, 518909. - PMC - PubMed
    1. Lagerström M. C., and Schiöth H. B. (2008) Structural diversity of G protein-coupled receptors and significance for drug discovery. Nat. Rev. Drug Discov. 7, 339–357 - PubMed
    1. Cruz C. R., and Smith R. G. (2008) The growth hormone secretagogue receptor. Vitamins Hormones 77, 47–88 - PubMed

Publication types

LinkOut - more resources