. 2016 Mar;31(3):524-34.
doi: 10.1002/jbmr.2711. Epub 2015 Oct 5.

Stable 5-Hydroxymethylcytosine (5hmC) Acquisition Marks Gene Activation During Chondrogenic Differentiation

Affiliations

Stable 5-Hydroxymethylcytosine (5hmC) Acquisition Marks Gene Activation During Chondrogenic Differentiation

Sarah E B Taylor et al. J Bone Miner Res. 2016 Mar.

Abstract

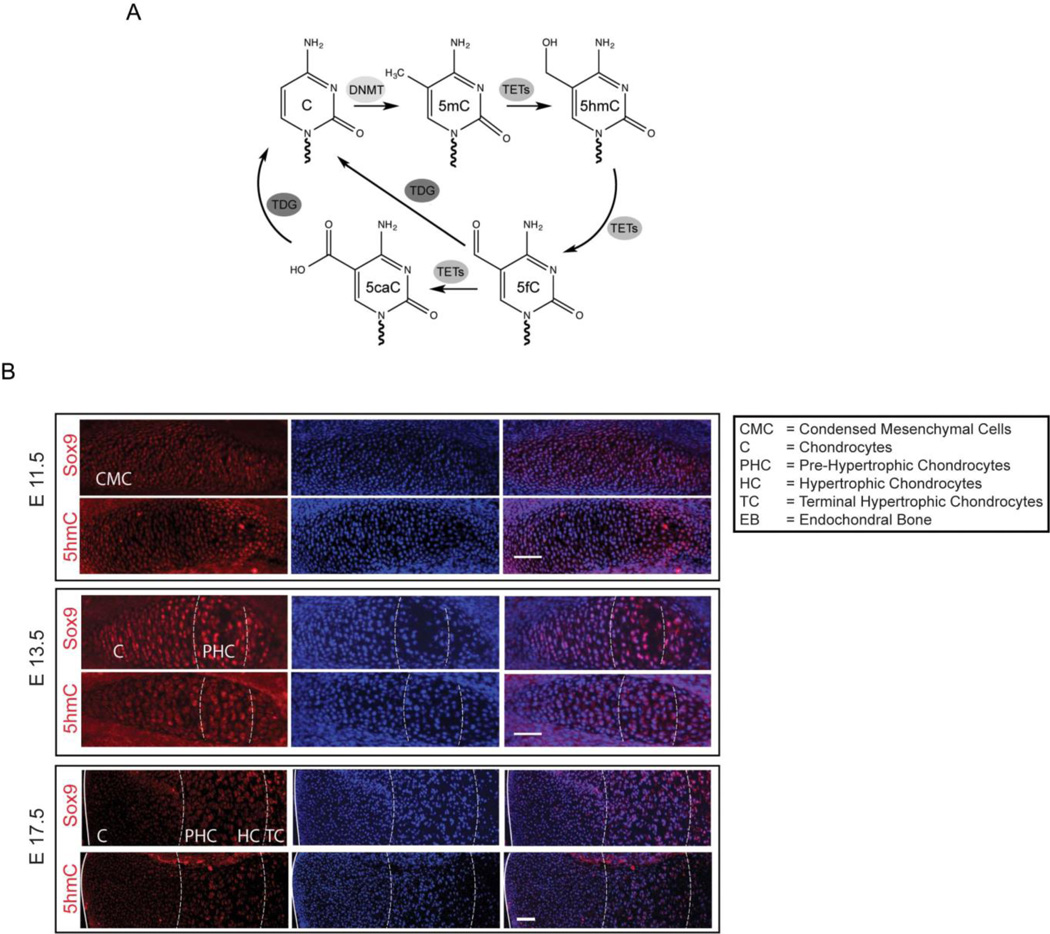
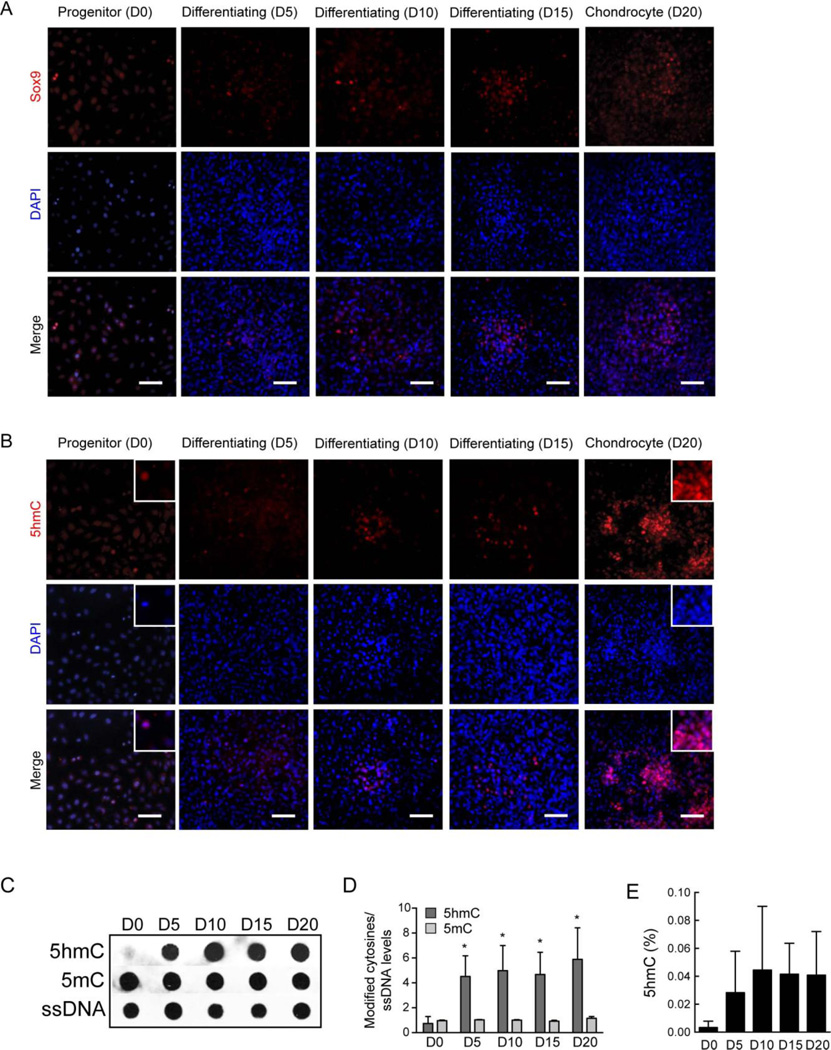
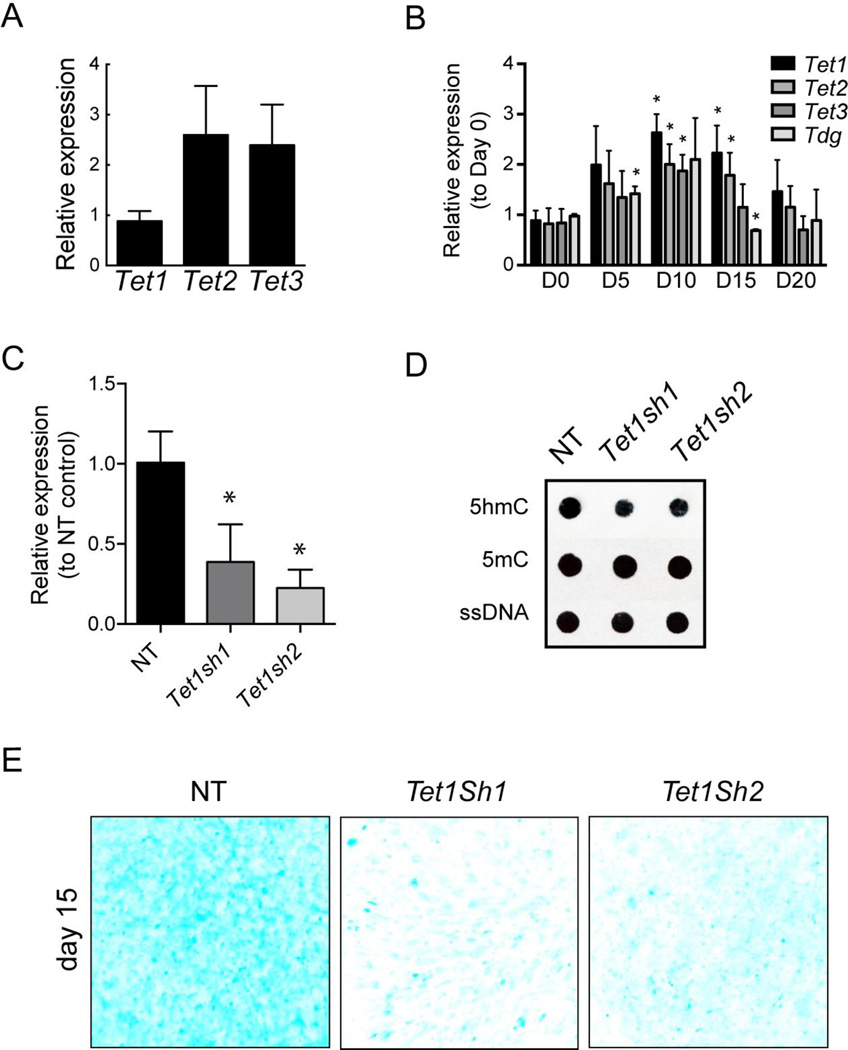
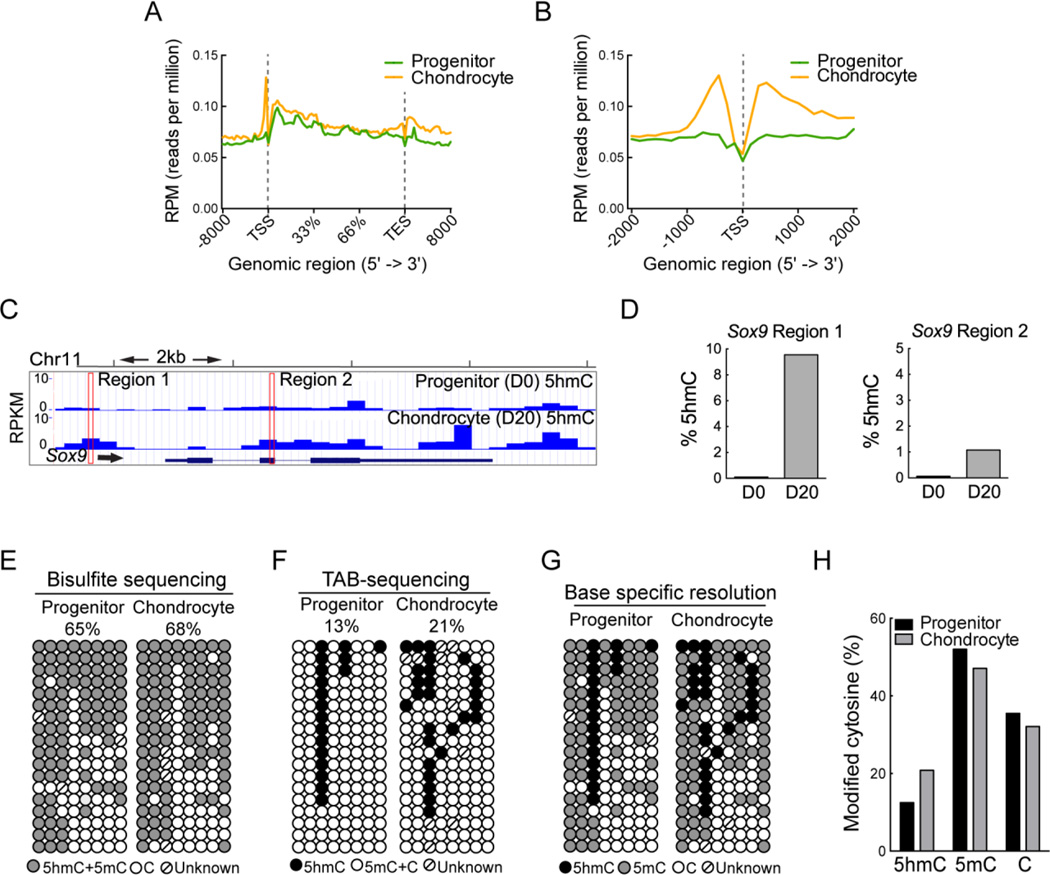
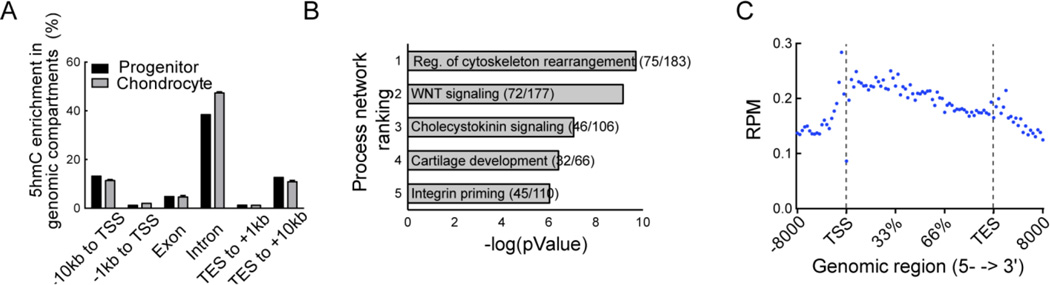
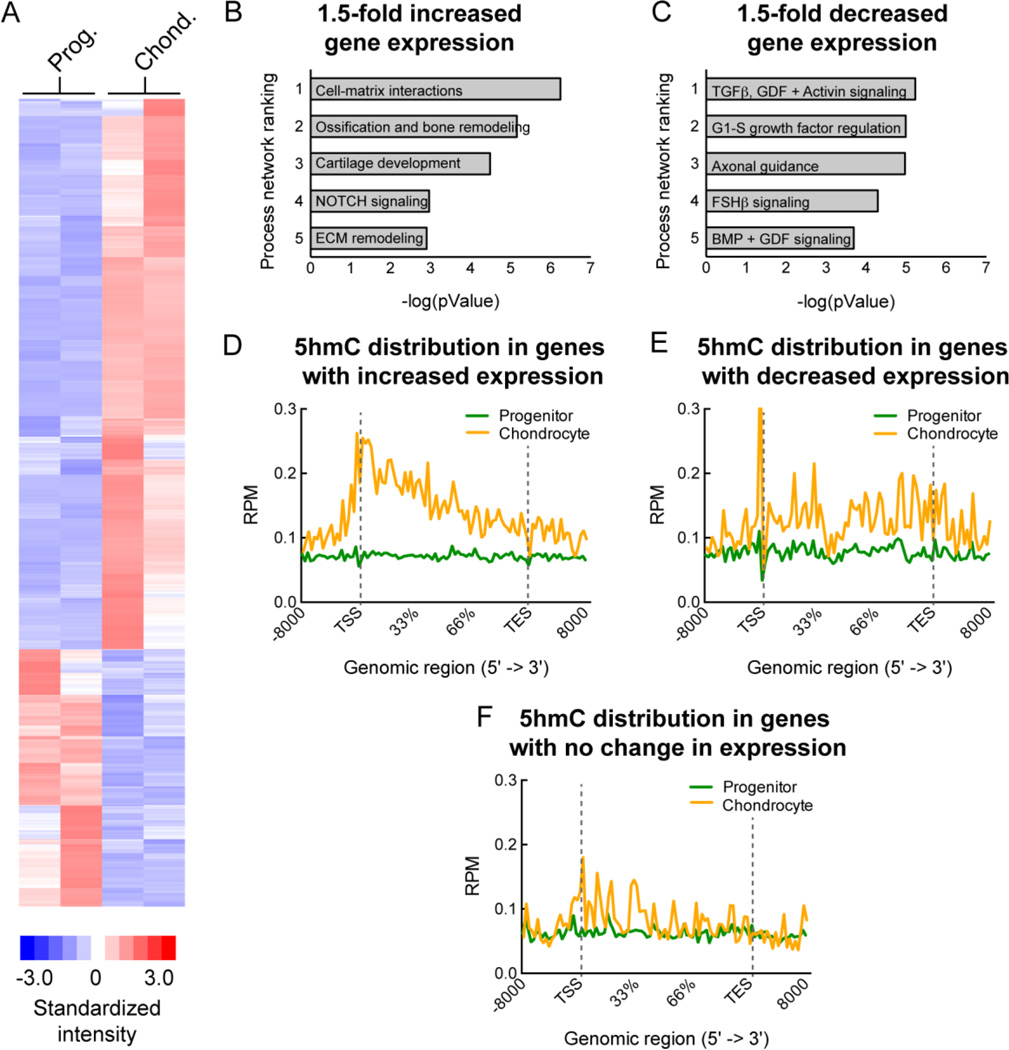
Regulation of gene expression changes during chondrogenic differentiation by DNA methylation and demethylation is little understood. Methylated cytosines (5mC) are oxidized by the ten-eleven-translocation (TET) proteins to 5-hydroxymethylcytosines (5hmC), 5-formylcytosines (5fC), and 5-carboxylcytosines (5caC), eventually leading to a replacement by unmethylated cytosines (C), ie, DNA demethylation. Additionally, 5hmC is stable and acts as an epigenetic mark by itself. Here, we report that global changes in 5hmC mark chondrogenic differentiation in vivo and in vitro. Tibia anlagen and growth plate analyses during limb development at mouse embryonic days E 11.5, 13.5, and 17.5 showed dynamic changes in 5hmC levels in the differentiating chondrocytes. A similar increase in 5hmC levels was observed in the ATDC5 chondroprogenitor cell line accompanied by increased expression of the TET proteins during in vitro differentiation. Loss of TET1 in ATDC5 decreased 5hmC levels and impaired differentiation, demonstrating a functional role for TET1-mediated 5hmC dynamics in chondrogenic differentiation. Global analyses of the 5hmC-enriched sequences during early and late chondrogenic differentiation identified 5hmC distribution to be enriched in the regulatory regions of genes preceding the transcription start site (TSS), as well as in the gene bodies. Stable gains in 5hmC were observed in specific subsets of genes, including genes associated with cartilage development and in chondrogenic lineage-specific genes. 5hmC gains in regulatory promoter and enhancer regions as well as in gene bodies were strongly associated with activated but not repressed genes, indicating a potential regulatory role for DNA hydroxymethylation in chondrogenic gene expression.

Keywords: 5-HYDROXYMETHYLCYTOSINE; CHONDROGENESIS; DIFFERENTIATION; DNA DEMETHYLATION; EPIGENETICS.


Figures

Figure 1
Figure 1. Distinct changes in global 5-hydroxymethylcytosine (5hmC) are associated with different stages of chondrogenic differentiation during embryonic limb development
Also see Supplemental Figure 1. A. Scheme demonstrating the different pathways and enzyme families responsible for 5hmC generation and turnover. DNA methyltransferases (DNMT) methylate cytosine residues at the C-5 carbon to produce 5-methylcytosine (5mC). DNMT1 is responsible for the maintenance of cytosine methylation marks during cell division, whereas DNMT3A and 3B establish de novo cytosine methylation. The TET family of enzymes (TETs) including TET 1, 2 and 3 convert 5mC to 5-hydroxymethylcytosines (5hmC) and further oxidized products 5-formylcytosines (5fC) and 5-carboxylcyosines (5caC) that can be acted upon by the Base-Excision Repair (BER) glycosylase, TDG. B. Immunostaining of the developing mouse tibial anlagen at embryonic days E11.5 (days post coitus), and growth plate at E13.5 and E17.5 with antibodies specific to 5hmC and Sox9 (red). Nuclei (blue) are counterstained with DAPI. Scale bar = 50µm.
Figure 2
Figure 2. Chondroprogenitor differentiation in vitro is accompanied by an increase in global 5hmC levels
Also see Supplemental Figures 2 and 3. A. Immunostaining of ATDC5 cells over the course of chondrogenesis from progenitor cells (D0 = day 0) to mature chondrocyte (D20 = day 20) with an antibody specific to Sox9 (red). Nuclei (blue) are counterstained with DAPI; merge (violet) is shown in the bottom panel. Scale bar = 30µm. B. Immunostaining of ATDC5 cells over the course of chondrogenesis from progenitor cells (D0 = day 0) to mature chondrocyte (D20 = day 20) with an antibody specific to 5hmC (red). Nuclei (blue) are counterstained with DAPI; merge (violet) is shown in the bottom panel. Scale bar = 30µm. Insets show higher magnification of selected areas. C. Representative immunoblot of 5hmC and 5mC levels during chondrogenic differentiation of ATDC5 cells. DNA isolated from cells undergoing differentiation at the indicated time points, was probed with antibodies specific to 5hmC, 5mC and single stranded DNA (ssDNA, as a control for loading). D. Quantification of the modified cytosine levels as represented in the immunoblot in B, normalized to ssDNA. Data represented as mean ± SD from three independent biological replicates (n = 3). * denotes p < 0.05 compared to the control group at day 0 (D0). E. Quantification of global 5hmC during percentage chondrogenic differentiation by ELISA. Data represented as mean ±SD (n = 2).
Figure 3
Figure 3. TET1 loss of function leads to the decrease in 5hmC levels and impairment in chondrogenic differentiation
A. Relative gene expression levels of Tet1, 2 and 3 in the chondroprogenitor cells. Data represented as mean ±SD from three independent biological replicates (n = 3). B. Gene expression analysis for the Tet family members and Tdg during chondrogenic differentiation of ATDC5 cells. Data represented as mean ±SD from three independent biological replicates (n = 3). * denotes p < 0.05 compared to the control group at day 0 (D0). C. Relative gene expression levels of Tet1 in ATDC5 cells differentiated after Tet1 knockdown with two different shRNA (Tet1Sh1, Tet1Sh2). Data represented as mean ±SD from three independent biological replicates (n = 3). * denotes p < 0.05 compared to the Non-Target (NT) control group. D. Representative immunoblot of 5hmC and 5mC in ATDC5 cells differentiated in the presence (NT) or absence of TET1 (Tet1Sh1, Tet1Sh2). DNA isolated from cells at Day 15 of differentiation, was probed with antibodies specific to 5hmC, 5mC and single stranded DNA (ssDNA, as a control for loading). E. Glycosaminoglycan (GAG) staining of cells with Alcian blue of ATDC5 chondrocytes differentiated in the presence (NT) or absence (Tet1Sh1, Tet1Sh2) of TET1 at day 15. Scale bar = 5mm.
Figure 4
Figure 4. Mapping global 5hmC distribution during chondrogenic differentiation using hMe-seq
Also see Supplemental Figure 4, and Supplemental Tables 1–3. A, B. Composite profiles of the 5hmC distribution during chondrogenesis averaged over the gene body (A) and the transcriptional start site (TSS) (B), respectively. C. Snapshot of the 5hmC profile over the course of chondrogenesis in a representative genomic region encompassing the chondrogenic gene, Sox9. The outlined regions were used for validation in D. D. Validation of the 5hmC peaks in the progenitor (day 0) and chondrocyte (day 20) in the Sox9 gene identified by hMe-seq using a restriction digest based approach (See Materials and Methods). E. Bisulfite sequencing analysis of the region upstream of the Sox9 TSS (outlined in A). Gray circles indicate unconverted cytosines (methylated or hydroxymethylated cytosines); open circles represent unmethylated CpGs and the CpGs with undefined methylation status are marked as unknown. F. TET-assisted bisulfite (TAB) sequencing for the same region upstream of the Sox9 TSS. Black circles indicate hydroxymethylated CpGs; open circles indicate methylated or unmethylated CpGs and the CpGs with undefined methylation status are marked as unknown. G. Combined data from the bisulfite and TAB-sequencing for single base resolution of the methylation status of the CpGs in the Sox9 region analyzed. Black circles indicate hydroxymethylated CpGs; gray circles indicate methylated CpGs and open circles indicate unmethylated CpGs. CpGs with undefined methylation status are marked as unknown. H. Quantification of the percentages of modified cytosines in the progenitor and mature chondrocytes based on D.
Figure 5
Figure 5. Stable 5hmC is enriched in intergenic regions in mature chondrocytes
Also see Supplemental Figure 5. A. Proportion of 5hmC in individual genomic compartments in the progenitor and mature chondrocytes respectively. 5hmC peaks observed in the particular compartment are depicted as a percentage of the total 5hmC peaks. B. The top five pathways identified by network analysis of the top 25% of the subset of genes with a ten-fold or greater 5hmC gain in the mature chondrocytes as compared to progenitor cells. Pathways were ranked by the number of pathway genes with high 5hmC as a ratio of the total number of genes in the pathway (shown in brackets) and by corresponding pValue. Data analysis was performed using Metacore (http://thomsonreuters.com/metacore/). C. Composite profile of the 5hmC distribution pattern in the top 25% of the subset of genes with a ten-fold or greater 5hmC gain in the mature chondrocytes as compared to progenitor cells.
Figure 6
Figure 6. Stable 5hmC gain is associated with gene activation during chondrogenic differentiation
Also see Supplemental Figures 6 and 7. A. A heatmap of global gene expression changes between the progenitor cells (Prog.) and differentiated chondrocytes (Chond.) for two independent biological replicates. Regions of red represent higher than mean expression while regions of blue indicate lower than mean expression. B. Enrichment analysis of the genes with a 1.5-fold or greater increase in expression during chondrogenesis (the most activated genes between the progenitor and differentiated chondrocytes). Corresponding pValues are shown. Data analysis was performed using Metacore (http://thomsonreuters.com/metacore/). C. Enrichment analysis of the genes with a 1.5-fold or greater decrease in expression during chondrogenesis (the most repressed genes between the progenitor and differentiated chondrocytes). Corresponding pValues are shown. Data analysis was performed using Metacore (http://thomsonreuters.com/metacore/). D. Composite profile of the 5hmC patterns in the progenitor and differentiated chondrocytes for the activated genes during chondrogenic differentiation. E. Composite profile of the 5hmC patterns in the progenitor and differentiated chondrocytes for the repressed genes during chondrogenic differentiation. F. Composite profile of the 5hmC patterns in the progenitor and differentiated chondrocytes for the genes with no change in expression during chondrogenic differentiation.

References

    1. Jones PA. The role of DNA methylation in mammalian epigenetics. Science. 2001;293(5532):1068–1070. - PubMed
    1. Kronenberg HM. Developmental regulation of the growth plate. Nature. 2003;423(6937):332–336. - PubMed
    1. Bhutani N, Burns David M, Blau Helen M. DNA Demethylation Dynamics. Cell. 2011;146(6):866–872. - PMC - PubMed
    1. Tahiliani M, Koh KP, Shen Y, Pastor WA, Bandukwala H, Brudno Y, et al. Conversion of 5-methylcytosine to 5-hydroxymethylcytosine in mammalian DNA by MLL partner TET1. Science (New York, NY) 2009;324(5929):930–935. - PMC - PubMed
    1. Ito S, D’Alessio AC, Taranova OV, Hong K, Sowers LC, Zhang Y. Role of Tet proteins in 5mC to 5hmC conversion, ES-cell self-renewal and inner cell mass specification. Nature. 2010;466(7310):1129–1133. - PMC - PubMed

Publication types

MeSH terms