. 2016 Apr 28;35(17):2247-65.
doi: 10.1038/onc.2015.288. Epub 2015 Sep 14.

YAP induces high-grade serous carcinoma in fallopian tube secretory epithelial cells

Affiliations

YAP induces high-grade serous carcinoma in fallopian tube secretory epithelial cells

G Hua et al. Oncogene. .

Abstract

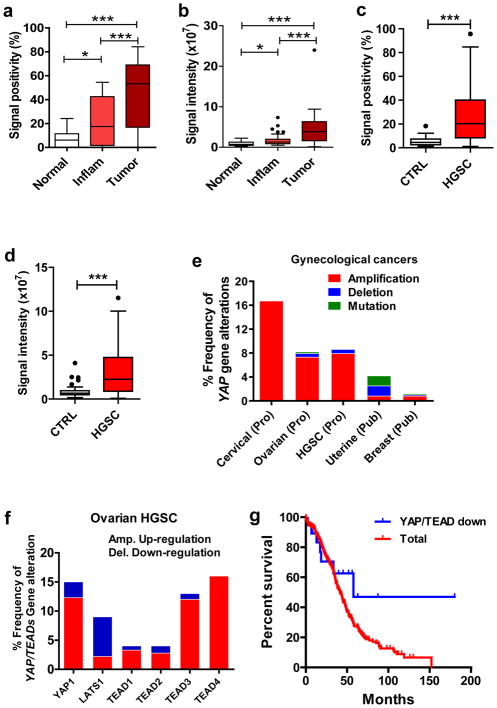
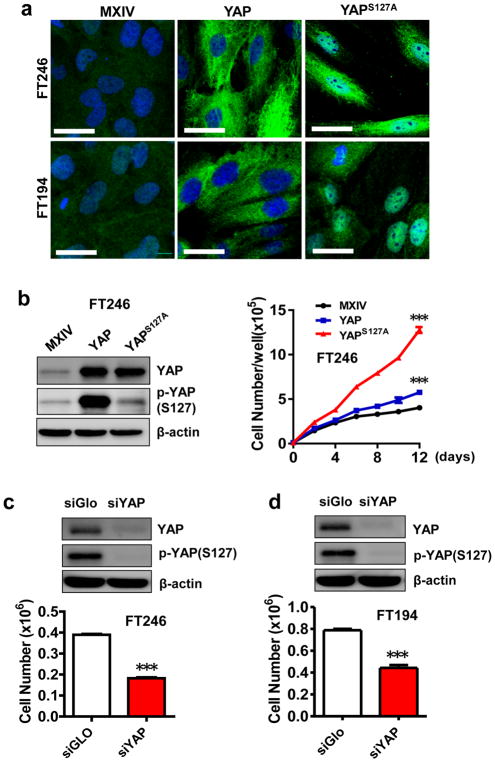
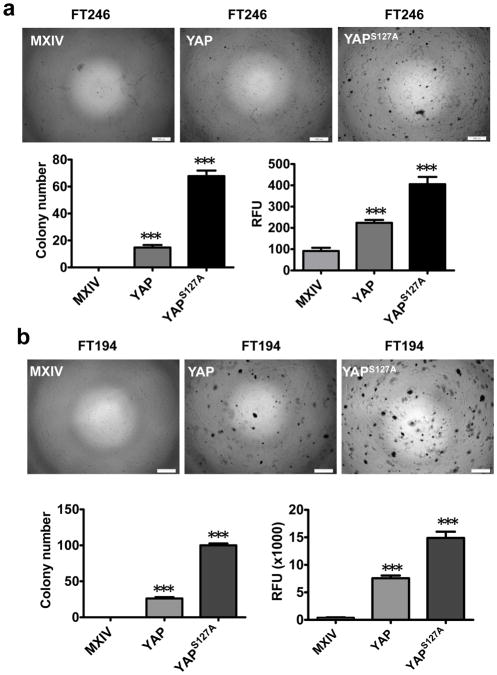
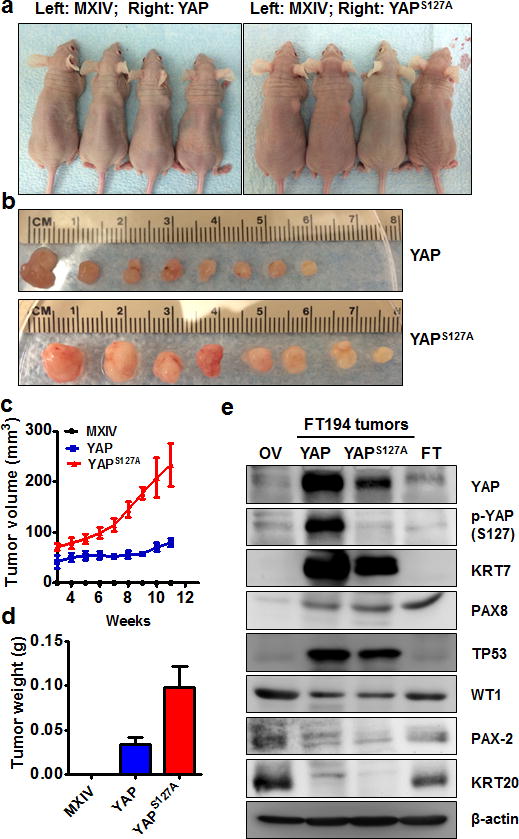
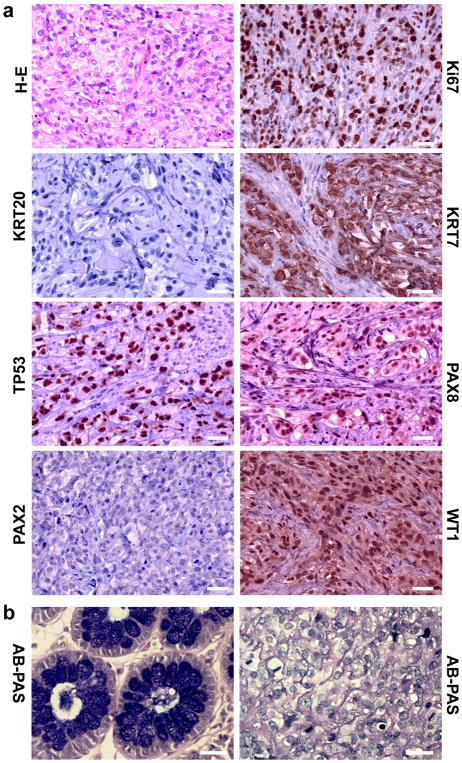
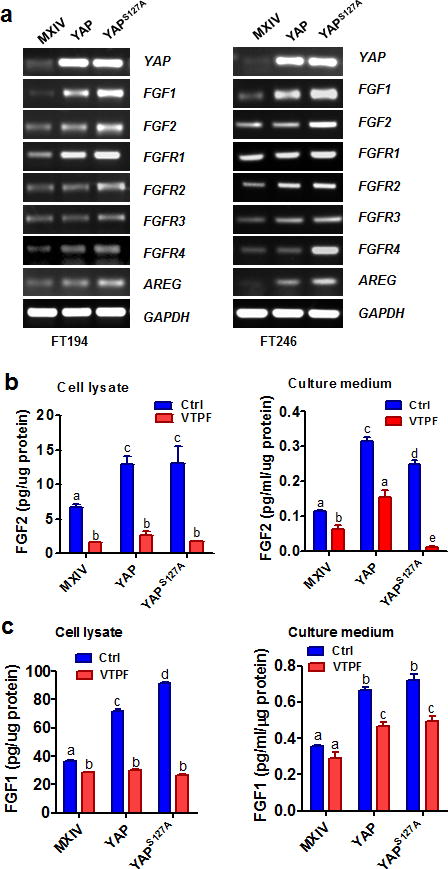
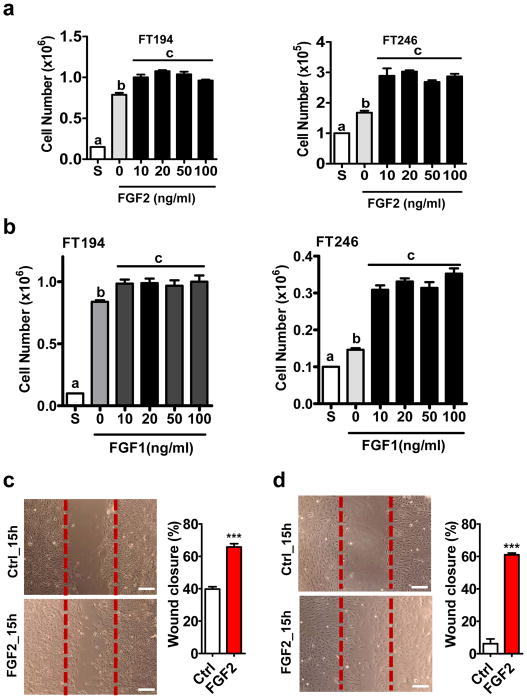
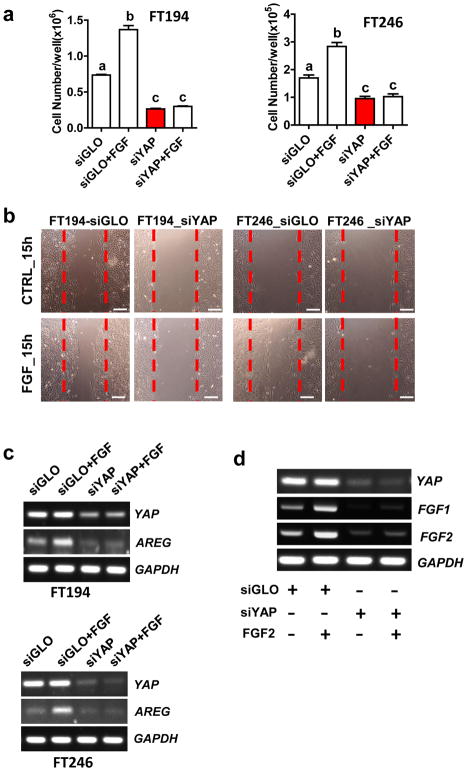
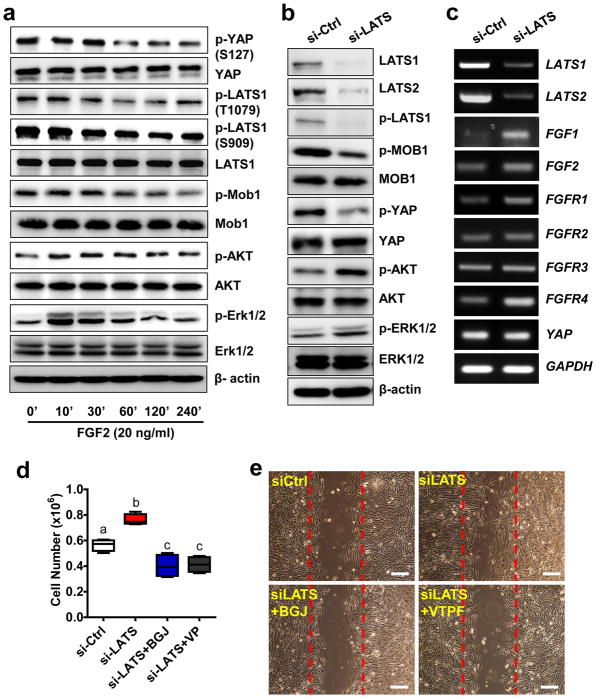
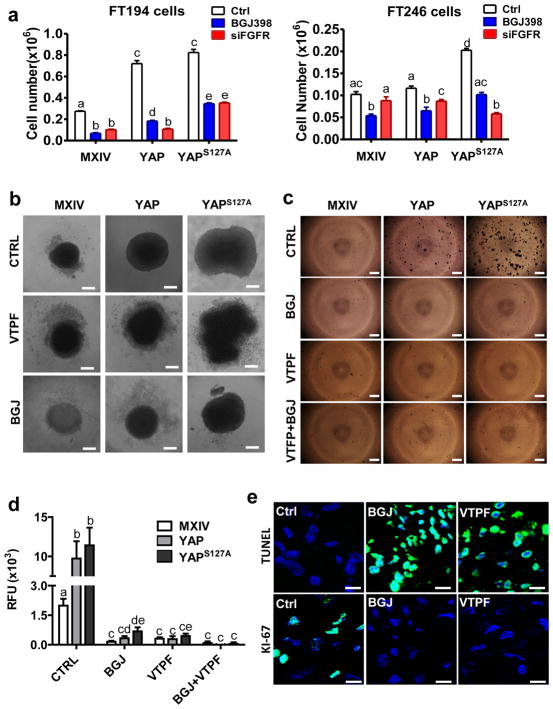
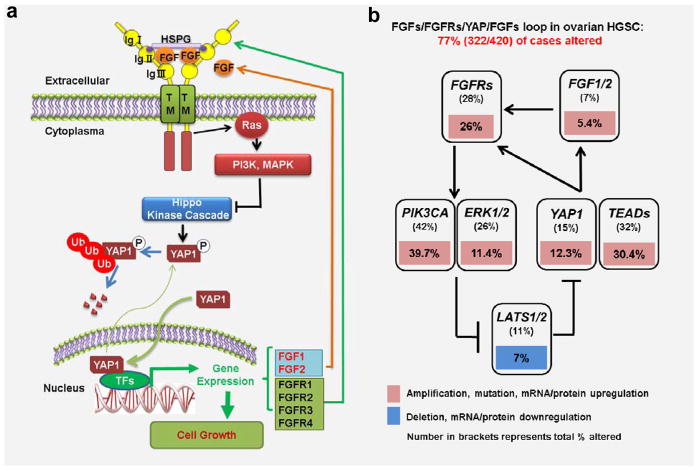
Accumulating evidence indicates that ovarian high-grade serous carcinoma (HGSC) originates from fallopian tube secretory epithelial cells (FTSECs). However, the molecular mechanisms underlying the initiation and progression of HGSC derived from FTSECs remains unclear. In this study, we found that the Hippo/Yes-associated protein (YAP) signaling pathway has a critical role in the initiation and progression of fallopian tube and ovarian HGSC. Importantly, YAP was overexpressed in inflammatory and cancerous fallopian tube tissues. Further, overexpression of wild-type YAP, or constitutively active YAP in immortalized FTSECs, induced cell proliferation, migration, colony formation and tumorigenesis. Moreover, the Hippo/YAP and the fibroblast growth factor (FGF) signaling pathways formed an autocrine/paracrine-positive feedback loop to drive the progression of the FTSEC-derived HGSC. Evidence in this study strongly suggests that combined therapy with inhibitors of YAP (such as verteporfin) and FGF receptors (such as BGJ398) can provide a novel therapeutic strategy to treat fallopian tube and ovarian HGSC.


Conflict of interest statement

Conflict of Interest: The authors have no competing interests to declare.

Figures

Figure 1
Figure 1. Expression of YAP protein and alterations of YAP-associated genes in Fallopian tube cancer (FTC) and ovarian high grade serous carcinoma (HGSC)
a) Quantitative data showing YAP immunosignal positivity (percentage of the YAP positive cell number relative to the total cell number) in normal, inflammatory (chronic tube inflammation, Inflam) and cancerous (tumor) Fallopian tube tissues determined by immunohistochemistry. b) Quantitative data showing YAP immunosignal intensity in normal, inflammatory (Inflam) and cancerous Fallopian tube tissues determined by immunohistochemistry. Each bar represents the mean ± SEM (n=5 for Normal, n=10 for Inflam, n=10 for tumor. *: P < 0.05, ***: P < 0.001. c) Quantitative data showing YAP immunosignal positivity in the ovarian normal tissues and ovarian HGSC. d) Quantitative data showing YAP immunosignal intensity in the ovarian normal tissues and ovarian HGSC. CTRL: normal ovarian tissues used as control; HGSC: ovarian high grade serous carcinoma tissues. Each bar represents the mean ± SEM (n=42 for CTRL, n=105 for HGSC). ***: P < 0.001. e) Alterations of YAP gene across the gynecological cancers. The cross cancer YAP gene alteration analyses was performed using online datasets and data mining tools (the cBioPortal for Cancer Genomics and the datasets from the TCGA research Network). f) Alterations of YAP, LATS1 and TEAD genes in the ovarian high grade serous carcinoma. Data sources and analysis tools are the same as in e). g) Correlation between overall survival and YAP/TEAD expression in the ovarian HGSC. Data were extracted from the TCGA datasets using the cBioPortal and uploaded to the GraphPad Prism 5 for statistical analysis. Total: Correlation between YAP/TEAD levels and overall survival in all ovarian HGSC cases (n=418); YAP/TEAD down: Correlation between YAP/TEAD expression levels and the overall survival in 19 cases of ovarian HGSC in which YAP/TEAD expression levels are lower and are out of the default Z score thresholds.
Figure 2
Figure 2. Effect of YAP protein levels on the proliferation of FTSECs
a) Fluorescent immunocytochemistry determining the expression and localization of YAP protein (green) in FT246-MXIV, FT246-YAP and FT246-YAPS127A and FT194-MXIV, FT194-YAP and FT194-YAPS127A cell lines. Nuclei were stained with DAPI (blue). Scale bar = 50μm. b) Overexpression of wild type YAP or constitutively active YAP on the proliferation of FT246 cells. Left panel: Western blot detection of levels of YAP and phosphorylated YAP in FT246-MXIV, FT246-YAP and FT246-YAPS127A cell lines. Right panel: growth curves of FT246-MXIV, FT246-YAP and FT246-YAPS127A cell lines. ***: P < 0.001 compared to MXIV control. c) Top: protein levels of YAP and phosphorylated YAP (ser127) in FT246 cells with or without knockdown of YAP with YAP siRNA (siYAP). SiGlo: Non-targeting siRNA used as a control. Bottom: effect of YAP knockdown on the proliferation of FT246 cells. ***: P < 0.001 compared to siGlo control. d) Effect of knockdown of YAP on the proliferation of FT194 cells. ***: P < 0.001 compared to siGlo control.
Figure 3
Figure 3. YAP is able to transform immortalized FTSECs
a) Top panel: Soft agar assay showing colony formation in FT246-MXIV, FT246-YAP and FT246-YAPS127A cells. Scale bar = 500 μm. Lower panel: quantitative analysis of colony formation in FT246-MXIV, FT246-YAP and FT246-YAPS127A cells. Left: colony numbers in FT246-MXIV, FT246-YAP and FT246-YAPS127A cells. Colonies with more than fifty cells were considered viable and counted. Right: fluorescence-based quantitative soft agar assay showing the relative colony numbers in FT246-MXIV, FT246-YAP, and FT246-YAPS127A cells. b) Soft agar assay showing colony formation in FT194-MXIV, FT194-YAP, and FT194-YAPS127A cells. Scale bar = 500 μm. Lower panels are quantitative data of regular soft agar assays and the fluorescence-based soft agar assays. Each bar represents mean ± SEM of five assays. ***: P < 0.001 compared to MXIV control.
Figure 4
Figure 4. Tumorigenic effect of YAP in FTSECs
a) Representative images showing tumor formation in the athymic nude mice injected with FT194-YAP and FT194-YAPS127A cells. FT194-MXIV control cells were injected on the left side and did not form tumor. b) Tumors derived from FT194-YAP and FT194-YAPS127A cells. c) Growth curves of tumors-derived from FT194-YAP and FT194-YAPS127A cells. d) Weights of tumors derived from FT194-YAP and FT194-YAPS127A cells. e) Western blot analysis showing biomarkers expressed in tumors derived from FT194-YAP and FT194-YAPS127A cells. Tumors-derived from FT194-YAP and FT194-YAPS127A cells express high levels of cytokeratin-7 (KRT7), PAX8, TP53 and WT1, but very low cytokeratin 20 (KRT20) and PAX2. Same amount of proteins from normal human ovarian (OV) and fallopian tube (FT) tissues were used as control.
Figure 5
Figure 5. YAP induces Fallopian tube high grade serous carcinoma
a) Histology and molecular features of tumors-derived from FT194-YAPS127A cells. H-E: Representative image showing histology of FT194-YAPS127A tumors tissues stained with hematoxylin-eosin. Ki67: representative image showing expression of Ki67 protein in FT194-YAPS127A tumor tissues analyzed by immunohistochemistry. FT194-YAPS127A tumors also express high level of cytokeratin 7 (KRT7), nuclear TP53, PAX8 and WT1, but not cytokeratin 20 (KRT20) and PAX2. Scale bar: 20μm. b) Representative images showing that tumor tissues derived from FT194-YAP cells are negative for the Alcian blue PH2.5-Periodic acid (AB-PAS) staining. Left: colorectal epithelium was used as a positive control for AB-PAS staining. Right: tumor tissues derived from FT194-YAP cells were AB-PAS negatively stained. Scale bar: 25μm.
Figure 6
Figure 6. YAP stimulates expression FGF and FGFR and secretion of basic and acidic FGFs
a) Determining the mRNA expression of YAP, FGF ligands (FGF1&FGF2) and FGFR1-4 in FT194-MXIV, FT194-YAP, and FT194-YAPS127A cells (Left panel), and FT246-MXIV, FT246-YAP and FT246-YAPS127A cells (right panels) by RT-PCR. AREG was used as a positive control. GAPDH was used as a loading control. b) Verteporfin (VTPF) suppresses YAP–induced production of basic FGF (FGF2). Left panel: FGF2 levels in the cell lysate of FT194-MXIV, FT194-YAP and FT194-YAPS127A cells in the absence or presence of 5μM of VTPF. Right panel: FGF2 levels in the culture medium of FT194-MXIV, FT194-YAP, and FT194-YAPS127A cells in the absence or presence of 5μM of VTPF. c) Verteporfin (VTPF) suppresses YAP–induced production acidic FGF (FGF1). Left penal: FGF1 levels in the cell lysate of FT194-MXIV, FT194-YAP, and FT194-YAPS127A cells in the absence or presence of 5μM of VTPF. Right panel: FGF1 levels in the culture medium of FT194-MXIV, FT194-YAP and FT194-YAPS127A cells in the absence or presence of 5μM of VTPF. Each bar represents the mean ± SEM of at least three independent experiments. Bars with different letters are significantly different from each other (P < 0.05).
Figure 7
Figure 7. FGF stimulates the proliferation and migration of FTSECs
a) Proliferation of FT194 (left panel) and FT246 (right panel) cells incubated in medium containing 1% FBS in the absence (0) or presence of 10 ng/ml, 20 ng/ml, 50 ng/ml or 100 ng/ml basic FGF (FGF2) for 3 days. S: seeding cell number. Each bar represents the mean ± SEM of three repeats. Bars with different letters are significantly different from each other (P < 0.05). b) Proliferation of FT194 (left panel) and FT246 (right panel) cells incubated in medium containing 1% FBS in the absence (0) or presence of 10 ng/ml, 20 ng/ml, 50 ng/ml or 100 ng/ml acidic FGF (FGF1) for 3 days. S: seeding cell number. Each bar represents the mean ± SEM of three repeats. Bars with different letters are significantly different from each other (P < 0.05). c) Left panel: representative images showing the effect of FGF2 (20 ng/ml, 15h) on the wound closure of FT194 cells. Right panel: quantitative data showing percentage of wound closure in FT194 cells in the absence or presence of 20 ng/ml FGF2. d) Left panel: representative images showing the effect of FGF treatment (FGF2, 20 ng/ml, 15h) on the wound closure of FT246 cells; right panel: quantitative data showing percentage of wound closure in FT246 cells in the presence or absence of 20 ng/ml FGF2. Each bar represents means ± SEM of three independent experiments. *** P < 0.001 compared to the control (Ctrl).
Figure 8
Figure 8. YAP is required for FGF regulating proliferation and migration of FTSECs
a) Knockdown of YAP protein with YAP siRNA (siYAP) in FT194 (left panel) and FT246 (right panel) cells eliminate FGF-induced cell proliferation. Each bar represents the mean ± SEM of three independent experiments. Bars with different letters are significantly different from each other (P<0.001). b) Representative images showing that knockdown of YAP with YAP siRNA blocked FGF-induced wound closure in FT194 (left) and FT246 (right) cells. Scale bar = 200μm. quantitative results showing the percentage of wound closure in the wound healing assays in FT194 and FT246 cells was presented in supplementary figure 15. c) RT-PCR results showing that knockdown of YAP with YAP siRNA (siYAP) blocks FGF2-induced expression of AREG mRNA in both FT194 (left panel) and FT246 (right panel) cells. FGF treatments had no effect on YAP and GAPDH mRNA expression. GAPDH was used as an internal control. d) FGF2 stimulates mRNA expression of basic and acidic FGFs in FTSECs. FT246 cells were transfected with non-targeting siRNA (siGLO) or YAP siRNA (siYAP) before treatment with or without FGF2 (10 ng/ml) for 48h. YAP, FGF1 and FGF2 mRNA was detected with RT-PCR. FGF2 stimulates FGF1 and FGF2 mRNA expression, but has no effect on YAP and GAPDH mRNA expression. GAPDH was used as an internal control.
Figure 9
Figure 9. The Hippo pathway is actively involved in the interaction between YAP and FGFR signaling pathway in the FTSECs
a) FGF2 suppresses the phosphorylation of the major components of the Hippo/YAP signaling pathways in FT194 cells. The total and phosphorylated proteins were determined by Western blot. b) Western blot analysis indicates that knockdown of LATS1/2 in FT194 cells using LATS1/2 specific siRNA activates YAP, AKT (S473) and ERK1/2. c) RT-PCR results showing that knockdown of LATS1/2 in FT194 cells induces expression of FGF1, FGF2, FGFR1, and FGFR4. d) Blockage of YAP and FGFR using verteporfin and BGJ398 inhibited FT194 cell proliferation induced by LATS1/2 knockdown. Each box represents Mean ± SEM of 4 independent experiments. Boxes with different letters are significantly different from each other. e) Blockage of YAP and FGFR using verteporfin and BGJ398 inhibited FT194 cell migration induced by LATS1/2 knockdown. BGJ: BGJ398 (1μM); VTPF: verteporfin (5μm). Scale bar=200μm.
Figure 10
Figure 10. The Hippo/YAP pathway interacts with FGF/FGFR pathway to regulate activities of FTSECs
a) Knockdown of FGFRs in FT194 and FT246 cells using FGFR siRNAs or blockage of FGFR activities using BGJ398 eliminate YAP- or constitutively active YAP-induced cell growth. Each bar represents mean ± SEM of four independent repeats. Bars with different letters are significantly different from each other (p<0.05). b) Verteporfin (YAP antagonist, 5 μM) and BGJ398 (FGFR inhibitor, 1μM) block YAP-induced growth of FT194 cells in a 3D-hanging drop culture system. c) Representative images from the soft agar assays showing that verteporfin and BGJ398 block YAP-induced colony formation in FT194 cells. d) Fluorescence-based quantitative soft agar assay showing that verteporfin and BGJ398 block YAP-induced colony formation in FT194 cells. Each bar represents mean ± SEM of four independent repeats. Bars with different letters are significantly different from each other (p<0.05). e) Representative images showing that treatment of tumor tissues derived from transformed FT194 cell mouse xenografts with BGJ398 (BGJ) or verteporfin (VTPF) suppressed tumor cell growth, which was indicated by the reduced expression of Ki-67 (Ki-67 positive cells are in green) (lower panel), and increased tumor cell apoptosis, which is indicated by TUNEL staining (TUNEL positive tumor cells are in green) (upper panel). Scale bar: 10μm.
Figure 11
Figure 11. Schematic diagram showing the signaling mechanisms underlying the Hippo/YAP pathway regulation of ovarian HGSC progression
a) Schematic diagram showing that the Hippo/YAP and FGF/FGFR pathways interact with each other to form a positive feedback loop to regulate activities of FTSECs. Our data indicated that dysfunction of the Hippo signaling pathway may lead to dysregulation of YAP protein expression or activation. Overexpression or constitutive activation of YAP protein in FTSECs is able to promote proliferation and drive transformation of these cells. Moreover, increased YAP activation stimulates secretion of FGF ligands and expression of FGFRs. Elevated FGF ligands bind to the increased FGF receptors to activate downstream signaling pathways such as PI3K and MAPK pathways, leading the suppression of the Hippo pathway and activation of YAP protein. Dysfunction of FGFR pathway may also have the similar effect on the FTSECs. The Hippo/YAP and FGF/FGFR pathways interact with each other to form a positive feedback loop to regulate activities of FTSECs. b) The clinical relevance of the discovered positive feedback loop is evidenced by the results from the multidimensional cancer genomics data analysis. These large-scale patient sample analyses indicate that 77% of ovarian HGSC cases (322/420) have alterations in major genes composing the positive feedback loop.

References

    1. Jemal A, Bray F, Center MM, Ferlay J, Ward E, Forman D. Global cancer statistics. CA Cancer J Clin. 2011;61:69–90. - PubMed
    1. Seidman JD, Horkayne-Szakaly I, Haiba M, Boice CR, Kurman RJ, Ronnett BM. The histologic type and stage distribution of ovarian carcinomas of surface epithelial origin. Int J Gynecol Pathol. 2004;23:41–44. - PubMed
    1. Selvaggi SM. Tumors of the ovary, maldeveloped gonads, fallopian tube, and broad ligament. Arch Pathol Lab Med. 2000;124:477. - PubMed
    1. Auersperg N, Wong AS, Choi KC, Kang SK, Leung PC. Ovarian surface epithelium: biology, endocrinology, and pathology. Endocr Rev. 2001;22:255–288. - PubMed
    1. Katabuchi H, Okamura H. Cell biology of human ovarian surface epithelial cells and ovarian carcinogenesis. Med Electron Microsc. 2003;36:74–86. - PubMed

MeSH terms