. 2016 May 19;35(20):2645-54.
doi: 10.1038/onc.2015.327. Epub 2015 Sep 14.

Mice deficient in Muc4 are resistant to experimental colitis and colitis-associated colorectal cancer

Affiliations

Mice deficient in Muc4 are resistant to experimental colitis and colitis-associated colorectal cancer

S Das et al. Oncogene. .

Abstract

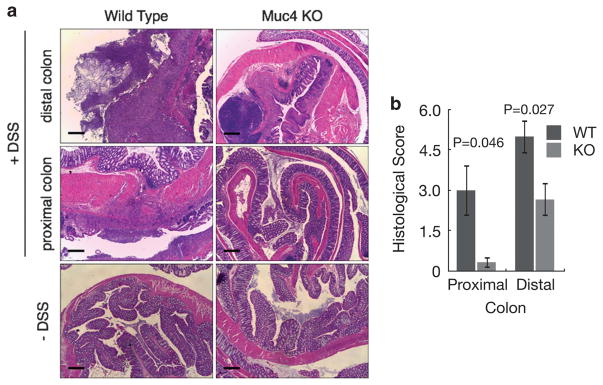
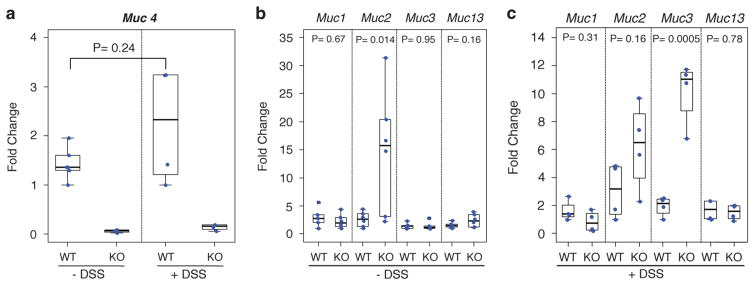
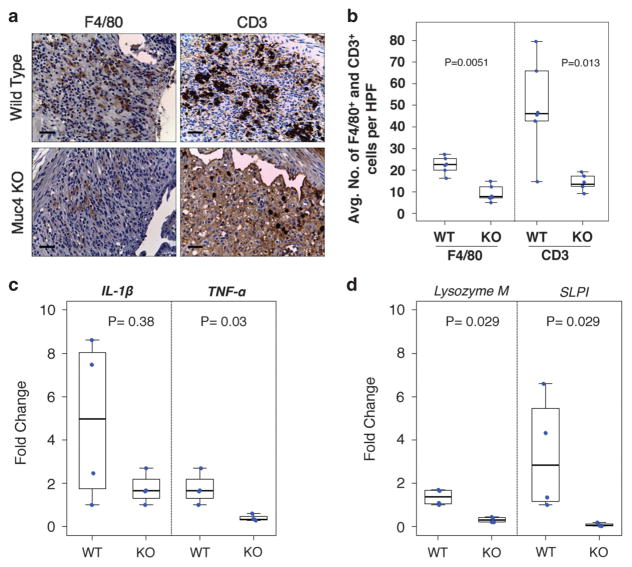
MUC4, a large transmembrane mucin normally expressed in the small and large intestine, is differentially expressed during inflammatory and malignant conditions of the colon. However, the expression pattern and the role of MUC4 in colitis and colorectal cancer (CRC) are inconclusive. Therefore, the aim of this study was to understand the role of Muc4 during inflammatory and malignant conditions of the colon. Here, we generated Muc4(-/-) mice and addressed its role in colitis and colitis-associated CRC using dextran sodium sulfate (DSS) and azoxymethane (AOM)-DSS experimental models, respectively. Muc4(-/-) mice were viable, fertile with no apparent defects. Muc4(-/-) mice displayed increased resistance to DSS-induced colitis compared with wild-type (WT) littermates that was evaluated by survival rate, body weight loss, diarrhea and fecal blood score, and histological score. Reduced infiltration of inflammatory cells, that is, CD3(+) lymphocytes and F4/80(+) macrophages was observed in the inflamed mucosa along with reduction in the mRNA levels of inflammatory cytokines interleukin (IL)-1β and tumor necrosis factor (TNF)-α and anti-microbial genes Lysozyme M and SLPI in the colon of Muc4(-/-) mice compared with WT littermates. Compensatory upregulation of Muc2 and Muc3 mucins under basal and DSS treatment conditions partly explains the resistance observed in Muc4(-/-) mice. Accordingly, Muc4(-/-) mice exhibited significantly reduced tumor burden compared with WT mice assessed in a colitis-induced tumor model using AOM/DSS. An increased percentage of Ki67(+) nuclei was observed in the tumors from WT compared with Muc4(-/-) mice suggesting Muc4 to be critical in intestinal cell proliferation during tumorigenesis. Taken together, we conclusively demonstrate for the first time the role of Muc4 in driving intestinal inflammation and inflammation-associated tumorigenesis using a novel Muc4(-/-) mouse model.


Conflict of interest statement

CONFLICT OF INTEREST

The authors declare no conflict of interest.

Figures

Figure 1
Figure 1
Targeted disruption of mouse Muc4 gene. (a) Schematic representation of the targeting construct used for generation of Muc4/ mice. The targeting construct containing IRES-LacZ-hbactP-Neo cassette was used to replace exons 2–6 of Muc4 (represented as the black boxes) through homologous recombination. The blue ( formula image) and red ( formula image
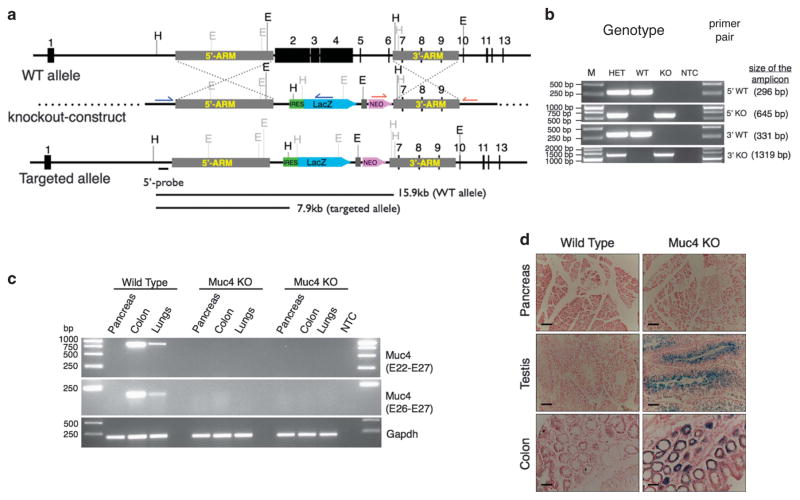
) half arrows indicate the position of the primers used for long-range PCR analysis for homologous recombination at 5′ and 3′ regions respectively. (b) PCR analysis using the genomic DNA extracted from the tail biopsies for genotyping. Each mouse was genotyped for WT and KO primer pairs for both 5′ and 3′ regions. (c) Reverse transcriptase (RT)–PCR analysis using primers for the 3′ region (exon-22 forward-primer: exon-27 reverse-primer and exon-26 forward-primer: exon-27 reverse-primer) of Muc4 confirmed the deletion of Muc4. Normal colon and lungs express Muc4, whereas normal pancreas does not. (d) LacZ staining of pancreas, testes and lungs from WT and Muc4−/− mice. LacZ expression indicates successful deletion of Muc4. As normal pancreas does not express Muc4, LacZ expression is not seen in Muc4−/−pancreas. Scale bar, 500 μm.
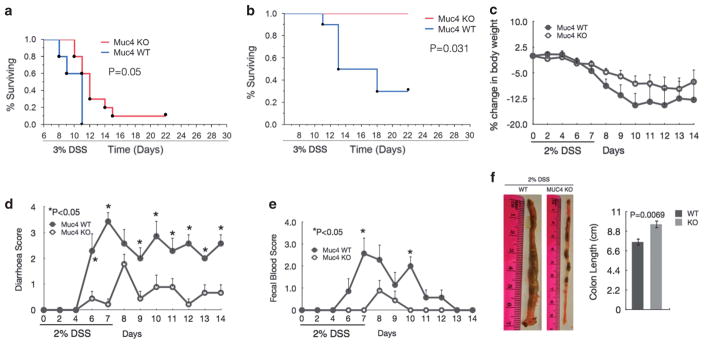
Figure 2
Figure 2
Muc4−/− mice display enhanced resistance to DSS-induced colitis compared with WT mice. (a, b) Kaplan–Meier survival analysis of age-matched WT (5 males and 10 females) and Muc4−/− (10 males and 5 females) mice following treatment of 3% DSS in drinking water for 21 days; males (a) and females (b). As female mice of both WT and Muc4−/− categories displayed less susceptibility to colitis-induced mortality compared with male mice of either group, we performed separate analysis for males and females using log-rank test (P-values shown). (ce) Percentage change in body weight compared with the baseline weight (c), diarrhea score (d) and fecal blood score (e) in age-matched WT (n = 7) and Muc4−/− (n = 9) male mice after 2% DSS treatment for 7 days followed by 7 days of regular water. Student’s t-test; error bars indicate mean ±s.e.m., P-values shown. (f) WT male mice (n = 7) had shortened and edematous colon compared with Muc4−/− male mice (n = 7) after 2% DSS treatment for 7 days. Student’s t-test; error bars indicate mean ±s.e.m., P-values shown.
Figure 3
Figure 3
WT mice exhibit severe histopathological alterations compared with Muc4−/− mice following DSS-induced colitis. (a) Representative hematoxylin and eosin-stained colonic sections from WT and Muc4−/− mice with or without 2% DSS treatment. Although no histological difference was observed in mice without DSS treatment, WT mice displayed extensive epithelial ulceration, erosions, severe crypt damage and massive infiltration of inflammatory cells in to the colonic mucosa compared with the Muc4−/− mice. This effect was more pronounced in the distal colon compared with the proximal colon. Scale bar, 500 μm. (b) Quantification of histolopathological abnormalities in male WT (n = 7) and Muc4−/− (n = 9) mice following 2% DSS-induced colitis based on extent of tissue damage and inflammatory cell infiltration. Student’s t-test; error bars indicate mean ±s.e.m., P-values shown.
Figure 4
Figure 4
Expression of colonic mucin genes in WT and Muc4−/− male mice in response to DSS-induced tissue damage. (a) Expression analysis of Muc4 was determined using mRNA extracted from the frozen colon tissues from WT and Muc4−/−male mice with (n = 4) and without (n = 6) 2% DSS treatment. (b, c) Expression analysis of other colonic mucins Muc1, Muc2, Muc3 and Muc13 was determined using mRNA extracted from the frozen colon tissues from WT and Muc4−/− male mice without (n = 6) (b) and with (n = 4) (c) 2% DSS treatment. Real-time PCR was performed to quantitate the mRNA expression. Expressed relative to Gapdh and the fold change in expression was calculated with respect to WT mice. The statistical analysis was done with data transformed to the log2 scale using t-tests, and the means and 95% confidence intervals (CIs) were back transformed to the original scale, P-values shown.
Figure 5
Figure 5
Reduced infiltration of histiocytes and T-lymphocytes and expression of inflammatory cytokines in the colon of Muc4−/− male mice compared with WT male mice following DSS-induced colitis. (a) Representative colon sections from WT and Muc4−/− male mice stained with F4/80+ histiocytes and CD3+ T-lymphocytes after 2% DSS treatment for 7 days followed by 7 days of recovery. Scale bar, 500 μm. (b) Quantitative representation of average number of F4/80+ histiocytes and CD3+ T-lymphocytes per high-powered field (HPF) with 10 HPFs per mouse from male WT (n = 6) and male Muc4−/− mice (n = 6). Wilcoxon rank sum test was used to compare the average number of CD3+ and F4/80+ cells between WT and Muc4−/− mice groups, P-values shown. (c, d) Expression analysis of inflammatory cytokines (c) and antimicrobial factors (d) was determined using mRNA extracted from the frozen colon tissues from WT and Muc4−/− male mice with 2% DSS treatment. Real-time PCR was performed to quantitate the mRNA expression (n = 4). Expressed relative to Gapdh and the fold change in expression was calculated with respect to WT mice. The statistical analysis was done with data transformed to the log2 scale using t-tests, and the means and 95% confidence intervals (CIs) were back transformed to the original scale, P-values shown.
Figure 6
Figure 6
Colorectal tumorigenesis was delayed and less severe in Muc4−/− mice after AOM/DSS treatment. (a) Schematic for AOM/DSS treatment protocol for induction of colorectal tumor in WT and Muc4−/− mice (both males and females). (b) Representative longitudinal luminal views of colons from WT and Muc4−/− mice at the end of the AOM/DSS treatment protocol. WT mice display increased number and larger tumor nodules compared with the Muc4−/− mice. We used Alcian blue (the blue colored dye) as a smear to demarcate the boundaries of the tumor nodules that was very helpful in counting and measuring the numbers and size of the tumor nodules respectively. (c) Tumor nodules were compared between WT (n = 9) and Muc4−/− mice (n = 9), for <2 mm and >2 mm separately using Wilcoxon rank sum test, P-values shown. Both male and female mice were included in this study.
Figure 7
Figure 7
Muc4-mediated cellular proliferation contributes to enhanced colitis-associated tumorigenesis. (a) Representative hematoxylin and eosin-stained colonic sections from the WT and Muc4−/− mice after AOM/DSS treatment. Tumors in the WT mice were found with frequent invasion into submucosa and sometimes to muscularis propria (yellow arrow), whereas tumors in the Muc4−/− mice were of carcinoma in situ (CIS, red arrow) type with invasion into lamina propria. Scale bars, 500 μm. (b) Representative colon tumor sections from WT and Muc4−/− mice with Ki67 staining. Scale bars, 500 μm. (c) Percentage of Ki67+ nuclei was determined as a ratio of Ki67+ nuclei to total nuclei per high-powered field (HPF) with 10 HPFs per mouse from the WT (n = 6) and Muc4−/− mice (n = 7) group. Wilcoxon rank sum test was used to calculate the statistical significance, P-value shown. Both male and female mice were included in this study. (d) Representative immunohistochemical staining of colon tumor sections from WT and Muc4−/− mice with β-catenin staining. Nuclear β-catenin staining is seen in the neoplastic tissues (red arrow) with the cytoplasmic β-catenin staining in the adjacent non-neoplastic crypts (red arrow heads). Scale bars, 500 μm.

References

    1. Siegel R, Ma J, Zou Z, Jemal A. Cancer statistics, 2014. CA Cancer J Clin. 2014;64:9–29. - PubMed
    1. Sheng YH, Hasnain SZ, Florin TH, McGuckin MA. Mucins in inflammatory bowel diseases and colorectal cancer. J Gastroenterol Hepatol. 2012;27:28–38. - PubMed
    1. McGuckin MA, Linden SK, Sutton P, Florin TH. Mucin dynamics and enteric pathogens. Nat Rev Microbiol. 2011;9:265–278. - PubMed
    1. Van Klinken BJ, Tytgat KM, Buller HA, Einerhand AW, Dekker J. Biosynthesis of intestinal mucins: MUC1, MUC2, MUC3 and more. Biochem Soc Trans. 1995;23:814–818. - PubMed
    1. Zhang J, Yasin M, Carraway CA, Carraway KL. MUC4 expression and localization in gastrointestinal tract and skin of human embryos. Tissue Cell. 2006;38:271–275. - PubMed